A protocol for hydrothermal carbonization of vegetable food waste in an autoclave is presented, with subsequent dry thermal treatment at 275 °C in a continuous flow reactor desorbing volatile organic substances. The aim is to produce a carbon material suitable as soil amendment product or substrate component.
Method Article
Transformation of Organic Household Leftovers into a Peat Substitute
In This Article
Summary
Abstract
A two-step procedure is described for the synthesis of a carbon material with a similar composition and properties as peat. The produced hydrochar is made suitable for agricultural applications by removing plant growing inhibitory substances. Wet household waste such as fruit peel, coffee grounds, inedible vegetable parts, or wet lignocellulosic material in general, are treated in presence of water at 215 °C and 21 bar in an autoclave, i.e., by hydrothermal carbonization. All these leftovers have a considerable water content of up to 90 weight % (wt%). Adding water extends the procedure to drier materials such as nutshells or even garden prunings and compostable polymers, i.e., the plastic bag for collection of the leftovers.
Usually, the resulting carbon material, called hydrochar, produces a negative effect on plant growth when added to soil. It is supposed that this effect is caused by adsorbed phytotoxic compounds. A simple post-treatment under inert atmosphere (absence of oxygen) at 275 °C removes these substances. Therefore, the raw hydrochar is placed on a glass frit of a vertical tubular quartz reactor. A nitrogen gas flow is applied in down-flow direction. The tube is heated to the desired temperature by means of a heating mantle for up to one hour.
The success of the thermal treatment is easily quantified by thermogravimetry (TG), carried out in air. A weight loss is determined when the temperature of 275 °C is reached, since volatile content is desorbed. Its amount is reduced in the final material, in comparison to the untreated hydrochar.
The two-step treatment converts household leftovers, including compostable bags employed for their collection, into a carbon material that may serve as plant growth promoter and, at the same time, as a carbon sink for climate change mitigation.
Introduction
Hydrothermal carbonization (HTC) is an emerging technology for waste management of wet, lignocellulosic resources. This technology was rediscovered by Antonietti and Titirici and applied to pine needles, pine cones, oak leaves and orange peels1. Thereby, the biomass is converted into hydrochar, a carbonaceous solid similar to lignite2,3 or peat4,5. Since then, many residual feedstocks have have processed such as agro-industrial waste6,7,8, the organic fraction of municipal solid waste (OFMSW)9, or paper mill sludge10. The technology is also used as biomass pretreatment for pyrolysis and gasification11. In addition, the procedure provides modern nanotechnology materials from homogeneous renewable resources such as sugars or cellulose. These advanced materials have potential for future applications as electrodes for rechargeable batteries, fuel cells or supercapacitators, gas storage, sensors or drug delivery12,13.
Hydrochar is a carbon material and as such it could be used as renewable solid fuel, especially when produced from low-value, heterogeneous resources with variable (seasonal or regional) composition. However, hydrochar production and its application to soil, instead of its immediate combustion, will have a triple contribution to climate change mitigation. First, choosing HTC as waste management technology avoids emission of the powerful greenhouse gas methane during composting or uncontrolled decomposition14,15. Second, avoiding combustion of hydrochar after a short period of time and applying it to soil, removes the carbon dioxide from the atmosphere for a longer period of time, i.e., it consists in real carbon capture and storage (CCS)16,17. Third, in general, char amended soils are more fertile soils (black soils) and plant growth is increased.18,19 This reduces fertilizer use and carbon dioxide emissions related to their production, besides preserving resources. Moreover, additional plant growth removes more carbon dioxide from the atmosphere.
Although it is quite clear that there are many apparent arguments for the application of hydrochar to soil, the material involves an inconvenience: raw hydrochar does not behave exactly as biochar that is produced by pyrolysis. Hydrochar does not clearly increase plant growth or even worse, frequently it causes a rather negative effect20,21,22. Therefore, farmers are not encouraged to apply it, and even less to pay money for it. Fortunately, this drawback can be mitigated or eliminated. The easiest approach is to simply wait for the second cultivation cycle22. Also washings20,21,22,23 or co-composting24 are successful treatments for this purpose. However, all these procedures require time or produce an aqueous stream that need further care.
Recently, it has been shown that raw hydrochar can be subjected to a soft thermal post-treatment25. The aim of this procedure is to simply desorb the undesired volatile and harmful substances. The resulting concentrated flow of mainly organic matter can be valorized thermally in situ. As such, the energy balance of the HTC plant is improved and any environmental risk of the side stream is prevented. Germination tests show that the treatment is successful when carried out at temperatures of 275 °C or higher.
The present protocol (see Figure 1) involves two reaction steps and one straightforward analytical method for the evaluation of the reaction outcome. During the first step, biomass is converted into raw hydrochar in an autoclave at 215 °C and at 21-bar pressure. Here, household leftovers are employed as starting material. These include all kinds of vegetable material such as fruit peels, fruit stones, inedible vegetable parts, coffee grounds, kitchen paper, compostable plastic bags, etc. The carbonaceous material is collected by filtration and dried. For the second step, it is placed on a glass frit of a vertical tubular reactor applying gas flow in a downward flow direction. The tube is heated to 275 °C for 1 h. The resulting solid is analyzed by thermogravimetry (TG) in air. The material loss up to 275 °C is quantified and compared to the loss observed with untreated hydrochar. The carbon material can be further characterized by elemental analysis (C, H, N, and S), ash content and ash composition (mainly Ca, Al, Si, and P).
Protocol
1. Hydrothermal carbonization of household leftovers
- Calculation of the suitable amounts of water and biomass for the reaction mixture.
- The reaction mixture must fill half of the volume of the autoclave. Assume that the density of the mixture is approximately 1 g/mL and calculate the amounts by weight. Approximately 80 wt% should be water and the rest solid matter. Overall water content is not crucial and may range from 70 to 85 wt%.
- Select the biomass from kitchen leftovers such as fruit peels or inedible vegetable parts. With the aim to calculate an exact mass balance for section 1, dry a sample of the biomass at 100–105 °C in an oven for 2 h or overnight. The obtained mass is the solid matter of the biomass. Alternatively, use literature data (accuracy is reduced).
- Calculate how much wet biomass is required to charge the autoclave with 20 wt% of solid matter and how much of water is to be introduced together with it. Calculate how much water is required to reach the desired water amount in the reactor.
- Charging the autoclave.
CAUTION: The autoclave has to be provided with a rupture disc with a burst pressure of 50 bar.- Weigh biomass and water as calculated in step 1.1.3 and introduce both into the autoclave.
- Close the autoclave and pressurize it with nitrogen up to 20 bar. Confirm that there is no pressure loss over 30 min. This ensures that the vessel is properly closed without any leaks. Release the pressure and close the vessel again.
- Carbonization reaction.
- Switch on the stirring. Heat the autoclave to 215 °C within 30 min and maintain the temperature for at least 4 h or overnight.
- Monitor the pressure for the first 2 h. In general, it follows the vapor pressure curve of water up to 21 bar. If the pressure does not increase, either the heating is not working correctly, or the vessel is not closed properly. If this happens, stop the reaction and check the heating and sealing.
- In rare cases, e.g., if the biomass is prone to decarboxylation, the maximum pressure might be 5 to 10 bar higher than the 21 bar caused by steam pressure at 215 °C. If the pressure exceeds 35 bar, switch off the heating and interrupt the reaction. After it has cooled down to room temperature carefully release the remaining pressure and start again from step 1.3.1.
- Recovery of the raw hydrochar.
- When the autoclave has cooled down to room temperature by natural cooling, carefully release any residual pressure and open the autoclave.
- Separate solid and liquid by vacuum filtration with a Buchner funnel. Dispose the of the liquid phase as aqueous solution among hazardous laboratory waste.
- Dry the solid at 100 to 105 °C in an oven for 2 h or overnight. Calculate the mass balance of the first step, i.e. the hydrothermal carbonization (section 1). For this, take into account dry weight of the biomass and dry weight of the product.
2. Thermal treatment of raw hydrochar in batch mode
- Weigh 1 g of dry raw hydrochar and place it on a glass frit of a tubular quartz reactor (batch reactor).
- For larger amounts such as 10 to 20 g, use pelletized material with a particle size of 0.2 to 6 mm. Otherwise, the occurrence of preferred channels might impede homogeneous treatment of the sample.
- Place the heating mantle of the reactor and connect a down-flow nitrogen stream of 20 mL/min. Place a small beaker below the reactor outlet to collect condensed liquids. Cooling is not required.
- Aspirate gases at the outlet and conduct them to the exhaust or place the whole reactor in an exhaust hood. Heat the reactor to 275 °C with a ramp of 10 degrees/min. Maintain the temperature for 1 h.
- When cooled down to room temperature again, disconnect the gas flow. Discard the liquid collected in the beaker to the nonhalogenated organic residues. Recover the carbon material and weigh it. Calculate the mass balance for section 2, i.e. the thermal treatment, from the masses employed and obtained, and for the overall reaction from the mass obtained in the thermal treatment and the dry biomass employed in the carbonization step.
3. Analysis of the final product by thermogravimetry (TG)
- Crush the product in a mortar and weigh a 10 mg sample in a crucible of the apparatus.
- Place the crucible in the autosampler of the TG apparatus and select the analysis conditions: adjust the maximum temperature to 600 °C and the employ air as sweep gas and a temperature ramp of 10 degrees/min.
- Start the analysis.
- Quantify the mass loss at 275 °C in the TG curve by calculating the difference between initial weight and that observed at this temperature (see Figure 2). Express the mass loss as percentage of the initial weight. Compare the values of treated and raw samples. A clear reduction is observed.
Results
The present protocol provides hydrochar suitable for agricultural applications in two steps (Figure 1): hydrothermal carbonization, which is followed by a thermal post-treatment. In the carbonization reaction, wet lignocellulosic biomass is transformed into a carbonaceous material. The success of the reaction can be determined by simple visual inspection: the solid sample has to have turned brownish, and the darker the brown color, the more advanced the carbonization reaction. The carbonization degree depends on the reaction severity, which can be influenced by the reaction time; a longer reaction time, for instance overnight, ensures an optimal reaction outcome. A higher carbonization degree is always related to a lower mass yield.
The pressure during the reaction has to increase to at least 21 bar, which is the autogenous steam pressure at 215 °C. However, in general the pressure increases beyond this value as shown in Table 1. The reaction pressure is somehow unpredictable and depends on the kind of biomass and its state of degradation. It is likely that the formation of permanent gases, such as carbon dioxide is responsible for the pressure increase and the pressure increment during the reaction (with respect to the steam pressure of 21 bar) remains after cooling down the autoclave (Table 1; diminished by adjustment to lower temperature). The increased pressure might have an adverse effect on the mass yield of the solid (raw material is converted into gaseous carbon dioxide), but apart from this, it is not detrimental to the overall objective. A clear limitation of the pressure increase is the safety limit of the reaction apparatus, e.g., the burst pressure of the rupture disc. Small leaks could be the reason that the 21-bar pressure is not reached. However, pressure should reach at least 15 bar.
The mass yield of the carbonization involves a broad range from 30 to 90 wt%, typically from 50 to 65 wt% (Table 1). Mass yield is usually higher for woodier material with a higher lignin content and lower for pure sugar polymers (polyacetals) such as starch. For instance, lower yields are observed for leaves or compostable bags. In addition, reaction severity influences the mass yield. As already mentioned, prolonged reaction times reduce the mass yield in comparison to yields obtained by shorter reactions.
If desired, the raw hydrochar can be characterized chemically by elemental analysis26,27. Thereby, the carbon content is indicative of the carbonization degree. Lignocellulosic biomass has a carbon content (on dry and ash-free basis [daf]) of 45 wt%. This value can be increased to 60 or 65 wt% by HTC. Values above 65 wt% indicate an already advanced carbonization in terms of HTC. For example data see Table 2.
The lignocellulosic biomass can be employed as “pure samples” for hydrothermal carbonization as described in the present protocol. This might be of special interest for the study of the behavior of a certain type of biomass. However, in practice, mixtures of biomass types are processed. Therefore, in the present protocol a sample of hydrochar from an industrial pilot plant was employed. The characteristics of this hydrochar are summarized in Table 3.
The thermal post-treatment, the second step of this protocol, was carried out at different temperatures, in the range of 200 to 300 °C, 275 °C being the necessary and sufficient temperature25. From Table 4 it can be seen that mass yield decreases successively when temperature is raised from 200 to 250°C, 275 °C and 300 °C, and from almost 90 wt% to 73 wt%, 74 wt% and 60 wt%, respectively. However, due to the heterogeneity of biomass, and other possible contributions from the kitchen leftover mix, this value is not fully reproducible and may vary in the range from 70 wt% to 80 wt% for the treatment at 275 °C.
In a beaker placed below the reactor outlet a brown liquid is collected, which separates into two phases upon standing: a yellow lower aqueous phase and an upper dark brown organic phase. The yield for the liquid varies from 8 wt% to 30 wt% for the temperature range from 200 to 300 °C, and averages around 20wt% for the treatment at 275 °C (Table 4).
It can be seen that the mass balance of the thermal treatment does not reach 100 wt%, but sums up to 90 to 95 wt%. Perhaps the formation of 5 to 10 wt% of carbon dioxide, produced by decarboxylation, is the reason for the gap. In addition, volatile compounds such as water are not condensed completely with the reaction set-up.
The final product can be analyzed for its phytotoxicity by Zucconi’s germination test28. In brief, seeds are exposed to aqueous extracts and the effect on root growth is quantified (after several days or weeks). Herein, a straightforward, standard analysis is employed for a rapid evaluation of the reaction outcome, namely analysis by thermogravimetry (TG). Hereby, a small sample is exposed to an airflow at increasing temperature (e.g., up to 600 °C) and the weight reduction is monitored.
Typical TG graphs for different hydrochar samples are displayed in Figure 2. The mass loss for the raw hydrochar starts at approximately 200 °C and reaches almost 50% at 300 °C. For the sample treated at 200 °C during step 2, the mass loss starts again at 200 °C, but at 300 °C 70% remains. The samples treated at higher temperature during step 2 start to lose mass during TG analysis at higher temperature and approximately 90% remains at 300 °C. Hence, it can be seen that the loss of volatiles between 200 and 300 °C is reduced when comparing the one for the treated samples with raw hydrochar. The elimination of this volatile material was the aim of the thermal treatment and the analytical method confirms it success unambiguously28.
For the quantification, the mass loss at 275 °C may be determined using the TG graph (Figure 2). In Figure 3, the whole bar presents the mass loss for the untreated hydrochar sample (34.6 wt%). After the treatment at 200 °C, the mass loss was 17.1 wt% of total mass under the specified analytical conditions. This corresponds to a reduction of volatile content of 17.5 percentage points with respect to raw hydrochar. After treatments at 250, 275 and 300 °C, the corresponding mass loss was 6.01, 5.17, and 4.22 wt% of the total mass, respectively. It can be concluded that the treatment at 200 °C removed 50 wt% of these volatiles, and the one at 250 °C removed more than 80 wt%. Further temperature increase induced only small changes.

Figure 1: Schematic description of the protocol.
Lignocellulosic biomass residues produced by households are converted by hydrothermal carbonization (HTC) into raw hydrochar which is submitted to a finishing process consisting in a thermal post-treatment at 275 °C in the absence of water. Please click here to view a larger version of this figure.
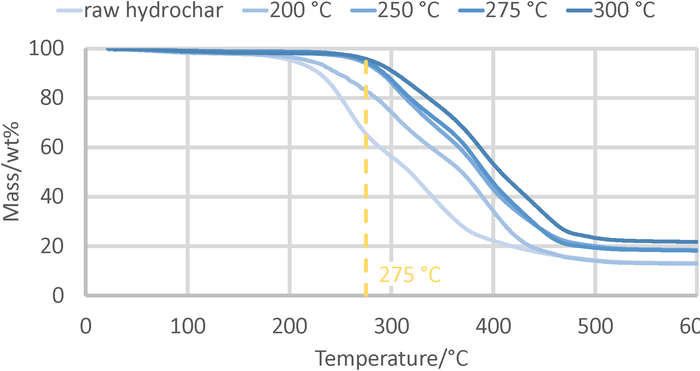
Figure 2: Thermogravimetric analysis of hydrochar samples.
The curves show the weight loss when raw hydrochar and samples treated at different temperatures were exposed to air at increasing temperature. The values observed at 275 °C were used for the comparison of the efficiencies of the treatments in Figure 3. Please click here to view a larger version of this figure.
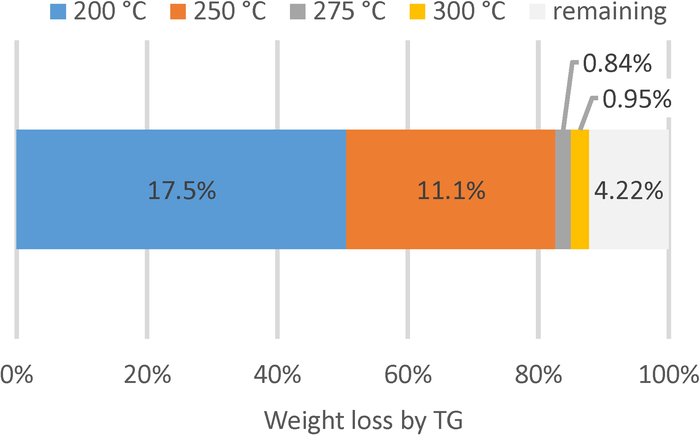
Figure 3: Weight loss up to 275 °C during analysis of hydrochar by thermogravimetry.
Raw hydrochar and samples treated at different temperatures were analyzed by thermogravimetry (TG). The whole bar corresponds to the amount eliminated in untreated hydrochar up to 275 °C during analysis by TG (see Figure 2). This amount can be reduced by thermal treatments of the hydrochar samples: by approximately 50 wt%, namely by 17.5 percentage points, by the treatment at 200 °C (blue color); another 11.1 percentage points by the treatment at 250 °C (red color); further temperature increase of the treatment temperature only show minimal effects, namely 0.84 and 0.95 percentage points for the treatments at 275 °C (grey) and 300 °C (orange), respectively. Please click here to view a larger version of this figure.
| Sample | Moisture | Water added | Total water | Pressure (hot/cold) | Yield solid (dry) | Yield solid (dry) | |
| Raw material | [g] | [wt%] | [g] | [wt%] | [bar] | [g] | [wt%] |
| Fruit leftovers | |||||||
| Pistachio shells | 5.00 | 8.0 | 10.1 | 69.5 | 22/0 | 2.28 | 49 |
| Olive stones | 5.10 | 9.0 | 10.1 | 69.5 | 31/9 | 2.55 | 55 |
| Apricot kernel | 8.74 | 11.5 | 3.33 | 35.9 | 26/13 | 2.56 | 33 |
| Plum stones | 4.95 | 33.6 | 10.2 | 78.3 | 28/9 | 2.11 | 64 |
| Cherry stones | 7.61 | 45.8 | 4.03 | 64.6 | 30/10 | 2.62 | 64 |
| Nispero stones | 10.7 | 53.0 | 2.41 | 61.6 | 40/14 | 2.57 | 51 |
| Nectarine stones | 9.65 | 48.6 | 5.44 | 67.1 | 27/10 | 3.30 | 67 |
| Banana skin | 15.2 | 89.0 | 2.27 | 90.4 | 25/9 | 0.93 | 56 |
| Melon skin | 16.1 | 87.4 | 2.32 | 89.0 | 24/8 | 0.64 | 32 |
| Pineapple core | 15.5 | 86.1 | 2.15 | 87.8 | 26/9 | 1.30 | 60 |
| Vegetable leftovers, plants and herbaceous material | |||||||
| Palm leaves | 12.6 | 55.1 | 2.17 | 61.7 | 42/17 | 4.95 | 87 |
| Palm tree | 15.0 | 78.5 | 2.11 | 81.2 | 23/4 | 1.47 | 45 |
| Pineapple leaves | 15.4 | 78.4 | 1.74 | 80.6 | 21/8 | 1.00 | 30 |
| Coffee grounds | 10.8 | 60.9 | 5.08 | 73.4 | 20/9 | 2.73 | 65 |
| Artishoke leaves | 15.1 | 80.2 | 2.18 | 82.7 | 31/9 | 1.53 | 51 |
| Lettuce leaves | 15.3 | 91.3 | 1.77 | 92.2 | 20/5 | 0.39 | 29 |
| Calçot leaves | 15.0 | 72.7 | 2.80 | 77.0 | 29/11 | 1.54 | 38 |
| Bean pods | 15.1 | 82.6 | 2.30 | 84.9 | 31/4 | 1.43 | 55 |
| Compostable bags | |||||||
| Compostable bag for everyday use | 5.01 | 0 | 10.0 | 66.7 | 20/4 | 2.08 | 42 |
| Bag for composting | 2.50 | 0 | 5.00 | 66.7 | 16/3 | 0.92 | 37 |
| Compostable coffee capsule (with coffe grounds) | 5.56 | 31.4 | 8.05 | 72.0 | 26/7 | 1.19 | 31 |
Table 1: Experimental data for the hydrothermal carbonizations.
Amounts of solid matter and water used for the reactions and yield of hydrochar obtained. The pressure value indicates the maximum pressure observed when heated to 215 °C (hot) and after cooling down the autoclave to room temperature (cold).
| C (daf) | H (daf) | N (daf) | S (daf) | |
| Raw material | [wt%] | [wt%] | [wt%] | [wt%] |
| Fruit leftovers | ||||
| Pistachio shells | 68.0 | 4.66 | 0.34 | 0.00 |
| Olive stones | 70.0 | 5.97 | 0.81 | 0.00 |
| Apricot kernel | 68.6 | 6.16 | 2.21 | 0.00 |
| Plum stones | 69.8 | 6.44 | 1.48 | 0.01 |
| Cherry stones | 67.4 | 5.52 | 1.13 | 0.00 |
| Nispero stones | 67.1 | 5.47 | 1.90 | 0.03 |
| Nectarine stones | 68.8 | 5.39 | 0.88 | 0.04 |
| Banana skin | 71.7 | 6.41 | 2.91 | 0.06 |
| Melon skin | 69.1 | 6.24 | 2.56 | 0.08 |
| Pineapple core | 68.3 | 5.33 | 1.54 | 0.02 |
| Vegetable leftovers, plants and herbaceous material | ||||
| Palm leaves | 63.7 | 6.47 | 2.65 | 0.20 |
| Palm tree | 63.2 | 6.09 | 2.02 | 0.03 |
| Pineapple leaves | 60.0 | 6.52 | 2.24 | 0.11 |
| Coffee grounds | 66.8 | 6.63 | 3.54 | 0.17 |
| Artishoke leaves | 63.2 | 5.77 | 3.28 | 0.13 |
| Lettuce leaves | 57.8 | 6.09 | 3.48 | 0.18 |
| Calçot leaves | 63.9 | 5.82 | 3.79 | 0.55 |
| Bean pods | 68.0 | 6.17 | 4.18 | 0.14 |
| Compostable bags | ||||
| Compostable bag for everyday use | 56.8 | 5.15 | 0.09 | 0 |
| Bag for composting | 61.1 | 5.38 | 0.09 | 0 |
| Compostable coffee capsule (with coffe grounds) | 60.5 | 5.57 | 2.56 | 0 |
Table 2: Elemental analysis of hydrochar samples.
| Property | Unit | Value |
| Ash content (dry basis; 815 °C) | [wt%] | 12.9 |
| Volatiles (dry basis; 900 °C) | [wt%] | 66.4 |
| Fixed carbon (dry basis) | [wt%] | 20.8 |
| C (daf) | [wt%] | 66.1 |
| H (daf) | [wt%] | 7.4 |
| N (daf) | [wt%] | 3.0 |
| S (daf) | [wt%] | 0.2 |
Table 3: Proximate analysis and elemental analysis of the hydrochar sample used in the thermal treatments28.
| yield | yield | |||||||||||||
| initial mass (hydrochar) | Temperature | final mass (hydrochar) | mass liquid | AF | OF | mass balance | yield solid | yield liquid | AF | OF | ||||
| Entry | [g] | [°C] | [g] | [g] | [g] | [g] | [%] | [wt%] | [wt%] | [wt%] | [wt%] | |||
| 1 | 15.3 | 275 | 11.0 | 3.14 | 0.125 | 3.02 | 92.2 | 71.7 | 20.5 | 0.82 | 19.7 | |||
| 2 | 20.5 | 275 | 15.6 | 3.82 | 0.74 | 3.05 | 94.4 | 75.8 | 18.6 | 3.61 | 14.9 | |||
| 3 | 30.7 | 275 | 22.5 | 6.79 | 1.01 | 5.78 | 95.6 | 73.5 | 22.1 | 3.29 | 18.8 | |||
| 4 | 15.7 | 200 | 13.7 | 1.27 | 0.26 | 1.01 | 95.8 | 87.7 | 8.10 | 1.66 | 6.44 | |||
| 5 | 15.3 | 250 | 11.2 | 3.27 | 0.25 | 3.02 | 94.5 | 73.2 | 21.3 | 1.63 | 19.7 | |||
| 6 | 15.0 | 300 | 9.07 | 4.46 | 0.593 | 3.87 | 90.1 | 60.4 | 29.7 | 3.95 | 25.8 | |||
| 7a | 15.3 | 275 | 11.8 | 1.79 | 1.02 | 0.77 | 88.9 | 77.2 | 11.7 | 6.68 | 5.05 | |||
| a Carried out with hydrochar produced from garden prunings instead of the OFMSW. | ||||||||||||||
Table 4: Experimental data from the thermal treatments.
After the reaction, a solid and a liquid is recovered. The liquid separated upon standing into an aqueous (AF) and an organic fraction (OF). The missing amount is attributed to permanent gas formation, e.g., carbon dioxide and incomplete condensation of volatile matter such as water.
Discussion
The hydrothermal carbonization is a very resilient method and always provides a carbonaceous product, i.e., the hydrochar. However, yield and properties of the hydrochar might vary, not only due to reaction conditions or reaction control, but rather due to heterogeneity and variation of the biomass. For instance, mass yield and C content might be higher for lignocellulosic biomass with a higher lignin content or woody materials.
In the case that a higher carbonization degree (quantified by elemental analysis) is desired, the hydrochar can be resubmitted to the carbonization reaction. Alternatively, in future reactions reaction time can be prolonged or reaction temperature can be increased (caution, autogenous water pressure increases exponentially with temperature).
The outcome of the thermal treatment also depends on the composition of the raw material. For instance, if the biomass involves other organic components such as vegetable oil, the thermal treatment will separate these volatile compounds from the solid and mass loss will be greater.
In the present protocol, both steps are carried out in batch mode. For industrial application, the whole production process has to be carried out in continuous mode. The hydrothermal carbonization is already carried out as a continuous process26,27, but the thermal treatment still has to be developed further. The final aim is to convert the OFMSW into a carbonaceous material with peat properties so that employing peat (considered to be a fossil material) increases in agriculture and horticulture with clear benefits for the environment and as a contributor to climate change mitigation.
Disclosures
Marisa Hernandez and Borja Oliver-Tomas are employees of Ingelia SL that produced hydrochar samples used in this article. Maria Consuelo Hernández-Soto, Estefanía Ponce, and Michael Renz have nothing to disclose.
Acknowledgements
The Authors are grateful for the financial support received from the European Commission under the CharM and AdvCharM of the Climate-KIC Programme and from the Spanish Ministry of Science, Innovation and Universities under RTC-2017-6087-5 of the “Investigación, Desarrollo e Innovacion Orientada a los Retos de la Sociedad” Programme and under the Severo Ochoa program (SEV-2016-0683).
Materials
| Name | Company | Catalog Number | Comments |
|---|---|---|---|
| Autoclave with a vessel volume of 100 to 500 mL | |||
| Continuous flow tubular calcination reactor with glass frit | Cuartz tube: 37 cm long, 20 mm outer diameter, glass frit (3 mm thickness) at 22 cm from the top of the tube | ||
| Vacuum filtration system | Buchner funnel, filter paper, filter flask | ||
| Oven for drying samples at 100 °C | |||
| Thermogravimetric analyzer | E.g. Netzsch STA 449F3 Jupiter with Netzsch STA 449F3 software and Netzsch ASC Manager software for autosampler control | ||
| Any king of vegetable biomass (for examples see tables 1 and 2) including: | |||
| Compostable plastic bags from BASF | |||
| Plastic bags for collection of the organic fraction in households, provided by local waste managers | |||
| Compostable coffee capsules ecovio (BASF) |
References
- Titirici, M. M., Thomas, A., Yu, S. H., Mueller, J. O., Antonietti, M. A. Direct Synthesis of Mesoporous Carbons with Bicontinuous Pore Morphology from Crude Plant Material by Hydrothermal Carbonization. Chemistry of Materials. 19 (17), 4205-4212 (2007).
- Düdder, H., Wütscher, A., Stoll, R., Muhler, M. Synthesis and characterization of lignite-like fuels obtained by hydrothermal carbonization of cellulose. Fuel. 171, 54-58 (2016).
- Funke, A., Ziegler, F. Hydrothermal carbonization of biomass: a summary and discussion of chemical mechanisms for process engineering. Biofuels, Bioproducts and Biorefining. 4 (2), 160-177 (2010).
- Titirici, M. M., Thomas, A., Antonietti, M. Back in the black: Hydrothermal carbonization of plant material as an efficient chemical process to treat the CO2 problem? New Journal of Chemistry. 31 (6), 787-789 (2007).
- Gruda, N. Current and future perspective of growing media in Europe. Acta Horticulturae. 960, 37-43 (2012).
- Benavente, V., Calabuig, E., Fullana, A. Upgrading of moist agro-industrial wastes by hydrothermal carbonization. Journal of Analytical and Applied Pyrolysis. 113, 89-98 (2015).
- Volpe, M., et al. One stage olive mill waste streams valorisation via hydrothermal carbonisation. Waste Management. 80, 224-234 (2018).
- Sabio, E., Álvarez-Murillo, A., Román, S., Ledesma, B. Conversion of tomato-peel waste into solid fuel by hydrothermal carbonization: Influence of the processing variables. Waste Management. 47, 122-132 (2016).
- Lucian, M., et al. Impact of hydrothermal carbonization conditions on the formation of hydrochars and secondary chars from the organic fraction of municipal solid waste. Fuel. 233, 257-268 (2018).
- Mäkelä, M., Forsberg, J., Söderberg, C., Larsson, S. H., Dahl, O. Process water properties from hydrothermal carbonization of chemical sludge from a pulp and board mill. Bioresource Technology. 263, 654-659 (2018).
- Ulbrich, M., Preßl, D., Fendt, S., Gaderer, M., Spliethoff, H. Impact of HTC reaction conditions on the hydrochar properties and CO2 gasification properties of spent grains. Fuel Processing Technology. 167, 663-669 (2017).
- Hu, B., et al. Engineering carbon materials from the hydrothermal carbonization process of biomass. Advanced Materials. 22 (7), 813-828 (2010).
- Sevilla, M., Fuertes, A. B., Rezan, D. C., Titirici, M. M. Applications of Hydrothermal Carbon in Modern Nanotechnology. Sustainable Carbon Materials from Hydrothermal Processes. , 213-294 (2013).
- Sánchez, A., et al. Greenhouse gas emissions from organic waste composting. Environmental Chemistry Letters. 13 (3), 223-238 (2015).
- Andersen, J. K., Boldrin, A., Christensen, T. H., Scheutz, C. Greenhouse gas emissions from home composting of organic household waste. Waste Management. 30 (12), 2475-2482 (2010).
- Owsianiak, M., Brooks, J., Renz, M., Laurent, A. Evaluating climate change mitigation potential of hydrochars: compounding insights from three different indicators. GCB Bioenergy. 10, 230-245 (2018).
- Lorenz, K., Lal, R. Biochar application to soil for climate change mitigation by soil organic carbon sequestration. Journal of Plant Nutrition and Soil Science. 177 (5), 651-670 (2014).
- Solomon, D., et al. Indigenous African soil enrichment as a climate-smart sustainable agriculture alternative. Frontiers in Ecology and the Environment. 14 (2), 71-76 (2016).
- Glaser, B., Haumaier, L., Guggenberger, G., Zech, W. The “Terra Preta” phenomenon: a model for sustainable agriculture in the humid tropics. Naturwissenschaften. 88 (1), 37-41 (2001).
- Fornes, F., Belda, R. M. Acidification with nitric acid improves chemical characteristics and reduces phytotoxicity of alkaline chars. Journal of Environmental Management. 191, 237-243 (2017).
- Fornes, F., Belda, R. M., Fernández de Córdova, P., Cebolla-Cornejo, J. Assessment of biochar and hydrochar as minor to major constituents of growing media for containerized tomato production. Journal of the Science of Food and Agriculture. 97 (11), 3675-3684 (2017).
- Busch, D., Kammann, C., Grünhage, L., Müller, C. Simple biotoxicity tests for evaluation of carbonaceous soil additives: Establishment and reproducibility of four test procedures. Journal of Environmental Quality. 41 (4), 1023-1032 (2012).
- Dalias, P., Prasad, M., Mumme, J., Kern, J., Stylianou, M., Christou, A. Low-cost post-treatments improve the efficacy of hydrochar as peat replacement in growing media. Journal of Environmental Chemical Engineering. 6 (5), 6647(2018).
- Busch, D., Stark, A., Kammann, C. I., Glaser, B. Genotoxic and phytotoxic risk assessment of fresh and treated hydrochar from hydrothermal carbonization compared to biochar from pyrolysis. Ecotoxicology and Environmental Safety. 97, 59(2013).
- Hitzl, M., Mendez, A., Owsianiak, M., Renz, M. Making hydrochar suitable for agricultural soil: A thermal treatment to remove organic phytotoxic compounds. Journal of Environmental Chemical Engineering. 6 (6), 7029-7034 (2018).
- Hitzl, M., Corma, A., Pomares, F., Renz, M. The hydrothermal carbonization (HTC) plant as a decentral biorefinery for wet biomass. Catalysis Today. 257 (P2), 154-159 (2015).
- Burguete, P., et al. Fuel and chemicals from wet lignocellulosic biomass waste streams by hydrothermal carbonization. Green Chemistry. 18 (4), 1051-1060 (2016).
- Zucconi, F., Monaco, A., Forte, M., De Bertoldi, M. Phytotoxins during the stabilization of organic matter. Composting of Agricultural and Other Wastes. , (1985).
Reprints and Permissions
