This protocol is used to isolate single atrial cardiomyocytes from the adult mouse heart using a chunk digestion approach. This approach is used to isolate right or left atrial myocytes that can be used to characterize atrial myocyte electrophysiology in patch-clamp studies.
Method Article
Isolation of Atrial Myocytes from Adult Mice
In This Article
Summary
Abstract
The electrophysiological properties of atrial myocytes importantly affect overall cardiac function. Alterations in the underlying ionic currents responsible for the action potential can cause pro-arrhythmic substrates that underlie arrhythmias, such as atrial fibrillation, which are highly prevalent in many conditions and disease states. Isolating adult mouse atrial cardiomyocytes for use in patch-clamp experiments has greatly advanced our knowledge and understanding of the cellular electrophysiology in the healthy atrial myocardium and in the setting of atrial pathophysiology. In addition, studies using genetic mouse models have elucidated the role of a vast array of proteins in regulating atrial electrophysiology. Here we provide a detailed protocol for the isolation of cardiomyocytes from the atrial appendages of adult mice using a combination of enzymatic digestion and mechanical dissociation of these tissues. This approach consistently and reliably yields isolated atrial cardiomyocytes that can then be used to characterize cellular electrophysiology by measuring action potentials and ionic currents in patch-clamp experiments under a number of experimental conditions.
Introduction
The atria, which are the thin walled, low pressure chambers of the heart that receive blood from the superior and inferior vena cavae as well as the pulmonary veins, are integral in normal cardiac physiology. Like other regions of the heart, the atria contain a number of cell types, including cardiomyocytes, fibroblasts, endothelial cells, vascular smooth muscle cells, and others. Atrial myocytes are electrically excitable cells that play an essential role in the conduction of electrical signals through the heart, thereby ensuring proper atrial contraction during each heart beat1. Electrical dysfunction in the atria can lead to a number of atrial specific arrhythmias such as atrial flutter and atrial fibrillation2,3. These are highly prevalent, yet poorly understood, atrial arrhythmias that lead to significant morbidity and mortality. Atrial fibrillation can occur in association with genetic mutations, in association with aging or in the setting of acquired forms of heart disease, including hypertension, heart failure and diabetes2,4,5,6. These conditions can alter the electrical properties of atrial myocytes which can create a substrate that increases the prevalence of arrhythmogenesis1,2.
Normal electrical function in the atria, as well as atrial arrhythmogenesis, are importantly affected by the morphology of the action potential (AP) produced in atrial myocytes. The atrial AP is generated from the activity of a number of ionic currents, including the sodium current (INa, carried by NaV1.5 channels), the L-type calcium current (ICa,L, carried by Cav1.2 and CaV1.3 channels), and several potassium currents including the ultra-rapid delayed rectifier potassium current (IKur, carried by KV1.5 channels), the transient outward potassium current (Ito, carried by KV4.2 and KV4.3 channels), a steady state potassium current (IKss, carried by KV2.1 channels), and the inward rectifier potassium current (IK1, carried by Kir2.1 channels)1,7,8. Although they do not play a major role in the mouse atria, the rapid and slow components of the delayed rectifier K+ current (IKr and IKs) also contribute to AP repolarization in some species7. Alterations in one or more of these ionic currents can significantly alter the electrical properties of atrial myocytes, which can lead to atrial arrhythmias. For example, a reduction in INa can slow conduction velocity across the atria by reducing the AP upstroke velocity. On the other hand, a reduction in repolarizing potassium currents or an increase in either ICa,L or the late INa can result in the development of afterdepolarizations that can trigger spontaneous activity in the atria1,2,9.
It is important to recognize that there are differences in AP morphology in different parts of the atrial myocardium that are likely due to differences in the expression or regulation of these underlying ion channels. For example, differences in AP duration between the right and left atria in association with differences in Ito current density have been well described10,11,12,13. Also, we have recently demonstrated that there are distinct patterns of electrical remodeling in the right and left atria of mice with chronic hypertension6,14. The right atrial posterior wall also contains the sinoatrial node, which has its own distinct patterns of AP morphology and firing patterns15. The distinct properties of myocytes in each of these different parts of the atria can be investigated in detail using isolated myocytes from each of these regions.
There are different approaches that can be used to isolate atrial myocytes for patch-clamp electrophysiology studies16. One possibility is to use a retrograde perfusion approach where the heart is cannulated via the aorta for the delivery of enzymes. While this is a viable approach, it can produce variability in atrial myocyte quality due to inconsistencies in perfusion of the atria. We have adopted a ‘chunk’ digestion approach for the isolation of atrial myocytes that eliminates the need for retrograde perfusion of the heart. Our approach uses a combination of enzymatic digestion and mechanical dissociation of atrial tissue that consistently and reliably yields large numbers of isolated atrial myocytes that are suitable for patch-clamp studies. While we describe our approach here using atrial appendage tissue, the approach can be used on any region of the atrial myocardium (i.e., right or left atrial appendages, free walls, posterior walls) that the investigator chooses. This approach is ideal for studies of atrial myocyte electrophysiology in genetically modified mice, in mouse models of cardiovascular disease, or for studying the effects of pharmacological compounds5,6,17,18,19.
Protocol
All animal procedures were approved by The University of Calgary Animal Care and Use Committee and were conducted in accordance with the guidelines of the Canadian Council on Animal Care. The atrial myocyte isolation, images, and representative results described below were obtained from a 15 week-old male wildtype C57Bl/6 mouse. We routinely use this protocol to isolate atrial myocytes from wildtype mice17,18, mice carrying genetic mutations19,20 and mouse models of disease such as chronic hypertension6,14. The protocol can be used similarly for male or female mice. We also utilized a similar version of this isolation procedure to isolate sinoatrial node myocytes from the mouse heart17,21,22,23. A flowchart of this experimental protocol is located in Figure 1.
1. Preparation of Stock Solutions and Equipment
- Prepare 1 dissecting dish by adding silicone elastomer according to the manufacturer’s instructions. Add enough silicone elastomer compound to cover the bottom of a 10 cm Petri dish to a depth of 1 cm. Allow to cure and then insert 6 insect pins into the dish.
NOTE: This silicone dissecting dish can be reused for months and stored at room temperature. - Prepare 3 fire-polished Pasteur pipettes with an opening of 1 mm (small bore), 3 mm (medium bore), or 5 mm (large bore) in diameter as shown in Figure 2A. To make these pipettes, score a Pasteur pipette and then snap along the score mark to produce an opening that is slightly larger than the desired bore size. Use a metal file to smooth the surface and then fire-polish this opening using an open flame.
NOTE: This will produce a smooth, fire-polished edge with an opening of the desired diameter. It is important that the opening is free of cracks and rough surfaces. These fire-polished pipettes can be stored at room temperature and reused for months. - Prepare stock solutions for Tyrode’s pH 6.9 solution and Tyrode’s pH 7.4 solution as listed in Table 1. Also prepare 10 mL each of 1 M MgCl2, 1 M CaCl2, and 100 mM CaCl2. Use ultrapure water for all solutions and store at 4 °C for up to 2 months.
- Prepare 1 L of modified Kraft-Brühe (KB) solution as indicated in Table 2. Use ultrapure water. Divide the solution into 20 mL aliquots and store at -20 °C for up to 2 months.
2. Preparation of Solutions and Isolation Setup for Atrial Myocyte Isolation
- Prepare 50 mL of a modified Tyrode’s pH 7.4 solution as described in Table 3 in a 125 mL Erlenmeyer flask, using 1 M CaCl2 and 1 M MgCl2 stock solutions. Place the Erlenmeyer flask in a 35 °C water bath until use, as shown in Figure 2B.
- Prepare the modified Tyrode’s pH 6.9 solution as described in Table 4 in a 50 mL tube, using the 100 mM CaCl2 stock solution. Aliquot 2.5 mL of this solution into each of three 5 mL round bottom tubes. Place these tubes in a wire rack placed in a 35 °C water bath until use, as shown in Figure 2B.
- Prepare the enzyme solution as described in Table 5 in a 14 mL round bottom tube. To make the protease solution, add 1 mg of protease per 100 μL of ultrapure water. Place the tube containing this enzyme solution in the wire rack and incubate in a 35 °C water bath until use.
- Thaw one aliquot of modified KB solution in a 35 °C water bath. Aliquot 2.5 mL of KB solution into each of three 5 mL round bottom tubes and 2.5 mL into a 14 mL round bottom tube. Place these tubes in the wire rack and incubate in a 35 °C water bath until use, as shown in Figure 2B.
- Lay out the dissecting plate, dissecting tools, a Pasteur pipette, and the fire-polished pipettes as shown in Figure 2B.
3. Dissection of Mouse Atrial Appendage(s)
- Inject the mouse with 0.2 mL of heparin (10 000 USP U/10 mL) via intraperitoneal injection and wait 5 min for absorption.
- Place the mouse in an induction chamber and anesthetize by isoflurane inhalation (3-4%). Isoflurane and oxygen are delivered using an anesthetic machine and waste anesthetic gas is scavenged. Once the mouse is anesthetized, and does not exhibit a toe pinch reflex, euthanize the mouse by rapid cervical dislocation. Place the mouse on a paper towel or a cork board and tape the paws down to hold the mouse in place.
- Wet the chest of the mouse with 70% ethanol. Remove the fur and skin covering the chest using curved scissors. Next, use rat tooth forceps to lift the sternum and then cut the diaphragm along the edge of the ribs. Remove the entire rib cage using curved scissors to expose the heart.
- To remove the atrial appendage (right or left), gently lift the appendage using fine dissecting forceps and cut it out with spring scissors. Immediately transfer the atrial appendage to a silicone coated dissecting dish containing 20 mL of the warmed modified Tyrode’s pH 7.4 solution described in step 2.1.
- Place one dissecting pin at the top and one pin at the bottom of the opening of the atrial appendage. Using a pasture pipette, flush the atria with the warmed modified Tyrode’s pH 7.4 solution to remove blood. Open the atrial appendage by cutting along the top and bottom edge of the atrial appendage. Next, pin the corners of the atrial appendage down to create a flat, rectangular piece of tissue, as shown in Figure 3A.
4. Isolation of Atrial Myocytes
NOTE: Steps in this section are all performed at 35 °C, with tubes submerged in a 35 °C water bath. Be careful when transferring tissue strips between round bottom tubes to ensure that only the tissue (and not the solution) is transferred between tubes.
- Cut the atrial appendage into approximately 8-10 equal sized strips (approximately 0.7 mm in width) using spring scissors and fine forceps. An example of the strips of atrial tissue is shown in Figure 3B. Note that the strips contract once they are cut free from the main piece of tissue. Using the small bore fire-polished pipette, transfer the tissue strips into the first tube containing warmed modified Tyrode’s pH 6.9 solution described in step 2.2. Wait 5 min.
- Wash the tissue strips by transferring them to the second and then the third round bottom tube containing modified Tyrode’s pH 6.9 solution prepared in step 2.2 using the medium bore fire-polished pipette.
- To wash the tissue strips, cap the 5 mL round bottom tube and gently invert the tube 3 times. Let the tissue strips settle to the bottom of the tube before transferring the tissue strips to the next tube using the medium bore fire-polished pipette.
- Transfer the tissue strips into the enzyme solution described in step 2.3 using a medium bore fire-polished pipette and incubate for 30 min. Swirl the tube every 3-5 min to prevent the tissue strips from adhering together.
NOTE: At the beginning of the enzymatic digestion, tissue strips settle quickly following swirling. At approximately 20 min of digestion, the tissue strips begin to float in the enzymatic solution following swirling. During this time, the atrial tissue strips also change in appearance from pale pink to white as they are digested. - After enzymatic digestion, perform three washes using 2.5 mL of KB solution in the 5 mL round bottom tubes prepared in step 2.4. For each wash, gently invert the tube 3 times before moving the tissue to the next tube using the medium bore fire-polished pipette. Following the final wash, transfer the strips into the 14 mL round bottom tube containing 2.5 mL of KB solution. Wait 5 min.
- Gently triturate the tissue for 7.5 min using the wide bore fire-polished pipette. This will mechanically dissociate the tissue strips and yield a cloudy solution filled with individual atrial myocytes.
NOTE: During trituration, the tissue becomes white and the solution becomes cloudy. The force of trituration, achieved by altering both the frequency and velocity of expelling the tissue strips from the wide bore fire-polished pipette, should be tailored to the individual isolation. If trituration is too gentle, the cell yield will be low, while trituration that is too harsh will yield many dead cells. Avoid bubbles while triturating. - Fill the 14 mL round bottom tube containing the triturated tissue strips with KB solution to a final volume of 7-10 mL depending on the desired density of cells for experimental use. Place this tube at room temperature for 1 h. Following this incubation period, cells can be used for a variety of experiments for up to 7 h. Cells can also be stored at 4 °C for up to 7 h.
Results
The atrial myocytes isolated using this protocol can be used to characterize the electrophysiological properties of these cells using the patch-clamp technique. Aliquots of atrial myocytes in KB solution can be added to the recording chamber of a standard patch-clamp apparatus and superfused with solutions appropriate for the kind of recording the experimentalist wishes to perform. Atrial myocytes isolated using this protocol are best used for electrophysiological studies within 6-7 h of isolation. Representative patch-clamp data from our laboratory is presented below.
Figure 4 illustrates examples of isolated atrial myocytes from normal mice prepared using the protocol above. Isolated atrial myocytes are typically on the order of 100 µm in length and 10 µm in width with clear striations. The capacitance of isolated atrial myocytes is typically 40-70 pF.
Figure 5A illustrates an example of an atrial myocyte AP recorded using the perforated patch-clamp technique in current clamp mode, as we have described previously6,19,20. Summary data illustrating typical atrial myocyte AP parameters are provided in Table 6. Specifically, we present summary data for measurements of resting membrane potential (RMP), maximum upstroke velocity (Vmax), overshoot (OS) and AP duration at 50% (APD50), 70% (APD70) and 90% (APD90) repolarization time (Table 6). APs can also be recorded in the whole cell configuration14. The superfusion and pipette solutions for recording APs are available in Table 7 and Table 8.
Figure 5B illustrates a representative family of Na+ currents (INa) recorded in the whole cell configuration of the patch-clamp technique. These currents were recorded using 50 ms voltage clamp steps between -100 and +10 mV from a holding potential of -120 mV. We have described approaches and protocols for recording INa previously6,14,20. A summary INa IV relationship is also presented in Figure 5B. Solutions used to record INa are presented in Table 7 and Table 8.
Figure 5C illustrates a representative family of Ca2+ currents (ICa,L) recorded in the whole cell configuration of the patch-clamp technique. These currents were recorded using 250 ms voltage clamp steps between -60 and +80 mV from a holding potential of -70 mV. The experimental conditions that can be used to measure ICa,L have been previously described17,18,20. A summary ICa,L IV relationship is also presented in Figure 5C. The solutions used to record ICa,L are available in Table 7 and Table 8.
Figure 5D illustrates a representative family of K+ currents (IK) recorded in the whole cell configuration of the patch-clamp technique. These currents were recorded from a holding potential of -80 mV using 500 ms voltage clamp steps between -120 mV and +80 mV, as we have described previously6,14. The summary IV relationship for total IK is also presented in Figure 5D. The solutions used to record IK are available in Table 7 and Table 8.
Using these approaches to record APs and major families of ionic currents, including Na+, Ca2+ and K+ currents (as illustrated above), permits the investigator to rigorously interrogate atrial myocyte electrophysiology in a plethora of experimental conditions. Our laboratory has routinely employed these techniques to study atrial myocyte electrophysiology in normal mice, in mouse models of heart disease, and in genetically modified mice6,14,17,18,19,20.
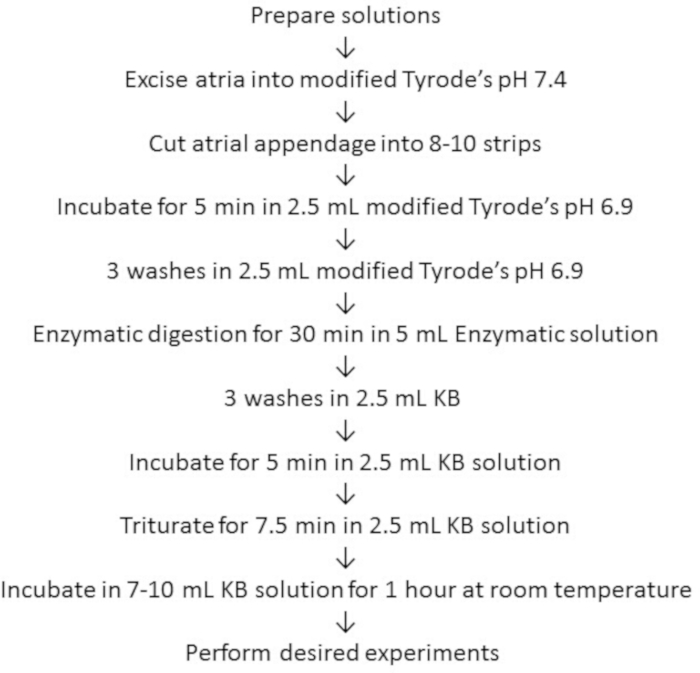
Figure 1: Flowchart for the atrial myocyte isolation protocol. Summary of the steps used to isolate atrial myocytes using this protocol. Please click here to view a larger version of this figure.

Figure 2: Experimental setup and dissection tools for atrial myocyte isolation. (A). A small bore fire-polished pipette with an opening 1 mm in diameter (left) is used for tissue transfer following dissection, a medium bore fire-polished pipette with an opening 3 mm in diameter (middle) is used to transfer tissue strips during the isolation, and a large bore fire-polished pipette with an opening 5 mm in diameter (right) is used for trituration of digested atrial tissue. (B). Experimental setup for atrial myocyte isolation. Please click here to view a larger version of this figure.
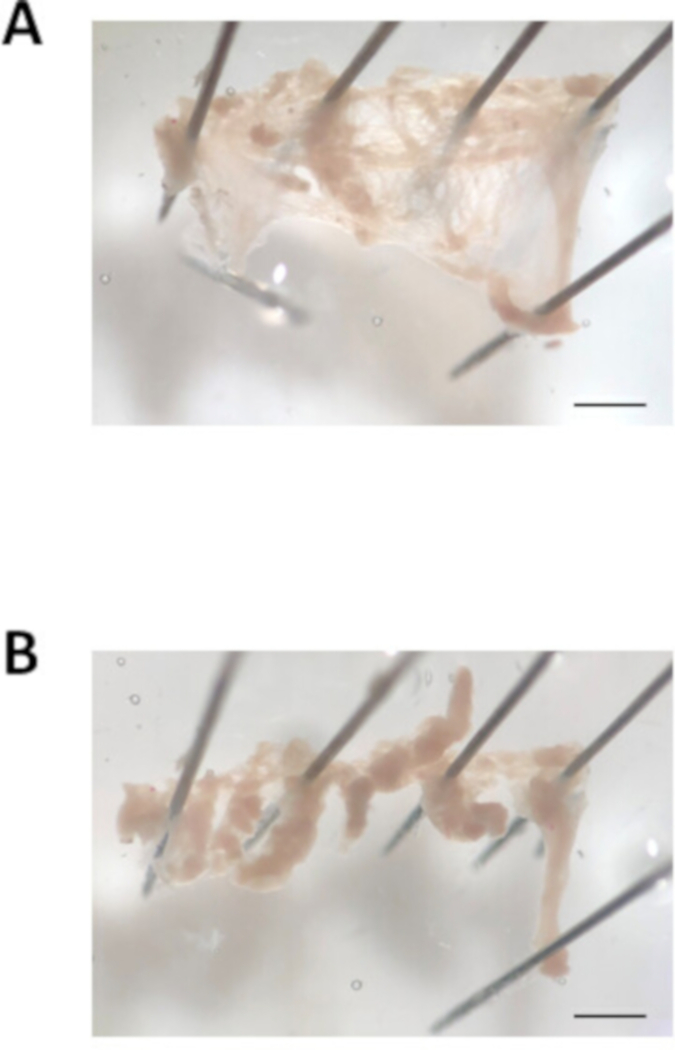
Figure 3: Image of the atrial appendage dissection. (A). Representative bright field image of an excised atrial appendage cut open and pinned out. (B). Representative bright field image of the atrial appendage cut into tissue strips of approximately 0.7 mm in width. Scale bar = 1 mm. Please click here to view a larger version of this figure.
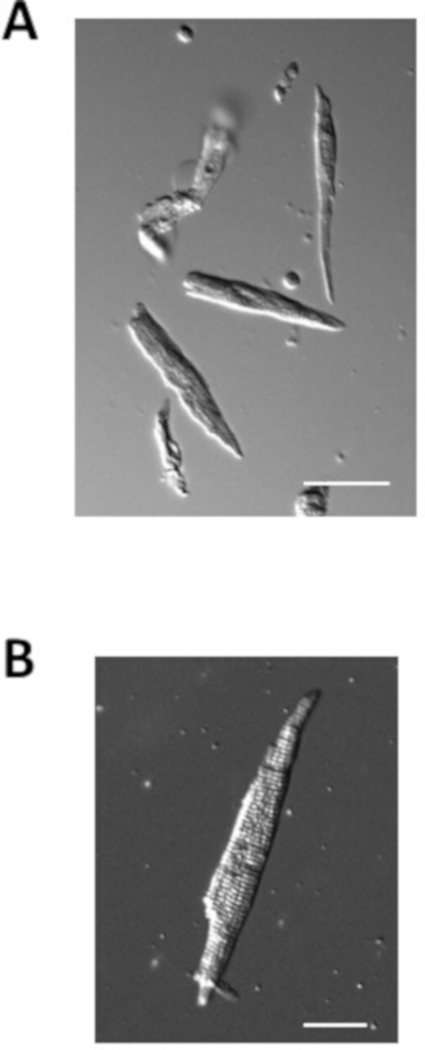
Figure 4: Images of isolated atrial myocytes. (A). Brightfield image of isolated atrial myocytes immediately after isolation. Scale bar = 50 μm. (B). Brightfield image of a single isolated atrial myocyte. Scale bar = 100 μm. Please click here to view a larger version of this figure.

Figure 5: Representative patch-clamp data obtained from isolated atrial myocytes. (A). Representative stimulated AP recording from an isolated atrial myocyte. Summary of AP parameters is presented in Table 6. Amphotericin B (200 μg/mL) was added to the pipette solution to permeabilize the cellular membrane. (B). Representative INa recordings (left) and summary INa IV curve (right) from an isolated atrial myocyte. Nifedipine (10 μM) was added to the modified Tyrode’s solution to block ICa,L when recording INa. C. Representative ICa,L recordings (left) and summary ICa,L IV curve (right) from an isolated atrial myocyte. (D). Representative IK recordings (left) and summary IK IV curve (right) from an isolated atrial myocyte. The solutions used to record each of these currents are listed in Table 7 and Table 8. Summary IV curves are averaged measurements from 10 atrial myocytes isolated from a 15 week-old male wildtype C57Bl/6 mouse. Please click here to view a larger version of this figure.
| Stock Tyrode's pH 6.9 | Stock Tyrode's pH 7.4 | |
| Chemical | in mM | in mM |
| NaCl | 140 | 140 |
| KCl | 5.4 | 5.4 |
| KH2PO4 | 1.2 | 1.2 |
| HEPES | 5 | 5 |
| Final volume | 500 mL | 1 L |
| Final pH with NaOH | 6.9 | 7.4 |
Table 1: Stock Tyrode’s pH 7.4 and stock Tyrode’s pH 6.9 solutions. Composition of stock Tyrode’s solutions (pH 7.4 and pH 6.9) that can be made in advance and stored at 4 °C for up to 2 months.
| Chemical | in mM |
| K-glutamate | 100 |
| K-aspartate | 10 |
| KCl | 25 |
| KH2PO4 | 10 |
| MgSO4 | 2 |
| Taurine | 20 |
| Creatine | 5 |
| EGTA | 0.5 |
| Glucose | 20 |
| HEPES | 5 |
| BSA | 0.10% |
| Final volume | 1 L |
| Final pH with KOH | 7.2 |
Table 2: Modified KB solution. Recipe for modified KB solution that can be made in advance, aliquoted, and stored at -20 °C for up to 2 months.
| Chemical | Amount |
| Glucose | 5.55 mM |
| MgCl2 | 1 mM |
| CaCl2 | 1.8 mM |
| Stock Tyrode's pH 7.4 | 50 mL |
| Heparin | 250 μL |
Table 3: Modified Tyrode’s pH 7.4 solution with glucose, magnesium, calcium, and heparin. Composition of modified Tyrode’s pH 7.4 solution used for the atrial tissue dissection. This solution should be made fresh and kept in a 35 °C water bath until use.
| Chemical | Amount |
| Glucose | 18.5 mM |
| Taurine | 49.96 mM |
| BSA | 15 mg |
| CaCl2 | 0.066 mM |
| Stock Tyrode's pH 6.9 | 15 mL |
Table 4: Modified Tyrode's pH 6.9 solution containing glucose, taurine, BSA, and low calcium. Composition of the modified Tyrode’s pH 6.9 solution used for the atrial myocyte isolation. This solution should be made fresh and kept in a 35 °C water bath until use.
| Chemical | Amount |
| Collagenase | 1,064 U |
| Elastase | 9 U |
| Protease solution | 65.2 μL |
| Modified Tyrode's pH 6.9 | 5 mL |
Table 5: Enzymatic solution. Composition of the enzymatic solution used to enzymatically digest atrial tissue strips. This solution should be made fresh and kept in a 35 °C water bath until use.
| Parameter | Average |
| RMP (mV) | -74.2 ± 0.7 |
| Vmax (V/s) | 144.6 ± 5.8 |
| OS (mV) | 71.9 ± 3.0 |
| APD50 (ms) | 11.1 ± 1.7 |
| APD70 (ms) | 23.0 ± 4.6 |
| APD90 (ms) | 54.7 ± 7.8 |
Table 6: Summary of AP parameters from isolated atrial myocytes. Data are presented as mean ± SEM, n = 10 atrial myocytes isolated from a 15 week male wildtype C57Bl/6 mouse.
| Potassium currents and APs | Sodium currents | Calcium currents | |
| Chemical | in mM | in mM | in mM |
| NaCl | 140 | 5 | |
| KCl | 5.4 | ||
| MgCl2 | 1 | 1 | 1 |
| CaCl2 | 1 | 1 | 2 |
| HEPES | 10 | 10 | 10 |
| Glucose | 5.5 | 5.5 | 5.5 |
| CsCl | 130 | ||
| TEA-Cl | 5.4 | 145.5 | |
| pH | 7.4 with NaOH | 7.4 with CsOH | 7.4 with CsOH |
Table 7: Composition of Tyrode’s solutions used during patch-clamp experiments. Composition of the Tyrode’s solutions used to record APs, INa, ICa,L, and IK from isolated atrial myocytes.
| Potassium currents and APs | Sodium currents | Calcium currents | |
| Chemical | in mM | in mM | in mM |
| NaCl | 5 | 5 | 5 |
| KCl | 140 | ||
| MgCl2 | 1 | 1 | 1 |
| CaCl2 | 0.2 | 0.2 | 0.2 |
| HEPES | 10 | 10 | 10 |
| EGTA | 5 | 5 | |
| Mg-ATP | 4 | 5 | 4 |
| Na-GTP | 0.3 | 0.3 | 0.3 |
| Na-phosphocreatine | 6.6 | 6.6 | |
| CsCl | 130 | 135 | |
| BAPTA | 5 | ||
| pH | 7.2 with KOH | 7.2 with CsOH | 7.2 with CsOH |
Table 8: Composition of internal pipette solution used during patch-clamp experiments. Composition of the pipette filling solutions used to record APs, INa, ICa,L, and IK from isolated atrial myocytes.
Discussion
Our lab routinely uses this protocol to isolate mouse atrial myocytes for use in patch-clamp experiments in order to investigate the effects of different forms of cardiovascular disease, genetic mutations, or pharmacological compounds on atrial myocyte electrophysiology. Although highly reproducible, the quality of the data obtained from the isolated atrial myocytes depends on the quality of the isolation. In addition, reintroduction of calcium following the atrial myocyte isolation will result in cell death for a population of isolated myocytes due to the calcium paradox16. Accordingly, isolating viable, high-quality atrial myocytes using this approach requires practice and optimization at multiple points throughout the isolation. Once optimized, it is estimated that between 70-90% of the total atrial myocytes isolated using this approach will be both calcium tolerant and rod shaped. The steps requiring the most practice and optimization are discussed below.
The speed and efficiency of the dissection will have downstream effects on the quality of the isolated cells. It is important to take time to ensure all blood is removed from the atrial tissue and that tissue strips are cut to a similar size. It should take approximately 5 min to remove the atrial appendage, cut the tissue into strips, and transfer the tissue strips into the first tube of modified Tyrode’s pH 6.9 solution. However, if this step takes too long, the quality of the tissue may be compromised.
It is also important that tissue strips are cut to a uniform size within an isolation and between hearts. If tissue strips are too large or too small, or if they are not uniform within an isolation, this can cause problems during both enzymatic digestion and trituration. This is because small strips will be more thoroughly digested and large strips will be under digested. It is equally important to consider the genotype and disease setting being studied as the size of the atrial appendage can vary between animals. For example, hypertrophic hearts have larger atrial appendages compared to healthy hearts, and therefore the experimenter can cut more strips in hypertrophic hearts compared to normal sized hearts. Accordingly, optimizing the size of the cut tissue strips and applying these dimensions to each individual atrial appendage will greatly improve the reproducibility of myocyte isolations between experimental conditions.
The delicate balance between the enzymatic digestion and mechanical dissociation is key to a successful atrial myocyte isolation using this protocol. If tissue is not adequately swirled during the enzymatic digestion the individual tissue strips will tend to clump and stick together, which will limit the effectiveness of the enzymatic digestion. If agitated too frequently or vigorously, this can damage the atrial tissue, which will result in the isolation of nonviable cells. Mechanical dissociation of isolated atrial myocytes from tissue strips during trituration is the most critical step to practice and optimize using this approach to isolate atrial myocytes. If trituration is too gentle, cell yield will be low. On the other hand, if trituration is too harsh, then an abundance of non-viable myocytes will be isolated, and the quality of data obtained during patch-clamp experiments will be jeopardized. In addition, the composition of the atria can affect the isolation. For example, if tissue is fibrotic, the enzymatic digestion and the trituration steps may need to be modified. It is therefore important to take the time to develop the skills required to obtain high quality cells during trituration that can be used for patch-clamp experiments.
As with all experimental techniques there are limitations. This technique requires practice in order to reproducibly isolate viable, high quality myocytes, which in turn will impact the feasibility of any experiments to be performed using these myocytes. This approach is also terminal and atrial myocytes isolated using this approach can be used on the day of the isolation only. Our lab uses the cells within 6-7 h of isolation.
This approach of isolating atrial cardiomyocytes has several applications. For example, this approach can be modified to isolate atrial myocytes (as well as cardiac fibroblasts) from other species including human atrial tissue biopsies. In addition, a benefit to using this chunk method for atrial myocyte isolation (in contrast to retrograde perfusion of the heart) is that it can be modified to isolate cardiomyocytes from other regions of the heart, such as the sinoatrial node or other specific regions of the atrial myocardium, or encompass the entire supraventricular region of the heart. Our lab uses atrial cardiomyocytes for patch-clamp experiments to measure action potentials and ionic currents, although this approach need not be limited to this technique. For example, isolated myocytes can be used to investigate alterations in calcium transients and contractility in a variety of experimental settings. Atrial cardiomyocytes can also be used in immunofluorescence studies to study the location of proteins or structures of interest. Accordingly, this approach is highly versatile with many possible applications.
Disclosures
The authors have to nothing to disclose.
Acknowledgements
This work is supported by operating grants from the Canadian Institutes of Health Research (MOP 93718, 142486) and the Heart and Stroke Foundation of Canada to R.A. Rose. H.J. Jansen is the recipient of a Killam Postdoctoral Fellowship.
Materials
| Name | Company | Catalog Number | Comments |
|---|---|---|---|
| 1, 2-Bis(2-Aminophenoxy)ethane-N, N, N', N'-tetraacetic acid 98% | Sigma | A4926-1G | |
| Adenosine 5'-triphosphate disodium salt hydrate BioXtra, > 99%, from microbial | Sigma | A7699-1G | |
| Adenosine 5'-triphosphate magnesium salt > 95%, bacterial | Sigma | A9187-1G | |
| Amphocetericin B from Streptomyces sp. ~80% (HPLC), powder | Sigma | A4888-500 MG | |
| Bovine serum albumin | Sigma | A3059-50G | |
| Calcium chloride dihydrate | Sigma | 223506-500G | |
| Cesium chloride ReagentPlus, 99.9% | Sigma | 289329-100G | |
| Cesium hydroxide monohydrate > 99.5% trace metals basis | Sigma | 562505-1KG | |
| Collagenase Type 2 | Worthington Biochemical Corporation | LS004176 | |
| Creatine anhydrous | Sigma | C0780 | |
| D-(+)-Glucose | Sigma | G7021-1KG | |
| DL-Aspartic acid potassium salt | Sigma | A2025-100G | |
| Elastase suspension | Worthington Biochemical Corporation | LS002279 | |
| Ethylene glycol-bis(2-amino-ethylether)-N,N,N',N'-tetraacetic acid >97.0% | Sigma | E4378-25G | |
| Guanosine 5'-triphosphate sodium salt hydrate > 95% (HPLC), powder | Sigma | G8877-250MG | |
| Heparin 10 000 USP U/10 mL | SANDOZ | 10750 | |
| HEPES > 99.5% (titration) | Sigma | H3375-500G | |
| L-Glutamic acid potassium salt monohydrate > 99% (HPLC), powder | Sigma | G1501-500G | |
| Magnesium sulfate | Sigma | M2643-500G | |
| Nifedipine > 98% (HPLC), powder | Sigma | N7634-1G | |
| Phosphocreatine disodium salt hydrate enzymatic, approx 98% | Sigma | P7936-5G | |
| Potassium chloride ACS reagent, 99.0-100.5% | Sigma | P3911-500G | |
| Potassium hydroxide | EM Science | PX1480-1 | |
| Potassium phosphate monobasic | EMD | PX1565-1 | |
| Protease from Streptomyces griseus, type XIV, >3.5 units/mg solid, powder | Sigma | P5147-1G | |
| Sodium chloride ACS reagent, > 99.0% | Sigma | S9888-2.5KG | |
| Sodium hydroxide, pellets, 97+%, A.C.S. reagent | Sigma | 221465-500G | |
| Sylgard 184 silicone elastomer kit | World Precision Instruments Inc | SYLG184 | |
| Taurine | Sigma | T0625-100G | |
| Tetraethylammonium chloride > 98% (titration) | Sigma | T2265-100G |
References
- Bartos, D. C., Grandi, E., Ripplinger, C. M. Ion Channels in the Heart. Comprehensive Physiology. 5 (3), 1423-1464 (2015).
- Heijman, J., Voigt, N., Nattel, S., Dobrev, D. Cellular and molecular electrophysiology of atrial fibrillation initiation, maintenance, and progression. Circulation Research. 114 (9), 1483-1499 (2014).
- Jalife, J. Mechanisms of persistent atrial fibrillation. Current Opinion in Cardiology. 29 (1), 20-27 (2014).
- Nattel, S., Maguy, A., Le Bouter, S., Yeh, Y. H. Arrhythmogenic ion-channel remodeling in the heart: heart failure, myocardial infarction, and atrial fibrillation. Physiological Reviews. 87 (2), 425-456 (2007).
- Jansen, H. J., et al. Atrial structure, function and arrhythmogenesis in aged and frail mice. Scientific Reports. 7, 44336(2017).
- Jansen, H. J., et al. Distinct patterns of atrial electrical and structural remodeling in angiotensin II mediated atrial fibrillation. Journal of Molecular and Cellular Cardiology. 124, 12-25 (2018).
- Nerbonne, J. M., Kass, R. S. Molecular physiology of cardiac repolarization. Physiological Reviews. 85 (4), 1205-1253 (2005).
- Grant, A. O. Cardiac ion channels. Circulalation: Arrhythmia and Electrophysiology. 2 (2), 185-194 (2009).
- Schmitt, N., Grunnet, M., Olesen, S. P. Cardiac potassium channel subtypes: new roles in repolarization and arrhythmia. Physiological Reviews. 94 (2), 609-653 (2014).
- Lomax, A. E., Kondo, C. S., Giles, W. R. Comparison of time- and voltage-dependent K+ currents in myocytes from left and right atria of adult mice. American Journal of Physiology Heart and Circulatory Physiology. 285 (5), H1837-H1848 (2003).
- Li, D., Zhang, L., Kneller, J., Nattel, S. Potential ionic mechanism for repolarization differences between canine right and left atrium. Circ Res. 88 (11), 1168-1175 (2001).
- Wirth, K. J., Knobloch, K. Differential effects of dofetilide, amiodarone, and class lc drugs on left and right atrial refractoriness and left atrial vulnerability in pigs. Naunyn Schmiedebergs Archives of Pharmacology. 363 (2), 166-174 (2001).
- Qi, A., Yeung-Lai-Wah, J. A., Xiao, J., Kerr, C. R. Regional differences in rabbit atrial repolarization: importance of transient outward current. American Journal of Physiology. 266 (2 Pt 2), H643-H649 (1994).
- Jansen, H. J., et al. NPR-C (Natriuretic Peptide Receptor-C) Modulates the Progression of Angiotensin II-Mediated Atrial Fibrillation and Atrial Remodeling in Mice. Circulation: Arrhythmia and Electrophysiology. 12 (1), e006863(2019).
- Mangoni, M. E., Nargeot, J. Genesis and regulation of the heart automaticity. Physiological Reviews. 88 (3), 919-982 (2008).
- Voigt, N., Pearman, C. M., Dobrev, D., Dibb, K. M. Methods for isolating atrial cells from large mammals and humans. Journal of Molecular and Cellular Cardiology. 86, 187-198 (2015).
- Springer, J., et al. The natriuretic peptides BNP and CNP increase heart rate and electrical conduction by stimulating ionic currents in the sinoatrial node and atrial myocardium following activation of guanylyl cyclase-linked natriuretic peptide receptors. Journal of Molecular and Cellular Cardiology. 52 (5), 1122-1134 (2012).
- Hua, R., Adamczyk, A., Robbins, C., Ray, G., Rose, R. A. Distinct patterns of constitutive phosphodiesterase activity in mouse sinoatrial node and atrial myocardium. PLoS One. 7 (10), e47652(2012).
- Egom, E. E., et al. Impaired sinoatrial node function and increased susceptibility to atrial fibrillation in mice lacking natriuretic peptide receptor C. Journal of Physiology. 593 (5), 1127-1146 (2015).
- Hua, R., et al. Effects of Wild-Type and Mutant Forms of Atrial Natriuretic Peptide on Atrial Electrophysiology and Arrhythmogenesis. Circulation: Arrhythmia and Electrophysiology. 8 (5), 1240-1254 (2015).
- Krishnaswamy, P. S., et al. Altered parasympathetic nervous system regulation of the sinoatrial node in Akita diabetic mice. Journal of Molecular and Cellular Cardiology. 82, 125-135 (2015).
- Mackasey, M., et al. Natriuretic peptide receptor C (NPR-C) protects against angiotensin II mediated sinoatrial disease in mice. JACC Basic to Translational Science. , (2018).
- Azer, J., Hua, R., Vella, K., Rose, R. A. Natriuretic peptides regulate heart rate and sinoatrial node function by activating multiple natriuretic peptide receptors. Journal of Molecular and Cellular Cardiology. 53 (5), 715-724 (2012).
Reprints and Permissions
