The freezing-thawing method is used to produce chitosan-poly(vinyl alcohol) hydrogels without crosslinking agents. For this method, it is important to consider the freezing conditions (temperature, number of cycles) and polymer ratio, which can affect the properties and applications of the obtained hydrogels.
Method Article
A Freeze-Thawing Method to Prepare Chitosan-Poly(vinyl alcohol) Hydrogels Without Crosslinking Agents and Diflunisal Release Studies
In This Article
Summary
Abstract
Chitosan-poly(vinyl alcohol) hydrogels can be produced by the freeze-thawing method without using toxic crosslinking agents. The applications of these systems are limited by their characteristics (e.g., porosity, flexibility, swelling capacity, drug loading and drug release capacity), which depend on the freezing conditions and the kind and ratio of polymers. This protocol describes how to prepare hydrogels from chitosan and poly(vinyl alcohol) at 50/50 w/w % of polymer composition and varying the freezing temperature (-4 °C, -20 °C, -80 °C) and freeze-thawing cycles (4, 5, 6 freezing cycles). FT-IR spectra, SEM micrograph and porosimetry data of hydrogels were obtained. Also, the swelling capacity and drug loading and release of diflunisal were assessed. Results from SEM micrographs and porosimetry show that the pore size decreases, while the porosity increases at lower temperatures. The swelling percentage was higher at the minor freezing temperature. The release of diflunisal from the hydrogels has been studied. All the networks maintain the drug release for 30 h and it has been observed that a simple diffusion mechanism regulates the diflunisal release according to Korsmeyer-Peppas and Higuchi models.
Introduction
Recently, hydrogels have attracted great interest in the biomedical field because they are three-dimensional networks with high water content and are soft and flexible, so they can mimic natural tissues easily1. Also, they do not dissolve in aqueous medium at physiological temperature and pH but present a large swelling2. Hydrogels can act as tissue engineering scaffolds, hygiene products, contact lenses, and wound dressings; because they can trap and release active compounds and drugs, they are used as drug delivery systems3. Depending on their application, hydrogels can be made from natural or synthetic polymers, or a combination of both, in order to obtain the best characteristics4.
The properties of hydrogels are a consequence of many physical and chemical factors. At the physical level, their structure and morphology depend on their porosity, pore size and pore distribution5. At the chemical and molecular level, the polymer type, the hydrophilic group content in the polymer chain, the crosslinking point type, and the cross-linking density are the factors that determine the swelling capacity and the mechanical properties6,7.
According to the type of crosslinking agent used to form the network, the hydrogels are classified as chemical hydrogels or physical hydrogels. Chemical hydrogels are joined by covalent interactions between their chains, which are formed through UV and gamma irradiation or using a crosslinking agent7,8. Chemical hydrogels usually are strong and resistant but, generally, the crosslinking agent is toxic to the cells and its removal is difficult, so its application is limited. On the other hand, physical hydrogels form by the connection of the polymer chains through non-covalent interactions, avoiding the use of crosslinking agents4,9. The main non-covalent interactions in the network are hydrophobic interactions, electrostatic forces, complementary and hydrogen bounds7.
Poly(vinyl alcohol) (PVA, Figure 1a) is a synthetic and water-soluble polymer with excellent mechanical performance and biocompatibility that can from crosslink agent-free hydrogels through the freeze-thawing method10,11. This polymer has the capacity to form concentrated zones of hydrogen bonds between -OH groups of their chains (crystalline zones) when they are freezing12. These crystalline zones act as crosslinking points in the network, and they are promoted by two events: the approaching of the polymer chains when the crystal water expands and the PVA conformational changes from isotactic to syndiotactic PVA during freeze13. Because of the freeze-drying, the water crystals are sublimated, leaving void spaces that are the pores in the hydrogel14. To obtain hydrogels with better properties, PVA can been easily combined with other polymers.
In that sense, chitosan constitutes an option as it is the only biopolymer from natural sources with positive charges. It is obtained by the deacetylation of chitin and it is composed of random combinations of β-1,4 linked D-glucosamine (deacetylated unit) and N-acetyl-D-glucosamine (acetylated unit)15,16 (Figure 1b). Chitosan is biodegradable by human enzymes and it is biocompatible. Also, by its cationic nature, it can interact with the negative charge of the cell surface, and this property has been associated with its antimicrobial activity17. This polymer is easy to process; however, their mechanical properties are not sufficient and some materials have been added to form complexes with better characteristics.
Considering specific characteristics of chitosan and PVA, the successful manufacture of hydrogels has been reached by the freeze-thawing method2,18 to avoid the use of toxic crosslinking agents. In chitosan-PVA hydrogels, the crystalline zones of PVA are also formed, and chitosan chains are interpenetrated and form simple hydrogen bonds with -NH2 groups and -OH groups in PVA. The final chitosan-PVA hydrogel is mechanically stable, with high rates of swelling and low toxicity, and with antibacterial effect18. However, depending on the freezing conditions used in the preparation (temperature, time and number of cycles), the final characteristics may change. Some studies report that increasing the number of freezing cycles decreases the swelling degree and increases the tensile strength19,20. In order to strengthen the network, other agents such as gamma and UV radiation and chemical crosslinkers have been used additionally after the freeze-thawed preparation21,22,23. Hydrogels with a higher chitosan proportion have a more porous network and high swelling capacity but less strength and thermal stability. In this context, it is important to consider the preparation conditions to obtain suitable hydrogels for their target application.
The purpose of this work is to present in detail how the freezing conditions (temperature of freezing and number of cycles) affect the final characteristics of CS-PVA hydrogels. FT-IR spectra, morphological and porosity characteristics and swelling capacity were evaluated, as well as drug loading and release capacity. In the release studies, diflunisal (Figure 1c) was used as model drug, due to its size suitable to the hydrogel structure.
Protocol
1. Preparation of chitosan-PVA hydrogels
- Prepare 2% (w/w) chitosan and 10% (w/w) PVA solutions. Dissolve 0.2 g of chitosan in 10 mL of 0.1 M CH3COOH solution (previously filtered) at room temperature and maintain continuous mechanical stirring overnight. Dissolve 1 g of PVA in 10 mL of distilled water and stir at 80 °C for 1 h.
- Mix both solutions 1:1 using a magnetic stirrer until they are homogeneous at room temperature, and pour the mixtures on Petri dishes. Leave the samples for 2 h at atmospheric pressure to degas.
- Freeze the hydrogels at -4 °C, -20 °C or -80 °C for 20 h and 4 cycles (samples CP4-4, CP4-20 and CP4-80, respectively). Freeze another hydrogel at -80 °C for 20 h using 5 or 6 freezing cycles (samples CP5-80 and CP6-80). After the third freezing cycle, wash the hydrogels with deionized water. At the end, freeze-dry the hydrogels at -46 °C for 48 h and store for further characterization (methodology adapted from2).
2. FT-IR characterization
- Place a little piece (1 mm x 2 mm) of hydrogel in the FT-IR spectrometer in ATR mode. Take the FT-IR spectra from 4000 to 600 cm-1 (2 cm-1 of resolution and average of 32 scans).
3. Swelling assays
- Cut out discs (13 mm in diameter and 10 mm in height) from the hydrogel and weigh them. Incubate the discs in 50 mL of deionized water with shaking at 25 °C. Repeat three times.
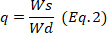
- Every 30 min remove the sample from the medium, blotter to eliminate the excess of water, and weigh. Calculate the swelling degree using the equation 1 and calculate the equilibrium state of swelling,
 , at 24 h using the equation 2.
 )
Where is the weight of the dry hydrogel and
 is the weight of the wet hydrogel.
4. Electronic Microscopy
- Cover a little piece of hydrogel with a thin gold layer (30 s and 10 mA) in a sputter coater.
- Put the sample in a scanning electron microscope (SEM). Analyze the samples under vacuum at 20 kV and take the images with a 500x and 1500x magnification.
5. Porosimetry
- Place discs 15 mm in diameter weighing around 0.26 g into the penetrometer (a solid penetrometer, having a bulk volume of 0.3660 mL and 5.7831 mL of stem volume). Analyze the porosity and pore size by Mercury Intrusion Porosimetry (MIP).
- Conduct the experiment in the hysteresis mode (intrusion-extrusion). Measure the total intrusion volume (mL/g), total pore area (m2/g), pore diameter (µm), porosity (%), permeability (mDarcy) and tortuosity. Repeat twice.
6. Drug loading and release
- Before loading, prepare 4 L of 15 mg/L diflunisal solution and stir overnight. Confirm the concentration of the solution by UV-Vis spectroscopy (initial concentration). Indeed, swell 400 mg of freeze-dried samples of hydrogel in 6 mL of distilled water for 24 h.
- For loading, fill a flask with 50 mL of diflunisal solution and maintain at 25 °C with constant stirring. Submerge each swelled hydrogel in the flask.
- Take aliquots of remaining diflunisal solution (2 mL) at different times in order to determine the plateau region of the curve, for example: 3, 6, 24, 27, 30 and 48 h. After 24 h replace the solution with a fresh one.
- Measure the absorbance at 252 nm of each aliquot, and determine the concentration of diflunisal present in the solution, using a calibration curve of diflunisal. Calculate the amount of diflunisal retained in the hydrogel at 24 and 48 h, as the difference of initial and final concentrations, taking into account the total volume (56 mL).
- Determine the encapsulation efficiency (EE) using the equation 3.

- Freeze the loaded hydrogels at -80 °C and lyophilize them at -50 °C.
- Determine the encapsulation efficiency (EE) using the equation 3.
- For drug release, submerge 300 mg of freeze-dried diflunisal loaded hydrogels in 50 mL of phosphate buffer (pH 7.4) at 25 °C. Maintain constant stirring. Withdraw aliquots of 2 mL at different times and replace with fresh medium to keep a constant volume.
- Determinate the diflunisal released spectrophotometrically at 252 nm, according to a calibration curve.
- Deduce the predominant drug release mechanism in the hydrogels adjusting the drug release data corresponding to the first 60%, to the Korsmeyer-Peppas model (Equation 4), to obtain the kinetic (k) and the diffusion (n) constants. The n values indicate the mechanism of drug release24,25. Then, n values close to 0.5 are related to Fickian diffusion, meanwhile values of 0.5-1.0 for anomalous transport, where are involved diffusion and relaxation chains, and finally, values of 1.0 are related to case II transport.

- To confirm the results, use the Higuchi, First order, and Zero order mathematical models (Equations 5 to 7) and select the better fit.



where t represents the release time, Mt the amount of drug delivered at a given time, and M∞ the total amount of drug delivered at the end of the process.
Results
Hydrogels preparation
Chitosan-PVA hydrogels were obtained at -4 °C, -20 °C and -80 °C with 4 freezing cycles and at -80 °C with 5 and 6 freezing cycles by the previously reported freeze-thawing method2. All hydrogels were homogeneous, semi-transparent, flexible and resistant against manipulation.
FT-IR characterization
The FT-IR spectra are shown in Figure 2. Seven characteristics signals of chitosan and PVA polymers were detected: at 3286 cm-1 the stretching vibration mode of PVA hydroxyl group (-OH) and at 2918 cm-1 the stretching vibration mode of -CH group26,27. The signals of amide groups, representative of chitosan structure, were found at 1652 cm-1 to the stretching vibration mode of C=O (amide I), at 1560 cm-1 to the flection vibration mode of N-H (amide II) and 1325 cm-1 to the vibration of amide III28,29,30. Other signals, at 1418 cm-1 to the flection vibration mode of C-H and at 1086 cm-1 to the stretching vibration mode of C-O groups, both of PVA, were detected27,31,32.
Electronic Microscopy
All CS-PVA hydrogels showed a highly porous surface (Figure 3, from left to right) and distinctive changes were observed according to the preparation conditions. Hydrogels prepared at -4 °C (CP4-4) presented larger pores than the hydrogels prepared at -80 °C (CP4-80). Moreover, the latter appears to have a more porous network. This effect may be due to the fact that, at lower temperature, the water crystal formation was faster and many small crystals emerged and were sublimated during the freeze-drying process, leaving void pores14,33. Meanwhile, the effect of the number of freezing cycles seems to promote more defined and circular pores in hydrogels CP6-80 (Figure 3, from top to bottom).
Porosimetry
Samples CP4-4, CP4-80 and CP6-80 presented more pronounced changes; in order to complement the information about morphology, they were analyzed by MIP (Table 1). The comparison between hydrogels CP4-4 and CP4-80 (Figure 3a) showed that, at a lower temperature of freezing, hydrogels developed a more porous network, which presented a large total intrusion volume and higher total pore area. However, hydrogels CP6-80 showed less permeability than CP4-80 (Figure 3b), probably due to their high tortuosity, which was also reflected in a lower total intrusion volume. Figure 3 presents the different pore sizes of these hydrogels. Two pore sizes were distinguished, one between 0.3-5.0 μm and other between 5.0-30 μm. In hydrogels CP4-80 and CP6-80, the porous network had a greater number of small pores than large ones, compared with CP4-4 hydrogel. These results were similar to those observed by SEM micrographs and suggested that, at lower temperature greater interactions between the PVA chains were favored and more crystalline zones were formed. In such a way, the formation of crystalline zones by PVA chains, was stimulated at low temperature.
Swelling assays
The swelling behavior of CS-PVA hydrogels can be seen in the Figure 4. They quickly absorbed large amounts of water; for the first 5 hours they retained 10x their weight, and after 20 hours they retain up to 15x their weight (equilibrium point). However, in relation to hydrogels prepared at the same number of freezing cycles, the hydrogel CP4-80 showed less swelling capacity in the first 5 hours as a consequence of the temperature that was used for its preparation (-80 °C). In the case of hydrogels prepared at different number of freezing cycles (CP4-80, CP5-80 and CP6-80) no differences were found at any time. Probably, the decreased swelling capacity observed in hydrogels prepared at -80 °C was caused by the small pore size of the hydrogel network.
Drug loading and release
To evaluate the capacity of CS-PVA hydrogels as drug delivery systems, the anti-inflammatory drug diflunisal was loaded in the network and subsequently released. The encapsulation efficiency (EE) in all these systems was around 70%; however, the CP4-80 hydrogel presented more slightly EE at 73% (Table 2). Meanwhile, the releasing kinetics of diflunisal from the CS-PVA hydrogels were maintained for about 30 h in all cases. The CP4-80 hydrogel released the highest amount of diflunisal (Figure 5). This may be due to the fact this hydrogel showed a more porous structure in comparison with the other two types of hydrogel. This feature allowed the small molecule of drug to easily enter in the hydrogel network and, then, to be released. Between CP4-80 and CP6-80 hydrogels not differences were observed during release times (Figure 6). No burst effect was observed in any of the CS-PVA hydrogels, which is promising for pharmaceutical applications. Mathematical models were used to determine the main release mechanism in CS-PVA hydrogels. The results were adjusted to different mathematical models (Table 3) and according to the n values, it was found that the Fick diffusion dominates the drug release process.
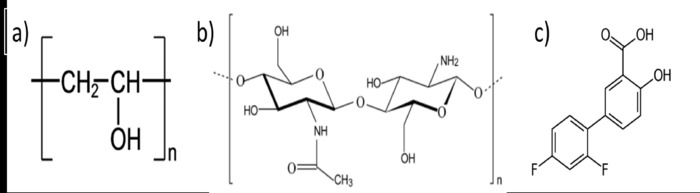
Figure 1: Chemical structure of PVA (a), chitosan (b) and diflunisal (c). Please click here to view a larger version of this figure.
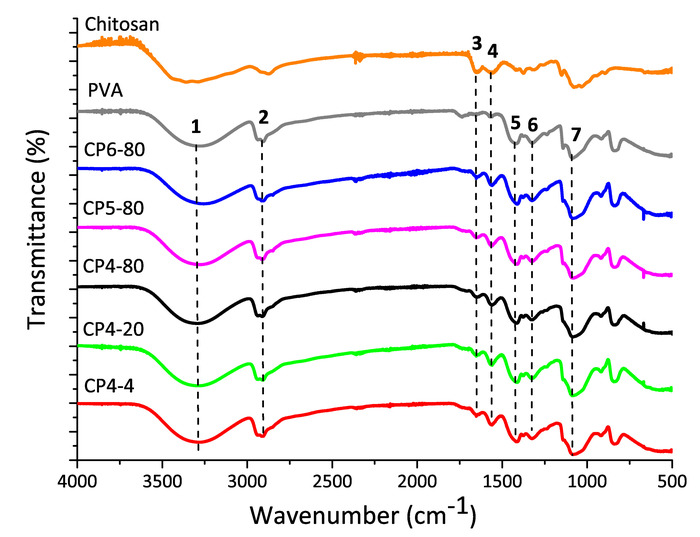
Figure 2: FT-IR spectra of pure chitosan and PVA and, chitosan-PVA hydrogels prepared at different conditions of freezing. Please click here to view a larger version of this figure.
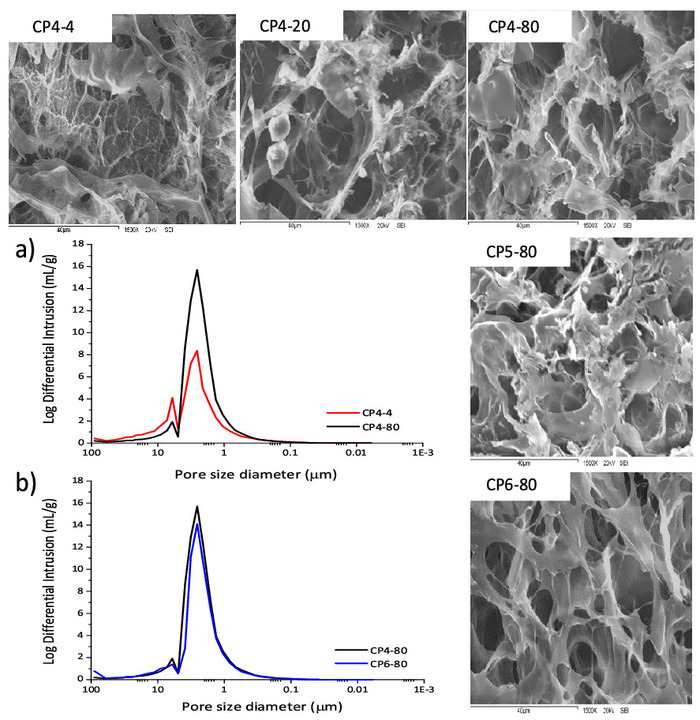
Figure 3: SEM micrographs of chitosan-PVA hydrogels at 1500x magnification. Pore size distributions of chitosan-PVA hydrogels: a) hydrogels prepared with 4 cycles of freezing and at -4 °C and -80 °C. b) Hydrogels prepared at -80 °C and, 4 and 6 cycles. Please click here to view a larger version of this figure.
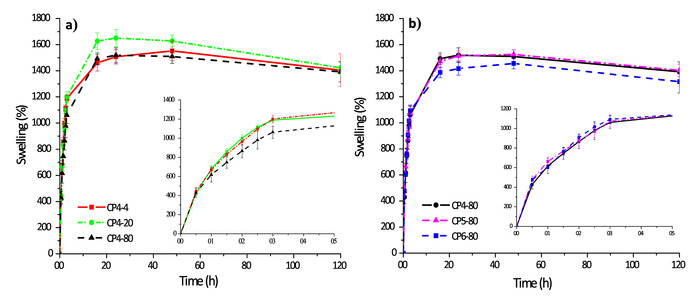
Figure 4: Swelling kinetics of chitosan-PVA hydrogels: a) hydrogels with 4 cycles of freezing and b) hydrogels prepared at -80 °C. Please click here to view a larger version of this figure.
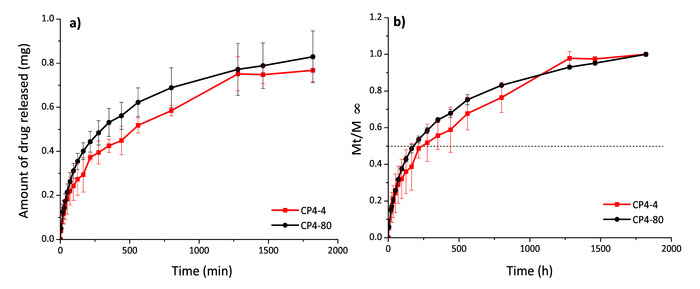
Figure 5: Diflunisal release profiles in mg (a) and Mt/ (b) for hydrogels CP4-4 and CP4-80. Please click here to view a larger version of this figure.
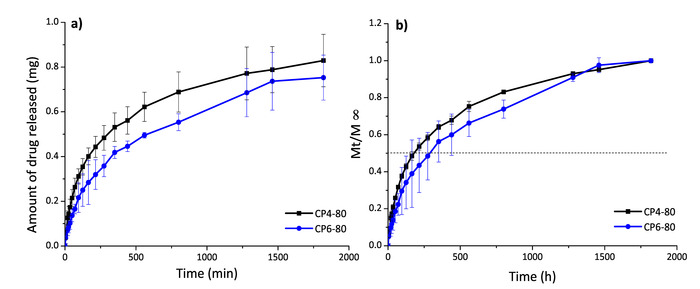
Figure 6: Diflunisal release profiles in mg (a) and Mt/ (b) for hydrogels CP4-80 and CP6-80. Please click here to view a larger version of this figure.
| Hydrogel | Total intrusion volume (mL/g) | Total pore area (m2/g) | Porosity (%) | Permeability (mdarcy) | Tortuosity |
| CP4-4 | 5.16 | 10.19 | 67.13 | 132.43 | 10.46 |
| CP4-80 | 7.36 | 15.14 | 85.95 | 151.16 | 5.83 |
| CP6-80 | 6.69 | 12.86 | 84.82 | 129.28 | 12.2 |
Table 1: Porosimetry parameters of the porous structure of chitosan-PVA hydrogels.
| Sample | Diflunisal loaded | Diflunisal released | |
| mg/g hydrogel | Encapsulation efficiency (%) | % released respect to loaded | |
| CP4-4 | 3.05± 0.09 | 71 | 79 ± 3.33 |
| CP4-80 | 3.22 ± 0.47 | 73 | 86 ± 0.4 |
| CP6-80 | 3.19 ± 0.05 | 68 | 80 ± 3.9 |
Table 2: Encapsulation and release efficiencies for chitosan-PVA hydrogels.
| Sample | Korsmeyer-Peppas | Higuchi | First Order | Zero Order | |||||
| kKP x 102 | n | R2 | kH x 102 | R2 | k1 x 102 | R2 | k0 x 102 | R2 | |
| (min-n) | (min-0.5) | (min-1) | (min-1) | ||||||
| CP4-4 | 4.3 ± 0.39 | 0.44 ± 0.02 | 0.99 | 3.1 ± 0.1 | 0.98 | 0.29 ± 0.03 | 0.803 | 0.18 ± 0.02 | 0.54 |
| CP4-80 | 3.6 ± 0.33 | 0.50 ± 0.02 | 0.99 | 3.7 ± 0.1 | 0.99 | 0.42 ± 0.03 | 0.894 | 0.27 ± 0.02 | 0.7 |
| CP6-80 | 2.3 ± 0.24 | 0.54 ± 0.02 | 0.99 | 2.9 ± 0.1 | 0.99 | 0.27 ± 0.02 | 0.925 | 0.17 ± 0.01 | 0.77 |
| k= kinetic constant; n= diffusion constant. | |||||||||
Table 3: Kinetic parameters of diflunisal release from chitosan-PVA hydrogels.
Discussion
The freeze-thawing method is a suitable process to prepare biocompatible hydrogels focused in biomedical, pharmaceutical or cosmetical applications34,35,36. The most important advantage of this method, compared with other well-known methods to prepare hydrogels, is that crosslinking agent use is avoided, which could cause an inflammatory response or adverse effects in the human body34. This is a versatile method because it offers the possibility to prepare hydrogels from PVA or their mixtures with different polymers11,37 in such way that new characteristics from the other polymers can be obtained in the new material (e.g., major capacity to absorb water, antimicrobial or antioxidant properties2,18,35). However, it is important to consider that the incorporation of other polymers could decrease the strength of the hydrogels19,37.
The principal parameters to consider in the freeze-thawing method are the temperature of freezing, the time and the number of freezing cycles, and also, the polymer ratio (in case of polymer mixtures)2,19,20. A wide range of swelling, morphological and mechanical properties can be obtained with this method when the freeze conditions are controlled. These parameters affect directly the three-dimensional network configuration in chitosan-PVA hydrogels because the freezing conditions promotes the arrangements in PVA chains, which are joined by physical interactions, called crystalline zones12,38. These crystalline zones are concentrated regions of hydrogen bonds that act as crosslinking points in the hydrogels, which maintain and form the three-dimensional network and it is a retractor force when hydrogels are in the swelling state2,39,40.
In this study, we evaluated the effect of a new range of freeze-thawing temperatures (-4 °C, -20 °C and -80 °C) combined with a different number of freezing cycles (4, 5 and 6) but the same time of freezing (20 h), to prepare 1:1 chitosan-PVA hydrogels. The lowest swelling capacity was observed at the lowest temperature (-80 °C). Indeed, hydrogels at this lowest temperature obtained the smaller pores and the more porous networks. These differences in chitosan-PVA hydrogels are useful for different applications such as drug delivery systems or scaffolds. In general, chitosan-PVA hydrogels present high rates of swelling, due to chitosan hydrophilic groups (-NH2)41,42, and they are soft, flexible, easy to handle and resist the manipulation because of PVA characteristics. In that sense, the freeze-thawing method is easy, cheap and fast to produce chitosan-PVA hydrogels with different properties, avoiding toxic crosslinking.
Although the freeze-thawing is an easy and friendly method, it has some drawbacks. A complete homogenization of chitosan, in this case, and of the polymer mixtures is very important. Hydrogels can present more fragile zones and an irregular porous structure. Also, it is necessary to make a correct dissolution of PVA in water by heating at 70-80 °C42,43 for 1 h under magnetic stirring. The cooling of this PVA solution must be slow with constant stirring to prevent the formation of a solid layer of PVA.
A limitation of this method, for cell culture assays, is the formation of whitish or semitransparent hydrogels. In this case, the application of glycerol or DMSO (toxic compound at room temperature) could be used to improve the appearance of hydrogel23,44. The freeze-drying step of the freeze-thawing method to prepare CS-PVA hydrogels is a critical step, because the hydrogels could present a constriction in the middle zone, which complicate the work and the characterization. To avoid this, the sample must be kept completely frozen before lyophilization. Concerning the drug loading and release studies, it is very important to ensure that there is no interference with the signals from the hydrogel components and the drug to be quantified.
Disclosures
The authors have nothing to disclose.
Acknowledgements
Authors are grateful to C. Luzuriaga for the support in the porosimetry measurements. Authors also thanks to Ministerio de Economía y Competitividad of Spain for financial support (Project MAT2014-59116-C2-2-R) and PIUNA (ref. 2018-15). The authors also would like to acknowledge Dr. Amir Maldonado from Departamento de Física-UNISON for support and helpful comments and Dr. SE Burruel-Ibarra from DIPM-UNISON for SEM images and Rubio Pharma y Asociados S. A. de C. V. for financial support. ME Martínez-Barbosa would like to thank CONACyT (México) projects No. 104931 and No. 256753, besides the financial support from Red Temática de Nanociencias y Nanotecnología del programa de Redes Temáticas del CONACyT. And, also project USO316001081. MD Figueroa-Pizano would like to acknowledge CONACyT for financial support (scholarship 373321).
Materials
| Name | Company | Catalog Number | Comments |
|---|---|---|---|
| Materials: | |||
| Chitosan medium molecular weight | Sigma-Aldrich | 448877 | Mw determined by capillary viscometry (637,000 Da) and deacetylation degree of 70% |
| Diflunisal (2'-4'-difluoro-4-hydroxy-3-biphenyl-carboxylicacid) | Merck | ||
| Glacial acetic acid | Sigma-Aldrich | 1005706 | |
| Poly(vinyl alcohol) | Sigma-Aldrich | 341584 | Mw 89,000-98,000, 99+% hydrolyzed |
| Equipment: | |||
| Cressington Sputter Coater 108 auto | TED PELLA INC | ||
| Cryodos Lyophilizator | Telstar | ||
| Falcon tubes | Thermo Fisher Company | ||
| FT-IR spectroscopy | Nicolet iS50 | in ATR mode | |
| Lyophilizator | LABCONCO | ||
| Micromeritics Autopore IV 9500 | Micromeritics | ||
| Scanning electron microscope | Pemtron SS-300LV | ||
| UV-visible spectrophotometer | Agilent 8453 |
References
- Gyles, D. A., Castro, L. D., Silva, J. O. C., Ribeiro-Costa, R. M. A review of the designs and prominent biomedical advances of natural and synthetic hydrogel formulations. European Polymer Journal. 88 (01), 373-392 (2017).
- Abdel-Mohsen, aM., Aly, aS., Hrdina, R., Montaser, aS., Hebeish, a Eco-Synthesis of PVA/Chitosan Hydrogels for Biomedical Application. Journal of Polymers and the Environment. 19, 1005-1012 (2011).
- Caló, E., Khutoryanskiy, V. V. Biomedical applications of hydrogels: A review of patents and commercial products. European Polymer Journal. 65, 252-267 (2015).
- Ahmadi, F., Oveisi, Z., Samani, M., Amoozgar, Z. Chitosan based hydrogels: Characteristics and pharmaceutical applications. Research in Pharmaceutical Sciences. 10 (1), 1-16 (2015).
- Siepmann, J., Siegel, R. A., Rathbone, M. J. Fundamentals and applications of controlled release drug delivery. Fundamentals and Applications of Controlled Release Drug Delivery. , (2012).
- Gulrez, S. K. H., Al-Assaf, S., Phillips, O. G. Hydrogels: Methods of Preparation, Characterisation and Applications. Progress in Molecular and Environmental Bioengineering - From Analysis and Modeling to Technology Applications. , 117-146 (2011).
- Ahmed, E. M. Hydrogel: Preparation, characterization, and applications. Journal of Advanced Research. 6 (2), 105-121 (2015).
- Deligkaris, K., Tadele, T. S., Olthuis, W., van den Berg, A. Hydrogel-based devices for biomedical applications. Sensors and Actuators, B: Chemical. 147 (2), 765-774 (2010).
- Patel, A., Mequanint, K. Hydrogel Biomaterials. Biomedical Engineering - Frontiers and Challenges. , 275-296 (2012).
- Kenawy, E., Kamoun, E. A., El-meligy, M. A., Mohy, M. S. Physically crosslinked poly ( vinyl alcohol ) - hydroxyethyl starch blend hydrogel membranes Synthesis and characterization for biomedical applications. Arabian Journal of Chemistry. 7 (3), 372-380 (2014).
- Kamoun, E. A., Kenawy, E. R. S., Chen, X. A review on polymeric hydrogel membranes for wound dressing applications: PVA-based hydrogel dressings. Journal of Advanced Research. 8 (3), 217-233 (2017).
- Hassan, C. M., Peppas, N. A. Structure and Morphology of Freeze / Thawed PVA Hydrogels. Macromolecules. 33, 2472-2479 (2000).
- Tsou, Y. H., Khoneisser, J., Huang, P. C., Xu, X. Hydrogel as a bioactive material to regulate stem cell fate. Bioactive Materials. 1 (1), 39-55 (2016).
- Kumar, A., Mishra, R., Reinwald, Y., Bhat, S. Cryogels: Freezing unveiled by thawing. Materials Today. 13 (11), 42-44 (2010).
- Wu, T., Li, Y., Lee, D. S. Chitosan-based composite hydrogels for biomedical applications. Macromolecular Research. 25 (6), 480-488 (2017).
- Dutta, P. K., Dutta, J., Tripathi, V. S. Chitin and chitosan: Chemistry, properties and applications. Journal of Scientific and Industrial Research. 63, 20-31 (2004).
- Szymańska, E., Winnicka, K. Stability of Chitosan—A Challenge for Pharmaceutical and Biomedical Applications. Marine Drugs. 13, 1819-1846 (2015).
- Yang, X., Liu, Q., Chen, X., Yu, F., Zhu, Z. Investigation of PVA/ws-chitosan hydrogels prepared by combined gamma-irradiation and freeze-thawing. Carbohydrate Polymers. 73 (3), 401-408 (2008).
- Mathews, D. T., Birbey, Y. A., Cahill, P. A., McGuinness, G. B. Mechanical and Morphological Characteristics of Poly(vinyl alcohol)/Chitosan Hydrogels. Journal of Applied Polymer Science. 109, 1129-1137 (2008).
- Hosseini, M. S., Amjadi, I., Haghighipour, N. Preparation of Poly(vinyl alcohol)/Chitosan-Blended Hydrogels: Properties, in Vitro Studies and Kinetic Evaluation. Journal of Biomimetics, Biomaterials, and Tissue Engineering. 15, 63-72 (2012).
- Afshari, M. J., Sheikh, N., Afarideh, H. PVA/CM-chitosan/honey hydrogels prepared by using the combined technique of irradiation followed by freeze-thawing. Radiation Physics and Chemistry. 113, 28-35 (2015).
- Agnihotri, S., Mukherji, S. S., Mukherji, S. S. Antimicrobial chitosan-PVA hydrogel as a nanoreactor and immobilizing matrix for silver nanoparticles. Applied Nanoscience. 2 (3), 179-188 (2012).
- Yang, X., et al. Cytotoxicity and wound healing properties of PVA/ws-chitosan/glycerol hydrogels made by irradiation followed by freeze-thawing. Radiation Physics and Chemistry. 79 (5), 606-611 (2010).
- Machín, R., Isasi, J. R., Vélaz, I. Hydrogel matrices containing single and mixed natural cyclodextrins. Mechanisms of drug release. European Polymer Journal. 49 (12), 3912-3920 (2013).
- Ritger, P. L., Peppas, N. A. A Simple Equation for Description of Solute Release. Journal of Controlled Release. 5, 37-42 (1987).
- Abureesh, M. A., Oladipo, A. A., Gazi, M. Facile synthesis of glucose-sensitive chitosan-poly(vinyl alcohol) hydrogel: Drug release optimization and swelling properties. International Journal of Biological Macromolecules. 90, 75-80 (2016).
- Mansur, H. S., Sadahira, C. M., Souza, A. N., Mansur, A. A. P. FTIR spectroscopy characterization of Poly(vinyl alcohol) hydrogel with different hydrolysis degree and chemically crosslinked with glutaraldehyde. Materials Science and Engineering C. 28 (4), 539-548 (2008).
- Parida, U. K., Nayak, A. K., Binhani, B. K., Nayak, P. L. Synthesis and Characterization of Chitosan-Polyvinyl Alcohol Blended with Cloisite 30B for Controlled Release of the Anticancer Drug Curcumin. Journal of Biomaterials and Nanobiotechnology. 02 (04), 414-425 (2011).
- Zu, Y., et al. Preparation and characterization of chitosan-polyvinyl alcohol blend hydrogels for the controlled release of nano-insulin. International Journal of Biological Macromolecules. 50 (1), 82-87 (2012).
- Lejardi, A., Hernández, R., Criado, M., Santos, J. I., Etxeberria, A., Sarasua, J. R. Novel hydrogels of chitosan and poly ( vinyl alcohol ) -g-glycolic acid copolymer with enhanced rheological properties. Carbohydrate Polymers. , 267-273 (2014).
- dos Reis, E. F., et al. Synthesis and characterization of Poly(vinyl alcohol) hydrogels and hybrids for rMPB70 protein adsorption. Materials Research. 9 (2), 185-191 (2006).
- Thanyacharoen, T., Chuysinuan, P., Techasakul, S., Nooeaid, P., Ummartyotin, S. Development of a gallic acid-loaded chitosan and polyvinyl alcohol hydrogel composite: Release characteristics and antioxidant activity. International Journal of Biological Macromolecules. 107, 363-370 (2018).
- Lozinsky, V. I., et al. Polymeric cryogels as promising materials of biotechnological interest. Trends in Biotechnology. 21 (10), 445-451 (2003).
- Liu, Y., Vrana, N. E., Cahill, P. A., McGuinness, G. B. Physically crosslinked composite hydrogels of PVA with natural macromolecules: Structure, mechanical properties, and endothelial cell compatibility. Journal of Biomedical Materials Research - Part B Applied Biomaterials. 90 (2), 492-502 (2009).
- Yang, W., et al. Polyvinyl alcohol/chitosan hydrogels with enhanced antioxidant and antibacterial properties induced by lignin nanoparticles. Carbohydrate Polymers. 181 (August 2017), 275-284 (2018).
- Park, H., Kim, D. Swelling and mechanical properties of glycol chitosan/poly(vinyl alcohol) IPN-type superporous hydrogels. Journal of Biomedical Materials Research Part A. 78 (4), 662-667 (2006).
- Zhang, H., Zhang, F., Wu, J. Physically crosslinked hydrogels from polysaccharides prepared by freeze-thaw technique. Reactive and Functional Polymers. 73 (7), 923-928 (2013).
- Hassan, C. M., Peppas, N. A. Structure and Applications of Poly ( vinyl alcohol ) Hydrogels Produced by Conventional Crosslinking or by Freezing / Thawing Methods. Advances in Polymer Science. 153, 37-65 (2000).
- Sung, J. H., et al. Gel characterisation and in vivo evaluation of minocycline-loaded wound dressing with enhanced wound healing using polyvinyl alcohol and chitosan. International Journal of Pharmaceutics. 392 (1-2), 232-240 (2010).
- Lin, C. C., Metters, A. T. Hydrogels in controlled release formulations: Network design and mathematical modeling. Advanced Drug Delivery Reviews. 58 (12-13), 1379-1408 (2006).
- Fan, L., Yang, H., Yang, J., Peng, M., Hu, J. Preparation and characterization of chitosan/gelatin/PVA hydrogel for wound dressings. Carbohydrate Polymers. 146, 427-434 (2016).
- Islam, A., et al. Evaluation of selected properties of biocompatible chitosan / poly ( vinyl alcohol) blends. International Journal of Biological Macromolecules. 82, 551-556 (2016).
- Physical Montaser, A. S. mechanical and antimicrobial evaluations of physically crosslinked PVA/chitosan hydrogels containing nanoparticles. Journal of Applied Pharmaceutical Science. 6 (5), 1-6 (2016).
- Hou, Y., Chen, C., Liu, K., Tu, Y., Zhang, L., Li, Y. Preparation of PVA hydrogel with high-transparence and investigations of its transparent mechanism. RSC Advances. 5 (31), 24023-24030 (2015).
Reprints and Permissions
