Presented here is a protocol for performing single-molecule Förster resonance energy transfer to study HJ resolution. Two-color alternating excitation is used for determining the dissociation constants. Single-color time lapse smFRET is then applied in real-time cleavage assays to obtain the dwell time distribution prior to HJ resolution.
Method Article
Single-Molecule Förster Resonance Energy Transfer Methods for Real-Time Investigation of the Holliday Junction Resolution by GEN1
* These authors contributed equally
Opens in a new tab
In This Article
Summary
Loading...
$$\rightleftharpoonup{xx}$$
$$\longleftharp{xx}$$,
$$\longrightharp{xx}$$,
Abstract
Loading...
$$\rightleftharpoonup{xx}$$
$$\longleftharp{xx}$$,
$$\longrightharp{xx}$$,
Bulk methods measure the ensemble behavior of molecules, in which individual reaction rates of the underlying steps are averaged throughout the population. Single-molecule Förster resonance energy transfer (smFRET) provides a recording of the conformational changes taking place by individual molecules in real-time. Therefore, smFRET is powerful in measuring structural changes in the enzyme or substrate during binding and catalysis. This work presents a protocol for single-molecule imaging of the interaction of a four-way Holliday junction (HJ) and gap endonuclease I (GEN1), a cytosolic homologous recombination enzyme. Also presented are single-color and two-color alternating excitation (ALEX) smFRET experimental protocols to follow the resolution of the HJ by GEN1 in real-time. The kinetics of GEN1 dimerization are determined at the HJ, which has been suggested to play a key role in the resolution of the HJ and has remained elusive until now. The techniques described here can be widely applied to obtain valuable mechanistic insights of many enzyme-DNA systems.
Introduction
Loading...
$$\rightleftharpoonup{xx}$$
$$\longleftharp{xx}$$,
$$\longrightharp{xx}$$,
Single-molecule methods based on fluorescence detection provide high signal-to-noise ratios1. FRET is a spectroscopic technique that can measure distances in the range of 1–10 nm, rendering this technique as a molecular ruler for measuring distances in the nanometer range2,3. The absorption spectrum of the acceptor has a partial spectral overlap with the donor’s emission spectrum at the shorter wavelength end. FRET is mediated by the radiation-less energy transfer between a donor and acceptor pair, whereas the efficiency of energy transfer is dependent on the distance and orientation of the acceptor4.
Several approaches have been implemented to minimize the background and improve the detection efficiency of the fluorescence signal5,6. One approach is confocal microscopy, in which a pinhole restricts the excitation spot to a size below the diffraction limit7. Another approach is total internal reflection fluorescence (TIRF), which is a wide-field illumination technique in which the light is directed off-axis above a critical angle8. The light is then totally internally reflected at the interface between the glass and aqueous solution, generating an evanescent wave that only illuminates the fluorophores attached to the glass surface and prevents background from the fluorophores in the rest of the solution.
In confocal microscopy, the molecules can be either freely diffusing or surface immobilized. The attained temporal resolution can be within microseconds to several milliseconds9. The confocal detection for a single molecule is performed by single-photon avalanche diode (SPAD) and point-by-point scanning of the region of interest10. In TIRF, a time-series of a few hundreds of molecules immobilized on the surface is recorded by a position-sensitive two-dimensional charge coupled detector (CCD). The CCD amplifies the fluorescence signal either by intensified phosphor screen and microchannel plate or on-chip multiplication of photoelectrons (EMCCD). The temporal resolution is dependent on the readout speed and quantum efficiency of the CCD and usually on the order of few tens of milliseconds6.
HJ is a central intermediate in DNA repair and recombination11,12,13,14. HJ has two continuous and two crossing strands that connect between the continuous strands without intersecting each other. HJ exists in solution as X-stacked conformers, which undergo continuous isomerization by the continuous strands becoming crossing and the crossing strands becoming continuous in the other conformer15. Isomer preference of the HJ is dependent on the core sequence and ionic environment and has been extensively studied by FRET16,17,18,19.
GEN120 is a monomeric protein in solution21 and requires dimerization to cleave the HJ, thus allowing proper separation of the recombined strands22,23. The stacking conformer preference of the HJ influences the outcome of genetic recombination by setting the orientation of the resolution by the HJ resolvases24. Understanding how GEN1 binds the HJ, coordinates the two incisions, and ensures its full resolution have all been under intensive study21,22,23,25,26,27,28,29,30.
In this study, an objective based TIRF set-up is used as described previously31. Two-color alternating excitation (ALEX) is applied to determine the conformational changes upon the interaction of GEN1 with fluorophore labeled HJ. ALEX produces 2D histograms based on two ratiometric parameters FRET efficiency E, which is donor-acceptor distance-dependent, and the stoichiometry parameter S, which measures the donor-acceptor stoichiometry32. ALEX enables the sorting of fluorescent species based on the stoichiometries of the fluorophores including donor-only, acceptor-only, and mixed subpopulations. ALEX can extend the use of FRET to the full range and can detect differences in fluorophore brightness and oligomerization as well as monitor macromolecule-ligand interactions33.
It is found that GEN1 consistently succeeds in resolving the HJ within the lifetime of the GEN1-HJ complex. The time-dependent conformational changes are derived from the time-traces of individual molecules, while the histograms represent the distribution of the underlying populations. Using time-lapse single-color FRET, fast on-rates and slow off-rates for the GEN1 dimer are demonstrated, which increase the affinity of the assembled GEN1 dimer at the first incision product.
Protocol
Loading...
$$\rightleftharpoonup{xx}$$
$$\longleftharp{xx}$$,
$$\longrightharp{xx}$$,
1. Preparation of surface-functionalized coverslips
- Cleaning
- Place five coverslips (24 mm x 60 mm) in ethanol inside a Coplin jar. Sonicate in ethanol then in 1 M potassium hydroxide for 30 min for 3x. Wash in acetone 3x then decant.
- Silanization
- Prepare a solution of 2.8% 3-aminopropyltriethoxysilane (APTES) in acetone. Seal the APTES bottle with a paraffin film and store at 4 °C.
NOTE: Use safety goggles and work under a fume hood. The container of the silane solution should be completely dry and rinsed by acetone immediately before and after pouring the silane solution into the jar. - Pour 70 mL of the 2.8% APTES solution into the Coplin jar containing the coverslips. Shake the jar for 4 min in an orbital shaker.
- Let the jar stand on the bench for 5 min, sonicate for 1 min, and finally keep the jar on the bench for another 10 min for the silane to react with the hydroxyl groups on the glass surface.
- Quench the reaction by the addition of 1 L of deionized water by pouring water directly into the jar for rapid solvent exchange. Rinse the slides 3x in water by sideways shaking of the jar on a flat surface.
- Take the coverslips out of the jar and place them onto an aluminum foil tray. Bake the coverslips in an oven at 110 °C for 30 min to dry the coverslips and cure the silane. Leave the tray on the bench for the coverslips to cool down to room temperature.
- Prepare a solution of 2.8% 3-aminopropyltriethoxysilane (APTES) in acetone. Seal the APTES bottle with a paraffin film and store at 4 °C.
- PEGylation
- Warm up the biotinylated PEG and PEG, stored at -20 °C to room temperature (RT) to prevent the condensation of moisture upon opening the container.
- Place five coverslips with the silanized surface facing up on a box. Place two cover glass slips (22 mm x 22 mm) as spacers along the edges of the silanized coverslips.
- Once warmed up, make biotinylated PEG and PEG solutions at a ratio of ~1:100 in 1 mL of fresh, 0.1 M sodium bicarbonate solution by adding 1.5 mg of biotinylated PEG and 150 mg of PEG into a 1.5 mL tube.
- Vortex the tube to dissolve PEG and spin down to remove air bubbles.
NOTE: Going forward from this step, be quick, because PEG hydrolyzes in solution within a timescale of min. - Quickly apply 100 µL of the PEG solution to each coverslip. Take another baked coverslip and place its upper silanized surface face-down on top of the coverslip with the PEG solution, hence forming a glass-solution-glass sandwich in which the 22 mm x 22 mm non-silanized coverslips allow the two functionalized coverslips to be separated easily.
- Incubate the coverslips overnight (16 h) in the dark and at RT. Once the incubation is complete, take the coverslips apart, then rinse 10x using deionized water by washing from the side with a squirt bottle.
- Dry the coverslips under a flow of dry nitrogen. Store the dry coverslips under vacuum.
NOTE: The slides can be used for 1 month without degradation of quality.
2. Preparation of flow cell
- Single-channel flow cell
- Drill two holes with 1.22 mm diameter in the middle part of a quartz slide (50 mm x 20 mm) with the centers situated 37 mm apart and 6.5 mm from the edge of the slide (Figure 1A).
- Cut out a 41 mm x 2.25 mm channel into a 50 mm x 20 mm piece of a double-adhesive sheet using an electronic cutter.
- Peel off the plastic side of the protective cover and align the edges of the piece with the edges of the quartz slide. Remove trapped air bubbles by pressing gently with a pair of polytetrafluoroethylene tweezers.
- Peel off the paper side of the adhesive piece. Mount the piece onto the functionalized surface of the coverslip.
- Cut polyethylene tubing (I.D. 1.22 mm) into a length of 11 cm for the inlet and 25 cm for the outlet. Insert the tube into the previously drilled holes as inlet and outlet for the flow cell.
- Use 5 min epoxy glue to seal around the edges of the quartz-coverslip interface and around the tubes for the inlet and outlet.
- Use the flow cell immediately once it dries or store under dry vacuum for later use.
- Dissolve avidin in PBS to a concentration of 0.03 mg/mL. Filter through 0.2 µm syringe filter.
- Flow avidin into the flow cell using a 1 mL syringe. Use another syringe filled with buffer to wash out excess avidin. Be careful not to introduce air bubbles while exchanging the syringes.
- Multiple-channel flow cell
- Drill six holes with a diameter of 1.22 mm on each of the long sides of a quartz slide (76 mm x 25 mm) (Figure 1B). Make the holes 4.5 mm from the edge of the slide and 9.3 mm apart. Ensure the distance between the centers of each hole pair is 15 mm.
- Cut out six channels (20 mm x 2.25 mm) into a 76 mm x 25 mm piece of double-adhesive tape using the electronic cutter.
- Peel off the plastic side of the protective cover and align the edges of the adhesive piece with the edges of the quartz slide. Remove any trapped air bubbles by gentle pressing using a pair of polytetrafluoroethylene tweezers.
- Peel off the paper side of the adhesive piece and mount onto the functionalized surface of the coverslip.
NOTE: Sometimes peeling off the paper side and attaching to the quartz slide works well in the multichannel flow cell. - Cut the inlet tubes (11 cm) and outlet tubes (25 cm) for the six channels. Prepare the flow cell as described in steps 2.1.6–2.1.9.
- Connect the outlet of the first channel to the pump. Place the inlet into 0.5 mL tube with OSS.
NOTE: The length of the inlet tube is chosen to maximize the number of events in the cleavage experiments performed under continuous flow by synchronizing time of enzyme entrance into the flow cell and start of imaging thus decreasing premature photobleaching of the fluorophores. - Move to a new channel by disconnecting the outlet of the used channel. Close the outlet with a plug made from a syringe needle sealed with glue in the plastic part. Close the inlet of the used channel.
3. Preparation of oxygen scavenging system (OSS)
- Dissolve 0.2 g of (±)-6-hydroxy-2,5,7,8-tetramethylchromane-2-carboxylic acid (triplet state quencher which minimizes blinking of the fluorophores) in 800 µL of methanol.
- Add 6 mL of deionized H2O and add 1 N NaOH dropwise until it dissolves. Filter through a syringe filter, make into 1 mL aliquots, and store at -80 °C. The stock concentration is ~100 µM.
- Prepare a fresh solution of 3,4-dihroxybenzoic acid (PCA) by dissolving 61 mg of PCA powder in 4 mL of ddH2O. The stock concentration is ~100 nM.
- Add 58 µL of 10 N NaOH dropwise, making sure to vortex after each drop until PCA is fully dissolved (pH = 9).
- Dissolve 5.3 mg of protocatechuate 3,4-dioxygenase (3,4-PCD) in 7 mL of PCD storage buffer (Table 1). 3,4-PCD removes oxygen from the binding/cleavage buffers by catalyzing the oxidation of protocatechuic acid34.
- Divide the PCD solution into 1 mL aliquots. The stock concentration is ~1 µM. Snap-freeze the aliquots in liquid nitrogen and store at -80 °C for long-term storage or at -20 °C for short-term storage.
- Prepare a fresh binding buffer (Table 1). Substitute 2 mM CaCl2 with 2 mM MgCl2 for smFRET cleavage experiments.
- Prepare 1 mL of the imaging buffer (Table 1). Keep the imaging buffer on ice until it is introduced into the flow cell to maintain the activity of the oxygen scavenging system.
4. Preparation of fluorescently labeled HJs
- Reconstitute the lyophilized oligos (Table 2) in Tris-EDTA buffer (Table 1) to a concentration of 100 µM.
- Prepare the synthetic junction by mixing equimolar portions ~3 µL of each of the X0 oligos listed in Table 1.
- Anneal by heating at 95 °C for 5 min followed by slow cooling to RT at a rate of 1 °C/min. Use either a heat block or PCR thermocycler to achieve the desired cooling rate.
- Load the mixture on 8 cm x 8 cm of 10% Tris-borate-EDTA polyacrylamide gel. Apply 100 V and run the gel for ~2 h. The bands are clearly seen by eye, and their color is purple.
- Excise the band of the annealed substrate with a clean blade. Transfer the gel piece into an autoclaved 1.5 mL tube.
- Crush the gel piece inside the tube with a clean plunger then add 100 µL of TE100 buffer (Table 1).
- Extract the HJ by shaking the tube at 20 °C at 1,500 rpm in a thermomixer for ~2 h or incubate overnight at 4 °C.
- Perform ethanol precipitation on the solution containing the substrate35.
- Resuspend the substrate in 20 µL of TE100 buffer (Table 1). The final concentration is 1–3 µM. Aliquot 2 µL in each tube and store at -20 °C.
5. Protein expression and purification of GEN1
- Construct the plasmid for the expression of truncated human GEN11,2,3,4,5 with hexa histidine-tag at the C-terminus20 by PCR of the entry vector.
NOTE: N-terminal tagging would result in the inactivation of GEN1. The unstructured C-tail renders the purification of the full length GEN1 significantly harder. Also, the full length GEN1 was reported to exhibit less activity than truncated version23. - Transform the expression vector into E. coli BL21-CodonPlus (DE3)-RIPL strain.
- Inoculate the transformed cells into two 6 L flasks each containing 2 L of Luria broth media at 37 °C with shaking at 180 rpm until an OD600 of 0.8 is reached.
- Cool down the culture to 16 °C and induce GEN1 expression with 0.1 mM isopropyl-β-d-thiogalactopyranoside (IPTG) for 48 h.
- Harvest the cells by spinning them down at 4 °C at 1000 x g in a centrifuge. Each liter of culture yields 5–6 g of the pellet.
- Discard the supernatant and resuspend the pelleted cells in lysis buffer (Table 1) using 4 mL/g of cells.
- Perform cell lysis using a cell disruptor at 30 kPsi then spin down at 10,000 x g for 1 h at 4 °C. Collect the supernatant and filter it on ice using 0.45 µm filters.
- Perform protein purification using FPLC by passing the filtrate through a 5 mL Ni-NTA column at 2.5 ml/min flow rate using Buffer A (Table 1).
- Wash with 15 column volumes (CV). Elute with a linear gradient of Buffer A and 500 mM Imidazole over 20 CV in 5 mL fractions. GEN1 elutes from the column at around 100 mM Imidazole.
- Pipette 10 µL aliquots from the collected fractions, add equal volume of 2x SDS loading dye to each aliquot. Denature the samples by heating at 90 °C for 5 min, cool, and spin down the samples.
- Load the samples onto 10% Bis-Tris gel. Run the gel for 30–45 min at 200 V. Stain using Coomassie Brilliant Blue, then destain. Collect the fractions that contain purified GEN1.
- Reduce the salt concentration of the combined fractions to 100 mM by dilution using buffer C (Table 1).
- Pass the low salt protein through a 5 mL heparin column at a flow rate of 3 mL/min using Buffer B (Table 1).
- Wash with 10 CV. Elute using a gradient of 20 CV with Buffer B and 1 M NaCl. Collect 5 mL fractions in which GEN1 elutes around 360 mM NaCl.
- Check the eluted fractions for purified GEN1 fractions as described in step 5.8. Combine those fractions and dilute to 100 mM NaCl using Buffer C.
- Load the lower salt protein onto a cation exchange column at 1 mL/min flow rate using Buffer B.
- Elute by a gradient of 40 CV using Buffer B and 1 M NaCl. Collect 1.7 mL fractions in which GEN1 elutes around 300 mM NaCl.
- Check for the purity of GEN1 in the eluted fractions as described in step 5.8.
- Combine the purest fractions and dialyze at 4 °C against storage buffer (Table 1). Perform at least one exchange of the buffer during dialysis.
- Measure the protein concentration ~0.5–1 mg/mL. Aliquot the dialyzed protein in 10–15 µL volumes in small tubes, flash-freeze in liquid nitrogen, and store at -80 °C.
6. Single-molecule FRET experiments
NOTE: The smFRET experiments are performed on a custom-built objective based TIRF set-up (Figure 1C) described previously31.
- Single-color FRET experiments
- Apply one drop of immersion oil onto the 100x TIRF objective. Set the EMCCD to suitable gain to optimize the signal to background and prevent saturation.
NOTE: Do not look directly into the laser beam and wear protective goggles when aligning the laser. - Place the flow cell carefully on the sample holder. Gradually raise the objective using coarse adjustment until the oil touches the coverslip.
- Turn on the green laser (532 nm). Switch to fine adjustment mode of the objective. Direct the emission to the camera port to observe the image on the monitor.
- Adjust the height of the objective until the functionalized surface of the coverslip is brought in focus and can be observed on the monitor.
NOTE: The image acquisition by EMCCD triggers the laser excitation via the acousto-optic tunable filter (AOTF) to prevent sample photobleaching when images are not being acquired. - Check that the background from the functionalized surface of the coverslips does not exceed few spots before flowing in the fluorescently labeled HJ.
- Dilute the stock substrate approximately 1000 times in TE100 buffer (Table 1) to a final concentration of 1–5 nM. Pipette 0.2–0.5 µL of the diluted substrate into 120 µL of the imaging buffer with OSS into a 0.5 mL tube.
- Connect the outlet of the flow cell to the syringe pump. Insert the inlet tube of the flow cell into 1.5 mL tube and operate the syringe pump at a flow rate of 30–50 µL/min to withdraw the solution from the tube.
- Frequently check the surface for good coverage (100–300 of homogenously distributed, well-spaced substrate) by imaging briefly with the green laser.
- If the surface coverage is still not enough either wait for few minutes for the fluorescently labeled HJ from the solution to settle onto the surface or repeat the flowing step.
- Flow another 120 µL of imaging buffer (Table 1) at 30–50 µL/min to wash unbound fluorescently labeled HJ. Then let the flow cell sit for 5 min to allow for the OSS to deplete dissolved oxygen. The photobleaching of the fluorophores should be minimal at the start of imaging.
- Set the exposure time (~60 ms), the cycle time will be automatically set by software based on the speed of data transfer (~104 ms), and specify the desired number of cycles or frames (~400).The emission from donor (Cy3) and acceptor (Alexa Fluor 647) is split into two color channels by an image splitter device.
- Find a suitable area on the surface, focus the image by adjusting the height of the objective and record and save the movie in 16-bit TIFF format.
- Move to a new area.
NOTE: Always move in one direction only (i.e., from outlet to inlet) to avoid imaging the same area twice. - Prepare 1, 2, 5, 10, 25, 50, 75, and 100 nM GEN1 in 120 µL of imaging buffer one at a time. Flow the solution at a flow rate of 30-50 µL/min.
NOTE: If the required measurement is done under steady state as in the binding of HJ by GEN1 or the isomerization of the free HJ, then wait 3–5 min after the flow stops to record the movie. Acquire three to four movies from new areas for each GEN1 concentration. - If the measurement is performed under continuous flow as in cleavage of HJ by GEN1 then start recording 5–10 s before the entrance of GEN1 into the flow cell. Repeat the measurement by moving to a new channel in the six-channel flow cell.
- At the end, use a fixed fluorescent bead slide to map the donor and acceptor particles to each other in the image splitting device.
- Add 0.2 µL of 1 µm diameter fluorescent beads into 500 µL of 1 M Tris (pH = 8.0) to allow the beads to stick to the surface.
- Cut a square (18 mm x 18 mm) inside a 22 mm x 22 mm piece of a double-sided adhesive seal. Peel off and stick the piece to the middle of a 76 mm x 25 mm quartz slide.
- Place 50 µL of the diluted beads solution and leave for 5–10 min to settle. Attach a 22 mm x 22 mm coverslip on top of the square piece. Dry excess beads solution with tissue, then seal the chamber by epoxy glue.
- Acquire 100 frames of the beads slide at a 60 ms exposure time.
CAUTION: Lower the laser power and the EMCCD gain to minimum to avoid saturation of the detector. - Install the software package (e.g., TwoTones) and open the movies therein as indicated in the user manual36. Select the positions of the individual beads in the donor and acceptor channels. Generate a transformation matrix as described in the manual.
NOTE: This software uses transformation matrix to match the positions of the particles in the donor and acceptor channels and correct for any slight misalignment in the image splitting device. - Go to File, press Load Movie, then select the movie file and press Open. In file menu, press Load TFORM and select the transformation matrix generated from the beads slide. Adjust the threshold for the donor and acceptor channels until no false positives are included.
- In the Channel filter menu, choose D&&A option to select for particles labeled with both donor and acceptor. Check the Nearest neighbor limit field to exclude molecules that are very near to each other. Check Max ellipticity to exclude very eccentric molecules and check Width limits to exclude very broad or very narrow molecules.
- Type plotHistCW as instructed in Twotones manual to construct histograms.
NOTE: The “apparent” FRET efficiency is calculated by the program by dividing the emission of the acceptor by the total emissions from the donor and acceptor. Twotones uses 100 intervals to bin the distribution of the states of the molecules against the FRET efficiency. - Type plotTimetraceCW as instructed in Twotones manual to generate the time-traces for each molecule.
NOTE: Time-traces can be further analyzed by vbFRET37 to identify different FRET states, their respective dwell times, and transition rates between different states.
- Apply one drop of immersion oil onto the 100x TIRF objective. Set the EMCCD to suitable gain to optimize the signal to background and prevent saturation.
- Two-color alternating excitation FRET (ALEX) experiments
- Record a movie composed of consecutive frames of donor and acceptor emissions by direct excitations with the green and red lasers, respectively, each ~80 ms in duration.
- Open the acquired ALEX movies in Twotones. Set the suitable detection threshold as ~300 for the three channels: donor emission due to donor excitation (DexDem); acceptor emission due to donor excitation (DexAem); and acceptor emission due to direct excitation (AexAem).
- Apply the Channel filter DexDem&&DexAem&&AexAem to select for the particles that have both donor and acceptor. Link the particles ~200–300 in the three channels.
- Use the plotHistALEX MATLAB code to generate ALEX histograms. Fit different peaks in the histograms to gaussian functions and determine the percentage of each population the area under the curve using Origin software38.
NOTE: The peaks in the binding assay correspond to the bound GEN1-HJ complex, while in the free HJ, the peaks represent the interchanging isomers. - Use the plotTimetraceALEX MATLAB code to generate a time-trace for each molecule showing donor emission by direct excitation, and acceptor emissions due to FRET and direct excitation.
NOTE: ALEX time-traces independently to show the emissions of both the donor and acceptor, but at lower temporal resolution than single-color FRET. Similar to single-color FRET, ALEX time-traces can be further analyzed by vbFRET to identify different FRET states and their respective dwell times. - Determine the dissociation constant by fitting the percentages of the bound population versus GEN1 concentration to a hyperbolic function.
- Time lapse single-color FRET
- Set the exposure time of the green laser to 60 ms and cycle time to 624 ms or lower, depending on the speed of the observed dynamics.
- Set the flow rate to 110 µL/min in one channel of the six-channel flow cell. Start the recording briefly before the entrance of GEN1 inside the flow cell.
NOTE: Continuous flow leads to rapid photobleaching of the fluorophores, therefore synchronizing the start of imaging and protein entry maximizes the number of captured events. The optimal syringe pump reading depends on the dead-volume and the exact tubing used to assemble the flow cell; in our case it is ~25 µL. - Acquire a movie of ~125 frames for a total acquisition time of 78 s. At the end of the recording, expose the sample to the red laser for 50 frames each with 25 ms exposure time to probe the acceptor.
NOTE: This method prolongs the observation window in cleavage experiment through decreasing the number of excitation cycles. Kinetic parameters as kon and koff of dimerization are derived by fitting the distribution to a bi-exponential model30,38.
7. Electrophoretic mobility shift assays (EMSA)
- In 50 µL total volume, incubate the desired concentration of GEN1 with 50 pM Cy5-labeled HJ at RT for 30 min in EMSA binding buffer (Table 1).
- Load the samples on 8 cm x 8 cm of 6% Tris-borate-EDTA gel. Run the gel using 100 V for 1 h + 20 min in 1x TBE buffer at RT.
- Determine the percentage of bound substrate at a GEN1 concentration from its relative contribution to the total fluorescence intensity of the respective lane.
NOTE: GEN1 monomer-HJ (band I) is identified by the agreement of its size with the picomolar binding of GEN1 monomer to the nicked HJ21,30. GEN1-dimer-HJ is assigned to band II because of the stepwise binding of GEN1 monomer to the HJ21,23. - Calculate the apparent binding constants Kd-monomer-app-EMSA and Kd-dimer-app-EMSA using the equation:
![Equation for binding affinity in biochemical analysis, Y=Max*[GEN1]^n/(Kd-app-EMSA^n+[GEN1]^n).](/files/ftp_upload/60045/60045equ01.jpg "figure-protocol-1")
Where: Max is the concentration at which the respective species reached its maximum binding (monomer or dimer); n is the Hill coefficient; Kd-app-EMSA is the apparent binding constant of the respective species, denoting the concentration of GEN1 at which half-maximum of monomer or dimer is present.
Results
Loading...
$$\rightleftharpoonup{xx}$$
$$\longleftharp{xx}$$,
$$\longrightharp{xx}$$,
Conformer bias and isomerization of the HJ
The isomerization of HJ has been extensively investigated by FRET through the labeling of two adjacent arms of the junction17,18,39. The donor (Cy3) and acceptor (Alexa Fluor 647) are positioned at the two neighboring arms, R (strand 2) and X (strand 3), respectively (Figure 2A). The stacked-X isomers were assigned by their two continuous strands [i.e., Iso(1,3) or Iso(2,4)]. The ALEX FRET histogram of adjacent-label X0 shows two peaks that correspond to interchanging of the more abundant Iso(1,3) (E ~0.75) and less abundant Iso(2,4) (E ~0.40) (Figure 2B).
Single-color FRET is used to acquire time-traces for recording the rapid conformational changes in the free HJ with high temporal resolution ~10 ms via reducing the used area of the EMCCD2 camera. A representative single-color FRET time-trace of X0 junction shows the transitions between high and low FRET isomers (Figure 2B). The isomerization rates kIso(1,3)-Iso(2,4) and kIso(2,4)-Iso(1,3) obtained from the dwell time histograms of Iso(1,3) and Iso(2,4) (Figure 2C) are consistent with those reported previously17.
SMFRET demonstrates active distortion of the HJ by GEN1
HJ undergoes structural rearrangement upon binding to GEN122. Thus, the spacing between the donor and acceptor is similar in both Iso(1,3) and Iso(2,4) (Figure 3A). The smFRET binding assays were carried out in the presence of Ca2+ to prevent cleavage of the HJ. FRET histograms of the adjacent-label X0 junction at different GEN1 concentrations were acquired by ALEX (Figure 3B). The histogram is fit to two Gaussian functions: one corresponding to the free high FRET Iso(1,3), and the other corresponding to the bound GEN1-HJ population after subtracting the contribution of the Iso(2,4) from the low FRET peak.
At saturating GEN1 concentration, the FRET histogram of X0 has only a single low FRET peak corresponding to GEN1 bound to either isomer of the HJ as predicted by the model22. The apparent monomer dissociation constant (Kd-monomer-app) is determined from the hyperbolic fit of the percentages of GEN1-bound population as a function of GEN1 concentration (Figure 3C). The adjacent-label nk-X0 represents a singly nicked version HJ that mimics the product after the first incision reaction. Due to the relief of stacking strain by the simulated nick, nk-X0 is a non-isomerizing structure40 as evident from the single substrate peak at E ~0.40, unlike X0 (Figure 3D vs. Figure 3B). The structure of GEN1-nk-X0 complex is similar to that of the GEN1-X0 complex, as indicated by the similarity in FRET efficiencies (E ~0.25 for nk-X0 and 0.32 for X0) (Figure 3D vs. Figure 3B). The strong binding of GEN1 monomer to nk-X0 is demonstrated by the 40-fold lower Kd-monomer-app value than that of X0 (Figure 3E vs. Figure 3C). This tight binding may act as a safeguard mechanism against the incomplete resolution of the HJ in the unlikely event of the dissociation of GEN1 dimer or one of its monomers.
Stepwise binding of GEN1 monomer to the HJ
The binding of GEN1 monomer to the HJ followed by dimer formation is a unique feature for the eukaryotic HJ resolvase GEN1 compared to prokaryotic resolvases, which exist in dimeric form in solution21,23,41. EMSA of GEN1 at 50 pM X0 shows the stepwise association of GEN1 into higher order complexes, as indicated by the roman numerals in the upper panel (Figure 4A). The dissociation constant of GEN1 monomer determined by EMSA (Kd-monomer-EMSA) coincides with the dissociation constant from the smFRET binding assay Kd-monomer-app (Figure 4A and Figure 3C, respectively). The quantification of band II is used to calculate the equilibrium dissociation constant of GEN1 dimer (Kd-dimer-EMSA). EMSA of GEN1 at 50 pM nk-X0 demonstrates the prominent monomer binding as indicated by the very low Kd-monomer-app-EMSA which is 30-fold lower than that of X0, while its Kd-dimer-EMSA is comparable to that of X0 (Figure 4B).
Further evidence that GEN1 monomer binds and distorts the HJ is the observation of a significant number of traces of uncleaved particles with stable low FRET state (Figure 4C) in the presence of Mg2+ at low GEN1 concentrations. The number of these traces decreased upon increasing GEN1 concentration. The resolution of the HJ is driven by the tight binding of GEN1 monomer, which supports dimer formation. The monomer binding is observed in the time-traces of the uncleaved nk-X0 in Mg2+, which extends until few nanomolar concentration (Figure 4D). The GEN1 monomer binds tightly to safeguard nk-X0, eventually ensuring full resolution through dimer formation.
SMFRET resolution assay of the HJ
The term “cleavage” in smFRET assays is used interchangeably with “resolution” of the HJ, since in this assay only the product release that follows the second cleavage event is detected. The events are recorded by time-lapse single-color excitation to minimize photobleaching of the photo-sensitive acceptor over the acquisition time of ~1.3 min.
The schematic in Figure 5A illustrates the incisions of strands 1 and 3 of X0 Iso(1,3) after the binding and distortion by GEN1 of an X0 attached to the functionalized glass. Both donor and acceptor go into solution resulting in the loss of their signals after the HJ resolution. The first and second incisions are decoupled in nk-X0, which exemplifies a prototype for the partially resolved HJ. Upon binding of GEN1, nk-X0 adopts a similar structure to X0. The resolution proceeds by a single incision in strand 1, as illustrated in Figure 5B.
The simultaneous departure of the donor and acceptor after a stable low FRET state in traces of resolved X0 occurred without the emergence of an intermediate FRET (E = ~0.40) indicates that complete resolution occurs within the lifetime of the GEN1-HJ complex (Figure 5C). Therefore, these results suggest that the HJ resolution occurs within the GEN1-HJ complex lifetime. The resolution of nk-X0 also proceeds after structural rearrangement and concludes by the departure of the duplex carrying two fluorophores (Figure 5D) similar to X0.
Kinetics of GEN1 dimerization on GEN1 monomer bound HJ
Time-lapse smFRET measures τbefore-cleavage which mainly includes the time required for dimer formation and resolution of the HJ after the distortion by GEN1 monomer. Applying this technique, direct evidence is provided to support the claim that dimer formation is required for the resolution of both X0 and nk-X0, since the distribution of τbefore-cleavage is GEN1 concentration-dependent.
The apparent rate of the HJ resolution (kapp) is defined as the inverse of the mean of τbefore-cleavage at the respective GEN1 concentration. The term “apparent” is used to describe the rate of the HJ resolution, since the possibility that GEN1 remains bound to the product after the HJ resolution cannot be excluded.
The probability density functions (PDF) of the τbefore-cleavage distributions of X0 (Figure 6A) reflect the time for dimer formation, which is longer at low GEN1 concentrations, then shorter at higher GEN1 concentrations. The association and dissociation rates for the dimer, kon-dimer and koff-dimer, respectively, are determined from a bi-exponential model30. Also, the PDFs of nk-X0 (Figure 6B) show a similar distribution to X0 indicating the requirement for dimer formation.
The plot of kapp versus GEN1 concentration was fitted to a hyperbolic function. The apparent catalysis rate constants (kMax-app) of X0 and nk-X0 are 0.107 ± 0.011 s-1 and 0.231 ± 0.036 s-1, respectively (Figure 6C). The plots of kapp for X0 and nk-X0 junctions intersect at GEN1 concentration ~5.6 nM because of the faster kMax-app and slower kon-dimer of the nicked compared to the intact junction.
In summary, the relatively fast kon-dimer and slow koff-dimer lead to the progression of the forward reaction towards HJ resolution once the dimer is formed. The strong binding of GEN1 monomer to the nk-X0 junction constitutes a fail-safe mechanism against any unlikely aborted second cleavage or helps to pick up any incompletely unresolved HJs left behind by primary resolution pathways in the cell.
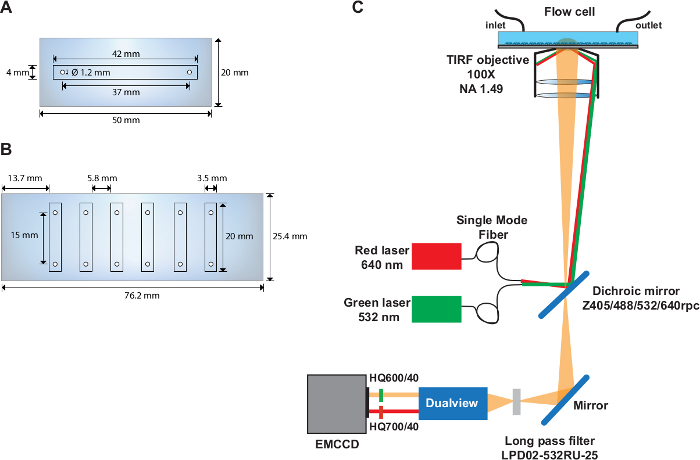
Figure 1: Single and multiple-channel flow cells and layout of the optical set-up.
(A) Schematic of the single-channel flow cell. (B) Schematic of the six-channel flow cell. (C) Layout of the optical set-up depicting the excitation sources, TIRF objective, dichroic mirror installed inside the filter cube, and emission filters used in the image splitter device. Please click here to view a larger version of this figure.
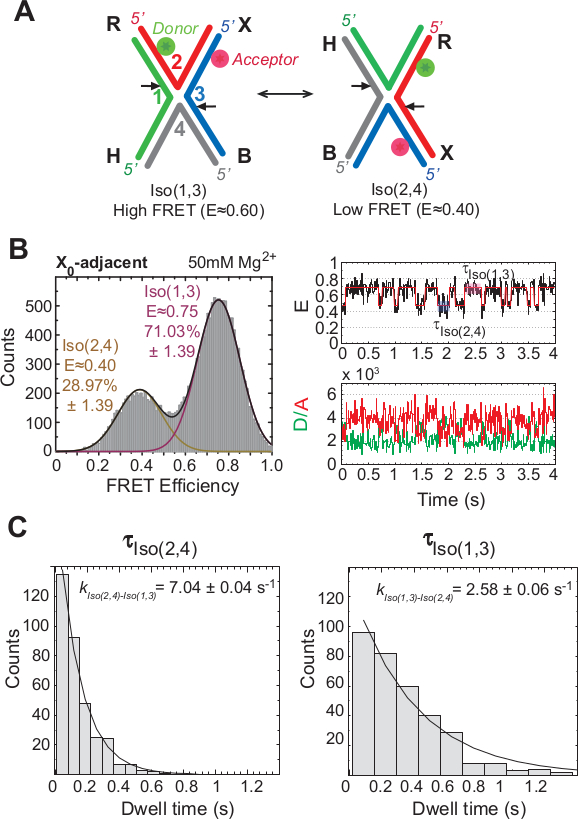
Figure 2: Conformer bias and isomerization of the HJ observed by FRET.
(A) Isomerization of the adjacent-label X-stacked HJ conformers named after the two continuous strands. The strands are numbered, while the arms are denoted by letters. The incision sites are shown by arrows. The positions of the donor (green) and acceptor (red) and the change in FRET upon isomerization are indicated. (B) Right panel: FRET time-trace (black) and idealized FRET trace (red) of X0 at 50 mM Mg2+. Left panel: FRET histogram of X0 at 50 mM Mg2+. The fluorescence intensities of the donor (green) and acceptor (red) are shown below. (C) The dwell time histograms of adjacent-label X0 Iso(1,3) and Iso(2,4) were fitted to single-exponential functions to determine the isomerization rates. The uncertainties indicate the 95% confidence interval of the fit. This figure has been modified from previously published literature30.
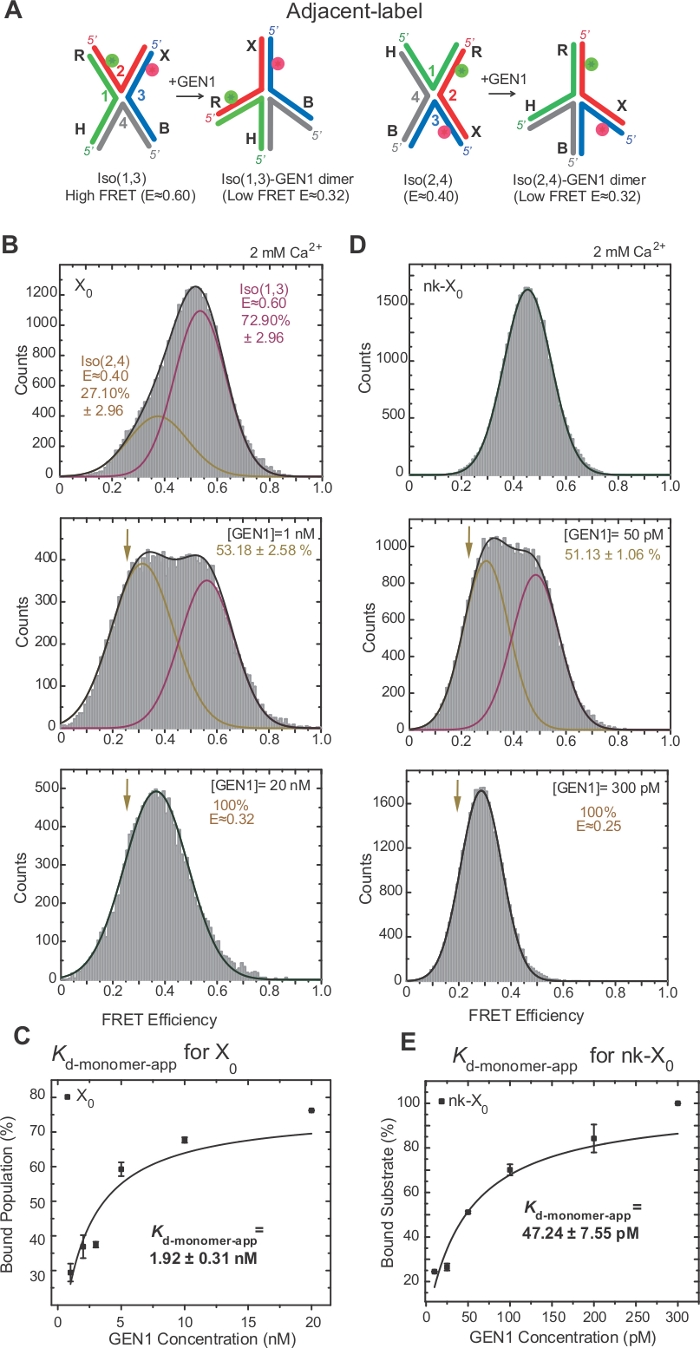
Figure 3: Active distortion of the HJ by GEN1.
(A) Structural modification of adjacentlabel HJ based on the proposed model22. (B) ALEX FRET histogram of adjacent-label X0 has a major high FRET peak (E = ~0.6) corresponding to Iso(1,3) and lower FRET peak (E = ~0.4) for Iso(2,4). The entire histogram is fit to two Gaussian functions: one corresponding to the free high FRET Iso(1,3), and the other corresponding to the bound population minus the initial contribution of Iso(2,4) to the total population. (C) The apparent monomer dissociation constant (Kd-monomer-app) is determined from a hyperbolic fit of the percentages of GEN1-bound populations as a function of GEN1 concentration. (D) FRET histograms of the adjacent-label nk-X0 at different GEN1 concentrations. The area under the low FRET (E = ~0.25) Gaussian corresponds to the percentage of the bound population. (E) The Kd-monomer-app of nk-X0 is determined from the hyperbolic fit of GEN1-bound population. The error bars represent the standard deviations from two or more experiments. This figure has been modified from previously published literature30. Please click here to view a larger version of this figure.
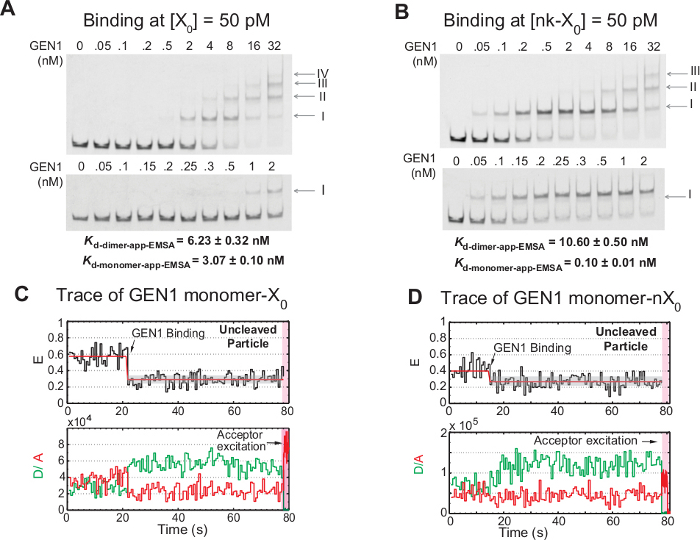
Figure 4: Stepwise binding of GEN1 to the HJ.
(A) Electrophoretic mobility shift assay (EMSA) of GEN1 at 50 pM X0. Upper panel: the roman numerals indicate the number of GEN1 monomers in the complex. Lower panel: binding of GEN1 monomer to X0. The apparent dissociation constants were obtained from a sigmoidal fit of the respective species and represent the average of two experiments. (B) EMSA of GEN1 at 50 pM nk-X0 demonstrates the prominent monomer binding as indicated by the very low Kd-monomer-app-EMSA. (C) FRET time-trace of bound but uncleaved adjacent-label X0 in Mg2+. Donor excitation for ~1.3 min was performed, followed by direct acceptor excitation (shaded pink region). (D) FRET time-trace of bound but uncleaved adjacent-label nk-X0 in Mg2+. This figure has been modified from previously published literature30. Please click here to view a larger version of this figure.
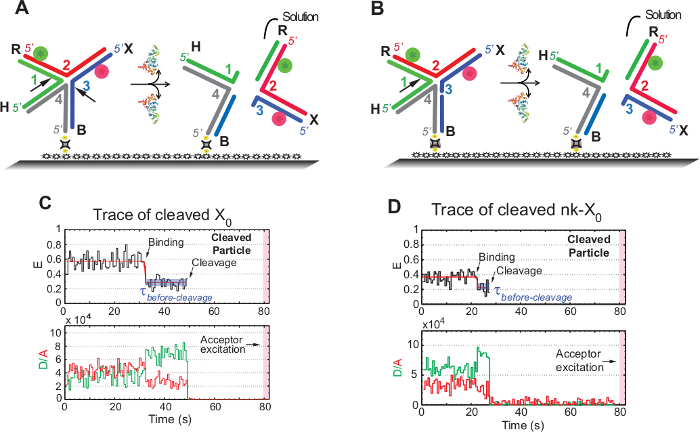
Figure 5: SMFRET resolution assay of the HJ.
(A) Schematic of the adjacent-label X0 Iso(1,3) after distortion by GEN1. The substrate is attached to the functionalized surface via biotin/avidin linkage. The dissociation of GEN1 after the two incisions results in the loss of both donor and acceptor that go into solution. (B) Schematic of the resolution of adjacent-label nk-X0 by cleaving strand 1. (C) Time-trace (black) at 2 mM Mg2+ of the cleavage of Iso(1,3). The onset of GEN1 binding forms a stable low FRET state until the FRET signal is abruptly lost due to cleavage. Correspondingly, the increase in the donor and the decrease of acceptor fluorescence intensities upon GEN1 binding is followed by the simultaneous disappearance of the fluorescence from both dyes upon cleavage. (D) Similarly, the time-trace of nk-X0 shows a stable low FRET state upon GEN1 binding which is concluded by the abrupt loss of the FRET signal. This figure has been modified from previously published literature30. Please click here to view a larger version of this figure.
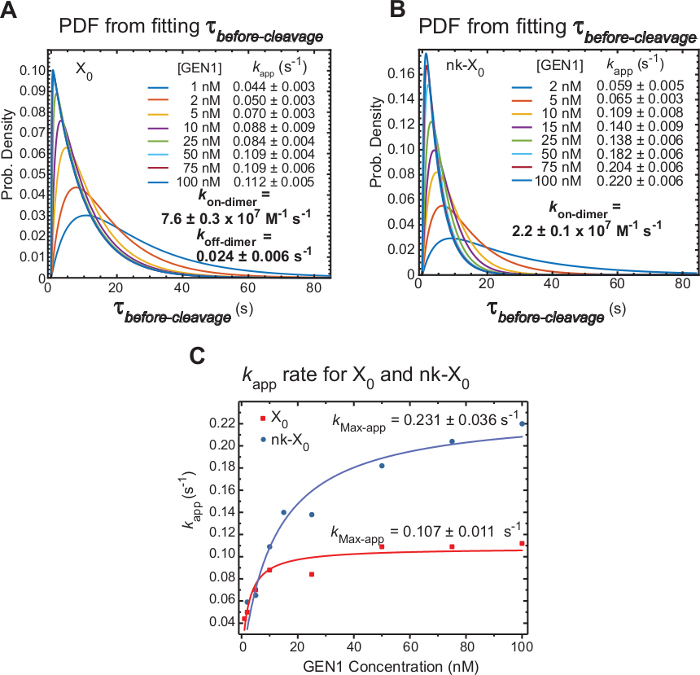
Figure 6: Kinetics of GEN1 dimerization on GEN1 monomer bound HJ.
(A) The probability density function (PDF) plot of the τbefore-cleavage distribution of X0 illustrates its dependence on GEN1 concentration. Dwell times of the low FRET state (τbefore-cleavage) at the respective GEN1 concentration were obtained from two or more experiments and used to obtain average rates (kapp). The listed kapp rates are determined from the inverse of the mean τbefore-cleavage at the respective GEN1 concentration. The association (kon-dimer) and dissociation (koff-dimer) rates for dimer formation are calculated from a bi-exponential model38. The errors represent SEM of kapp. (B) The PDF plot of the τbefore-cleavage distributions of nk-X0 and the respective kapp rates. (C) Plot of kapp versus GEN1 concentration fitted to a hyperbolic function to determine the apparent catalytic rate (kMax-app). The plot of kapp for X0 and nk-X0 illustrates the faster initial kapp of X0 which is then surpassed by nk-X0 above [GEN1] ~5.6 nM. This figure has been modified from previously published literature30. Please click here to view a larger version of this figure.
| Buffer | Compostion | ||
| Binding buffer | 40 mM Tris-HCl pH 7.5, 40 mM NaCl, 2 mM CaCl2, 1 mM DTT, 0.1% BSA and 5% (v/v) glycerol | ||
| Buffer A | 20 mM Tris-HCl pH 8.0, 1 mM DTT and 300 mM NaCl | ||
| Buffer B | 20 mM Tris-HCl pH 8.0, 1 mM DTT and 100 mM NaCl | ||
| Buffer C | 20 mM Tris-HCl pH 8.0 and 1 mM DTT | ||
| Cleavage buffer | 40 mM Tris-HCl pH 7.5, 40 mM NaCl, 2 mM MgCl2, 1 mM DTT, 0.1% BSA and 5% (v/v) glycerol | ||
| EMSA binding buffer | 40 mM Tris-HCl pH 7.5, 40 mM NaCl, 1 mM DTT, 2 mM CaCl2, 0.1 mg/ml BSA, 5% (v/v) glycerol and 5 ng/µl Poly-dI-dC | ||
| Imaging buffer (binding) | 40 µL (±)-6-Hydroxy-2,5,7,8-tetramethylchromane-2-carboxylic acid (4 µM), 60 µL PCA (6 nM), 60 µL PCD (60 nM) and 840 µL of Binding buffer | ||
| Imaging buffer (cleavage) | 40 µL (±)-6-Hydroxy-2,5,7,8-tetramethylchromane-2-carboxylic acid (4 µM), 60 µL PCA (6 nM), 60 µL PCD (60 nM) and 840 µL of Cleavage buffer | ||
| Lysis buffer | 20 mM Tris-HCl pH 8.0, 10 mM β-mercaptoethanol, 300 mM NaCl and 2 mM PMSF | ||
| PCD storage buffer | 100 mM Tris-HCl pH 7.5, 1 mM EDTA, 50 mM KCl and 50% glycerol | ||
| storage buffer | 20 mM Tris-HCl pH 8.0, 1 mM DTT, 0.1 mM EDTA, 100 mM NaCl and 10% glycerol | ||
| TBE buffer | 89 mM Tris-HCl, 89 mM Boric acid and 2 mM EDTA | ||
| TE100 buffer | 10 mM Tris.HCl pH 8.0 and 100 mM NaCl | ||
| Tris-EDTA buffer | 50 mM Tris-HCl pH 8.0 and 1 mM EDTA pH 8.0 | ||
Table 1: The list of buffers and their compositions used in this study.
| Oligo | Sequence | ||
| X0-st1 | ACGCTGCCGAATTCTACCAGTGCCTTGCTAGGACATCTTTGCCCACCTGCAGGTTCACCC | ||
| X0-st2 | GGGTGAACCTGCAGGTGGG/iCy3/AAAGATGTCCATCTGTTGTAATCGTCAAGCTTTATGCCGT | ||
| X0-st3 | ACGGCATAAAGCTTGACGA/iAF647-dT/TACAACAGATCATGGAGCTGTCTAGAGGATCCGACTATCG | ||
| X0-st4 | 5’BiotinCGATAGTCGGATCCTCTAGACAGCTCCATGTAGCAAGGCACTGGTAGAATTCGGCAGCGT | ||
| X0-Adj | X0-st1, X0-st2, X0-st3 & X0-st4 | ||
| X0In_st2 | GGGTGAACCTGCAGGTGGGCAAAGATGTCCATCTGTTGTAATCGTCAAGCTTTATGCCGT | ||
| X0In_st4 | 5’BiotinCGATAGTCGGATCCTCTAGACAGCTCCATGTAGCAAGGCA/iCy3/TGGTAGAATTCGGCAGCGT | ||
| Nk-X0 | X0-st1, X0-st2, X0-nk3a, X0-nk3b & X0-st4 | ||
| X0-nk3a | ACGGCATAAAGCTTGACGA/iAF647-dT/TACAACAGATC | ||
| X0-nk3b | ATGGAGCTGTCTAGAGGATCCGACTATCG | ||
Table 2: SMFRET and EMSA HJ substrates. The list of oligonucleotides used for the preparation of the fluorescently labeled HJs for smFRET and EMSA. The oligos were commercially obtained. The fluorescently labeled oligos were HPLC-purified and, when possible, oligos of ≥60 bp were PAGE-purified.
Discussion
Loading...
$$\rightleftharpoonup{xx}$$
$$\longleftharp{xx}$$,
$$\longrightharp{xx}$$,
In this study, different smFRET techniques were implemented to determine the kinetics of HJ resolution by GEN130. Similar smFRET approaches were used to follow the double-flap DNA conformational requirement and cleavage by the DNA replication and repair flap endonuclease 142,43,44. Here, critical steps in this protocol are discussed. The silanization reaction should be free from any trace of humidity. The pegylation solution should be applied rapidly to the silanized glass once PEG is dissolved to avoid hydrolysis. In the multi-channel flow cell, any trapped air in the adhesive sheet should be removed to avoid leakage between neighboring channels. The PCA solution should be freshly prepared since it oxidizes over time. The addition of 10 N NaOH should be dropwise, with vortexing in between. The fluorescence background in the coverslip should be minimal before flowing the fluorescently labeled HJ. The imaging in the flow cell should be performed in one direction to avoid imaging bleached areas. In ALEX experiments, the power of the red laser should be reduced to avoid rapid bleaching of the acceptor. In the time-lapse experiments, the cycle time has to be shorter than the fastest event.
smFRET is a sensitive technique that can provide valuable real-time insights in biomolecular reactions. However, this method has several technical challenges, among which is achieving measurable change in FRET during the biochemical reaction. This is necessary to obtain well-separated features in the histograms and distinguishable states in the time-traces. In many cases, smFRET requires careful design of the substrates, selection of the fluorophore pairs and their positions, and amplification of FRET changes in the DNA substrate because of the little structural changes in the substrate45. Another approach for performing FRET is to use labeled proteins46. The observation window in FRET is limited by the stability of the acceptor such as Cy5 or Alexa Fluor 647 which tends to bleach more rapidly than the donor (Cy3 in this case). Therefore, FRET requires a continuous search for stable fluorophores to extend the experiment duration and efforts to develop oxygen scavenging systems to prolong the fluorescence signal and maximize the signal-to-noise ratio47,48.
Among the tips for troubleshooting in smFRET is balancing the several parameters involved in imaging such as the laser power, exposure time, cycle time, and number of cycles to maximize the fluorescence emission, prolong the experiment duration, and achieve appropriate sampling intervals for the enzyme dynamics. Longer observation times and minimal effects from photobleaching are essential to obtain high fidelity dwell time distributions that represent the enzyme dynamics. ALEX generates better histograms since this method is subjected to lower contributions from photobleached particles compared to single-color FRET. However, the temporal resolution in ALEX is lower than that in single-color FRET.
Finally, smFRET’s emphasis on detecting conformational/structural changes in individual molecules in real-time bridges the gap between high resolution structural techniques (i.e., X-ray crystallography, nuclear magnetic resonance, electron microscopy), which provides atomic resolution structural details under static conditions and bulk methods that yield the ensemble average of a measurable property. In many aspects, smFRET has proven to be a powerful technique for studying biological systems in real-time.
Disclosures
Loading...
$$\rightleftharpoonup{xx}$$
$$\longleftharp{xx}$$,
$$\longrightharp{xx}$$,
The authors declare no competing financial interests.
Acknowledgements
Loading...
$$\rightleftharpoonup{xx}$$
$$\longleftharp{xx}$$,
$$\longrightharp{xx}$$,
This work was supported by King Abdullah University of Science and Technology through core funding and Competitive Research Award (CRG3) to S. M. H.
Materials
| Name | Company | Catalog Number | Comments |
|---|---|---|---|
| (±)-6-Hydroxy-2,5,7,8-tetramethylchromane-2-carboxylic acid (Trolox) | Sigma-Aldrich | 238813 | |
| 0.1 M sodium bicarbonate buffer | Fisher | 144-55-8 | |
| 10 % Novex Tris-Borate-EDTA gel | Thermo Fisher Scientific | EC6275BOX | |
| 100 X TIRF objective | Olympus | NAPO 1.49 | |
| 3,4-dihroxybenzoic acid (PCA) | Sigma-Aldrich | P5630 | |
| 3-aminopropyltriethoxysilane (APTES) | Sigma-Aldrich | 741442 | |
| 6% Novex Tris-Borate-EDTA gel | Thermo Fisher Scientific | EC6265BOX | |
| Adhesive sheet | Grace bio-labs | SA-S-1L | |
| Benchtop refrigerated centrifuge | Eppendorf | Z605212 | |
| Biotin-PEG | Laysan Bio | Biotin-PEG-SVA 5000 | |
| Bovine Serum Albumin (BSA) | New England Biolabs | B9001S | |
| Calcium Chloride Dihydrate | Sigma-Aldrich | 31307 | |
| cation exchange column | GE healthcare | MonoS (4.6/100) | |
| Cell distruptor | Constant Cell Disruption System | TS5/40/CE/GA | |
| Coomassie Brilliant Blue | MP Biomedicals | 808274 | |
| Cy3 emission filter | Chroma | HQ600/40M-25 | |
| Cy5/Alexa Fluor 647 emission filter | Chroma | HQ700/40M-25 | |
| Dichroic for DV2 filter cube | Photometrics | 630dcxr-18x26 | |
| Dithiothreitol (DTT) | Thermo Scientific | R0861 | |
| Drill | Dremel | 200-1/21 | |
| Electronic cutter | Copam | CP-2500 | |
| EMCCD camera | Hamamatsu | C9100-13 | |
| Epoxy glue | Devcon | 14250 | |
| FPLC Aktapurifier UPC 10 | GE Healthcare | 28406268 | |
| GelQuant.NET software | biochemlabsolutions.com | Version 1.8.2 | |
| GEN1 entry vector | Harvard plasmid repository | HSCD00399935 | |
| Glycerol | Sigma Life Science | G5516 | |
| green laser (emission 532 nm) | Coherent | Compass 315M-100 | |
| Heparin column | GE healthcare | HiTrap Heparin column | |
| HEPES | BDH | BDH4162 | |
| Image splitter | Photometrics | Dualview (DV2) | |
| Imidazole | Sigma-Aldrich | I2399 | |
| Inverted microscope | Olympus | IX81 | |
| Isopropyl-ß-D-thiogalactoside (IPTG) | Goldbio. | 12481C100 | |
| Laser scanner | GE healthcare | Typhoon Trio | |
| LB Broth | Fisher Scientific | BP1426-500 | |
| Long pass 532nm filter | Semrock | LPD02-532RU-25 | |
| Magnesium Chloride | Sigma Life Science | M8266 | |
| mPEG | Laysan Bio | mPEG-SVA 5000 | |
| Neutravidin | Pierce | 31000 | |
| Ni-NTA column | GE healthcare | HisTrap FF | |
| NuPAGE 10% Bis-Tris gels | Novex Life technologies | NP0301BOX | |
| NuPAGE 10% Bis-Tris Protein Gels | Thermo Fisher Scientific | NP0302PK2 | |
| Origin software | OriginLab Corporation | Version 8.5 | |
| Phenylmethylsulfonyl fluoride (PMSF) | Alexis Biochemicals | 270-184-G025 | |
| Phosphate-buffered saline | GIBCO | 14190 | |
| Polyethylene Tubing (I.D. 0.76 mm O.D. 1.22mm) | Fisher (Becton Dickinson) | 427416 | |
| Protocatechuate 3,4-dioxygenase (3,4-PCD) | Sigma-Aldrich | P8279-25UN | |
| Quad-band dichroic | Chroma Inc | Z405/488/532/640rpc | |
| red laser (emission 640 nm) | Coherent | Cube 640 100C | |
| Sodium Chloride | Fisher Chemical | S271 | |
| Sorvall RC-6 plus centrifuge | Thermo Fisher Scientific | 46910 | |
| Spectrophotometer | Thermo Fisher Scientific | Nanodrop 2000 | |
| Syringe pump | Harvard Apparatus | 70-3007 | |
| Teflon tweezers | Rubis | K35A | |
| Tris Base | Promega | H5135 | |
| Ultracentrifuge | Beckman Coulter | Optima L-90K | |
| Ultrafiltration membrane | Millipore | UFC90300 |
References
Loading...
$$\rightleftharpoonup{xx}$$
$$\longleftharp{xx}$$,
$$\longrightharp{xx}$$,
- Moerner, W. E., Fromm, D. P. Methods of single-molecule fluorescence spectroscopy and microscopy. Review of Scientific Instruments. 74 (8), 3597-3619 (2003).
- Ha, T. Single-molecule fluorescence resonance energy transfer. Methods. 25 (1), 78-86 (2001).
- Weiss, S. Fluorescence spectroscopy of single biomolecules. Science. 283 (5408), 1676-1683 (1999).
- Stryer, L. Fluorescence energy transfer as a spectroscopic ruler. Annual Review of Biochemistry. 47, 819-846 (1978).
- Roy, R., Hohng, S., Ha, T. A practical guide to single-molecule FRET. Nature Methods. 5 (6), 507-516 (2008).
- Walter, N. G., Huang, C. Y., Manzo, A. J., Sobhy, M. A. Do-it-yourself guide: how to use the modern single-molecule toolkit. Nature Methods. 5 (6), 475-489 (2008).
- Conchello, J. A., Lichtman, J. W. Optical sectioning microscopy. Nature Methods. 2 (12), 920-931 (2005).
- Axelrod, D. Total internal reflection fluorescence microscopy in cell biology. Methods in Enzymology. 361, 1-33 (2003).
- Kim, H. D., et al. Mg2+-dependent conformational change of RNA studied by fluorescence correlation and FRET on immobilized single molecules. Proceedings of the National Academy of Sciences of the United States of America. 99 (7), 4284-4289 (2002).
- Lee, T. H., et al. Measuring the folding transition time of single RNA molecules. Biophysical Journal. 92 (9), 3275-3283 (2007).
- Holliday, R. Mechanism for Gene Conversion in Fungi. Genetical Research. 5 (2), 282-304 (1964).
- West, S. C., et al. The Formation and Resolution of Holliday Junctions during the Recombinational Repair of DNA Damages. Journal of Cellular Biochemistry. , 269-269 (1995).
- Cox, M. M., et al. The importance of repairing stalled replication forks. Nature. 404 (6773), 37-41 (2000).
- West, S. C. Molecular views of recombination proteins and their control. Nature Reviews: Molecular Cell Biology. 4 (6), 435-445 (2003).
- Duckett, D. R., et al. The structure of the Holliday junction, and its resolution. Cell. 55 (1), 79-89 (1988).
- Clegg, R. M., et al. Fluorescence resonance energy transfer analysis of the structure of the four-way DNA junction. Biochemistry. 31 (20), 4846-4856 (1992).
- McKinney, S. A., Declais, A. C., Lilley, D. M., Ha, T. Structural dynamics of individual Holliday junctions. Nature Structural Biology. 10 (2), 93-97 (2003).
- Joo, C., McKinney, S. A., Lilley, D. M., Ha, T. Exploring rare conformational species and ionic effects in DNA Holliday junctions using single-molecule spectroscopy. Journal of Molecular Biology. 341 (3), 739-751 (2004).
- Hyeon, C., Lee, J., Yoon, J., Hohng, S., Thirumalai, D. Hidden complexity in the isomerization dynamics of Holliday junctions. Nature Chemistry. 4 (11), 907-914 (2012).
- Ip, S. C., et al. Identification of Holliday junction resolvases from humans and yeast. Nature. 456 (7220), 357-361 (2008).
- Rass, U., et al. Mechanism of Holliday junction resolution by the human GEN1 protein. Genes & Development. 24 (14), 1559-1569 (2010).
- Liu, Y., et al. Crystal Structure of a Eukaryotic GEN1 Resolving Enzyme Bound to DNA. Cell Reports. 13 (11), 2565-2575 (2015).
- Chan, Y. W., West, S. GEN1 promotes Holliday junction resolution by a coordinated nick and counter-nick mechanism. Nucleic Acids Research. 43 (22), 10882-10892 (2015).
- van Gool, A. J., Hajibagheri, N. M., Stasiak, A., West, S. C. Assembly of the Escherichia coli RuvABC resolvasome directs the orientation of holliday junction resolution. Genes & Development. 13 (14), 1861-1870 (1999).
- Lee, S. H., et al. Human Holliday junction resolvase GEN1 uses a chromodomain for efficient DNA recognition and cleavage. eLife. 4, (2015).
- Chan, Y. W., West, S. C. Spatial control of the GEN1 Holliday junction resolvase ensures genome stability. Nature Communications. 5, 4844(2014).
- Liu, Y., Freeman, A. D., Declais, A. C., Lilley, D. M. J. A monovalent ion in the DNA binding interface of the eukaryotic junction-resolving enzyme GEN1. Nucleic Acids Research. 46 (20), 11089-11098 (2018).
- Zhou, R., et al. Junction resolving enzymes use multivalency to keep the Holliday junction dynamic. Nature Chemical Biology. 15 (3), 269-275 (2019).
- Bellendir, S. P., et al. Substrate preference of Gen endonucleases highlights the importance of branched structures as DNA damage repair intermediates. Nucleic Acids Research. 45 (9), 5333-5348 (2017).
- Sobhy, M. A., et al. Resolution of the Holliday junction recombination intermediate by human GEN1 at the single-molecule level. Nucleic Acids Research. 47 (4), 1935-1949 (2019).
- Sobhy, M. A., et al. Versatile single-molecule multi-color excitation and detection fluorescence set-up for studying biomolecular dynamics. Review of Scientific Instruments. 82 (11), 113702(2011).
- Kapanidis, A. N., et al. Fluorescence-aided molecule sorting: analysis of structure and interactions by alternating-laser excitation of single molecules. Proceedings of the National Academy of Sciences of the United States of America. 101 (24), 8936-8941 (2004).
- Lee, N. K., et al. Accurate FRET measurements within single diffusing biomolecules using alternating-laser excitation. Biophysical Journal. 88 (4), 2939-2953 (2005).
- Rashid, F., et al. Initial state of DNA-Dye complex sets the stage for protein induced fluorescence modulation. Nature Communications. 10 (1), 2104(2019).
- Sambrook, J., Russell, D. W. Standard ethanol precipitation of DNA in microcentrifuge tubes. Cold Spring Harbor Protocols. 2006 (1), (2006).
- Holden, S. J., et al. Defining the limits of single-molecule FRET resolution in TIRF microscopy. Biophysical Journal. 99 (9), 3102-3111 (2010).
- Bronson, J. E., Fei, J., Hofman, J. M., Gonzalez, R. L. Jr, Wiggins, C. H. Learning rates and states from biophysical time series: a Bayesian approach to model selection and single-molecule FRET data. Biophysical Journal. 97 (12), 3196-3205 (2009).
- Kou, S. C., Cherayil, B. J., Min, W., English, B. P., Xie, X. S. Single-molecule Michaelis-Menten equations. Journal of Physical Chemistry B. 109 (41), 19068-19081 (2005).
- Clegg, R. M., Murchie, A. I., Lilley, D. M. The solution structure of the four-way DNA junction at low-salt conditions: a fluorescence resonance energy transfer analysis. Biophysical Journal. 66 (1), 99-109 (1994).
- Pohler, J. R., Duckett, D. R., Lilley, D. M. Structure of four-way DNA junctions containing a nick in one strand. Journal of Molecular Biology. 238 (1), 62-74 (1994).
- Fogg, J. M., Lilley, D. M. Ensuring productive resolution by the junction-resolving enzyme RuvC: large enhancement of the second-strand cleavage rate. Biochemistry. 39 (51), 16125-16134 (2000).
- Sobhy, M. A., Joudeh, L. I., Huang, X., Takahashi, M., Hamdan, S. M. Sequential and multistep substrate interrogation provides the scaffold for specificity in human flap endonuclease 1. Cell Reports. 3 (6), 1785-1794 (2013).
- Rashid, F., et al. Single-molecule FRET unveils induced-fit mechanism for substrate selectivity in flap endonuclease 1. eLife. 6, e21884(2017).
- Zaher, M. S., et al. Missed cleavage opportunities by FEN1 lead to Okazaki fragment maturation via the long-flap pathway. Nucleic Acids Research. 46 (6), 2956-2974 (2018).
- Didenko, V. V. DNA probes using fluorescence resonance energy transfer (FRET): designs and applications. BioTechniques. 31 (5), 1106-1116 (2001).
- Toseland, C. P. Fluorescent labeling and modification of proteins. Journal of Chemical Biology. 6 (3), 85-95 (2013).
- Aitken, C. E., Marshall, R. A., Puglisi, J. D. An oxygen scavenging system for improvement of dye stability in single-molecule fluorescence experiments. Biophysical Journal. 94 (5), 1826-1835 (2008).
- Swoboda, M., et al. Enzymatic oxygen scavenging for photostability without pH drop in single-molecule experiments. ACS Nano. 6 (7), 6364-6369 (2012).
Reprints and Permissions
Request permission to reuse the text or figures of this JoVE article
Request Permission