

Summary
This protocol uses G6PI mixed peptides to construct rheumatoid arthritis models that are closer to that of human rheumatoid arthritis in CD4+ T cells and cytokines. High purity invariant natural killer T cells (mainly iNKT2) with specific phenotypes and functions were obtained by in vivo induction and in vitro purification for adoptive immunotherapy.
Abstract
Rheumatoid arthritis (RA) is a complex chronic inflammatory autoimmune disease. The pathogenesis of the disease is related to invariant natural killer T (iNKT) cells. Patients with active RA present fewer iNKT cells, defective cell function, and excessive polarization of Th1. In this study, an RA animal model was established using a mixture of hGPI325-339 and hGPI469-483 peptides. The iNKT cells were obtained by in vivo induction and in vitro purification, followed by infusion into RA mice for adoptive immunotherapy. The in vivo imaging system (IVIS) tracking revealed that iNKT cells were mainly distributed in the spleen and liver. On day 12 after cell therapy, the disease progression slowed down significantly, the clinical symptoms were alleviated, the abundance of iNKT cells in the thymus increased, the proportion of iNKT1 in the thymus decreased, and the levels of TNF-α, IFN-γ, and IL-6 in the serum decreased. Adoptive immunotherapy of iNKT cells restored the balance of immune cells and corrected the excessive inflammation of the body.
Introduction
Rheumatoid arthritis (RA) is an autoimmune disease characterized by chronic, progressive invasiveness with 0.5–1% incidence1,2. The underlying pathogenesis is attributed to the abnormal proliferation of autoreactive CD4+ and CD8+ T cells, manifested by an increase in the proportion of CD4+IFN-γ+ and CD4+IL-17A+ T cells, and the reduced number of CD4+IL-4+ and CD4+CD25+FoxP3+ T cells. Therefore, the secretion of inflammatory cytokines is increased, and an excessive inflammatory reaction destroys the native balance and tolerance function of the body's immune system. Moreover, the helper T lymphocyte (Th) 1 cells that penetrate the joint aggravate the inflammatory response and joint damage. Therefore, the inhibition of excessive inflammatory response and restoration of immune tolerance and immune balance are key to the treatment of RA3,4.
The iNKT cells have both NK cell and T cell functions and characteristics. The iNKT cells harbor a distinct, invariant T cell receptor (TCR) α-chain with limited TCR β-chain repertoires5 and recognize the glycolipid antigen presented by the major histocompatibility complex (MHC) class I molecule CD1d on the surface of the antigen-presenting cells. Mitsuo et al.6 detected a large number of iNKT cells and functional defects in many autoimmune diseases, including RA. Aurore et al.7 demonstrated that iNKT cells have a positive effect on maintaining autoimmune tolerance and that when the number and function of iNKT cells are restored, the disease is alleviated. In addition, Miellot-Gafsou et al.8 found that iNKT cells not only abrogated the disease but also increased the progression of the disease. These contradictory results suggest that iNKT cells are heterogeneous T cells, and the function of different subsets may be reversed. In a clinical study of RA, the frequency of iNKT cells correlated with the score of the disease activity9. The results also confirmed that the frequency of iNKT was decreased in RA patients, the number of CD4+IFN-γ+ T cell subsets increased, and the secretory levels of inflammatory cytokines IFN-γ and TNF-α increased10,11. In addition, Sharif et al.12 investigated type 1 diabetes (T1D) and found that selective infusion of iNKT cells upregulated the expression of the inflammatory cytokine IL-4, maintained immune tolerance, and prevented the development of type 1 diabetes. Therefore, adoptive infusion of specific iNKT cells or targeted activation of iNKT cells increases the level of iNKT cells in RA patients, which can be a breakthrough in RA treatment.
Cellular immunotherapy is currently of great interest and has been widely used in cancer therapy. However, iNKT cells are rare, heterogeneous immunoregulatory cells (only 0.3% of the total number of PBMCs)13, which limits potential clinical applications. These cells are mainly divided into three subpopulations: 1) iNKT1 cells, which have a high expression of promyelocytic leukemia zinc-finger protein (PLZF) and T-box transcription factor (T-bet); 2) iNKT2 cells with intermediate expression of PLZF and GATA binding protein 3 (GATA3); 3) iNKT17 cells with low expression of PLZF and retinoid-related orphan nuclear receptor (ROR)-γt that secrete IFN-γ, IL-4, and IL-1714. Activated iNKT cells secrete Th1, Th2, and Th17-like cytokines, which determine the different immunomodulatory effects of iNKT cells15. The immunomodulatory and immunotherapeutic effects of specific activation of various subpopulations of iNKT cells are different. Therefore, the selection of specific phenotypes of iNKT cells (mainly iNKT2) with anti-inflammatory functions to regulate the immune response of the body can correct the immune imbalance and immune disorders in RA.
The establishment of an ideal animal model is of great significance for the treatment and study of RA pathogenesis. Presently, the most commonly used and mature animal models include collagen-induced arthritis, adjuvant arthritis, zymosan-induced arthritis, and polysaccharide-induced arthritis16–17. However, there is no model that can fully simulate all the features of human RA. Type II collagen-induced arthritis (CIA) is a classic arthritis model. The CIA is induced by immunization of mice with type II collagen-specific monoclonal antibodies, reflecting the antibody dependence of this disease model. Benurs et al. described a model with a systemic immune response to glucose-6-phosphate isomerase (G6PI), which induces peripheral symmetric polyarthritis in susceptible mouse strains18,19. In this model, the development of arthritis depends on T cells, B cells, and innate immunity18,19,20. Horikoshi21 found that RA models resulting from immunization of DBA/1 mice with G6PI polypeptide fragments are more similar to human RA in terms of CD4+ T cells and cytokines (i.e., IL-6 and TNF-α) than the CIA models. In order to increase the stimulating effect on the TCR recognition site, the mixed polypeptide fragments of G6PI (hGPI325-339 and hGPI469-483) were used to immunize DBA/1 mice to construct the RA mouse model. The success rate of this approach can high because hGPI325-339 and hGPI469-483 are immunodominant for I-A q-restricted T cell responses. Therefore, this model can simulate the overproliferation of CD4+ T cells and iNKT cell defects in RA patients22. The basic research of RA immunopathology laid the foundation for our further in-depth investigation.
Subscription Required. Please recommend JoVE to your librarian.
Protocol
All experimental mice (150 in total) were healthy male DBA/1 mice, 6–8 weeks old (20.0 ± 1.5 g), reared in a specific pathogen-free (SPF) environment. There is no special treatment before modeling. The experiment was divided into a healthy control group (15 mice), a model control group (15 mice), and a cell therapy group (55 mice). This study was approved by the Animal Welfare and Ethical Committee of Hebei University.
1. Constructing the Disease Model
- Duplicating the RA animal model
- Weigh 1.75 mg of both hG6PI 325-339 and hG6PI 469-483 fragments and dissolve them in 5.25 mL of 4 °C triple distilled water.
- Dissolve complete Freund's adjuvant (CFA) in a 50 °C water bath, draw 5.25 mL into another 10 mL centrifuge tube, and cool it for use.
- Put the mixture of hG6PI solution and CFA solution in an artificial emulsification unit with two glass syringes connected.
- Push the syringe at a constant speed and frequency of 10–20x per min to completely emulsify the mixed peptide solution and CFA solution. Perform the operation in an ice bath, and keep the emulsion droplets in the water for 10 min after the completion of the emulsification without dispersing.
- Inject 150 µL of emulsified hG6PIs into the mouse's tail root subcutaneously.
- Inject 200 mg of Pertussis toxin into the mouse intraperitoneally at 0 h and 48 h after the hG6PI injection.
- Experimental verification of the RA model
- Measure the thickness of the mouse's paw with a Vernier caliper (2x a day).
- Observe and mark the degree of redness and swelling of the foot. Use the following scoring criteria: 1) toes with mild swelling; 2) dorsum pedis and foot pad with clear red swelling; 3) ankle with red swelling.
- Euthanize the mice under deep anesthesia by intraperitoneal injection of 1% sodium pentobarbital (50 mg/kg body weight) 14 days after modeling and remove the paws for HE staining.
- Determine the secretion levels of serum IL-2, IL-4, IL-6, IL-10, IL-17A, TNF-α, and IFN-γ using a commercial cytometric bead array (CBA) assay according to the manufacturer's protocol.
2. Obtaining iNKT Cells with Adoptive Cellular Therapy
- Directional induction of iNKT cells
- Inject normal mice intraperitoneally with α-GalCer (0.1 mg/kg of body weight).
- Isolation of iNKT cells
- Three days after modeling, inject mice intraperitoneally with 1% sodium pentobarbital (50 mg/kg of body weight) for anesthetization. Adequately anesthetized mice do not show a hind paw withdrawal response to a toe pinch.
- Isolate the spleen of a DBA/1 mouse after injecting it intraperitoneally with α-GalCer. Prepare a single cell suspension by cutting and grinding the spleen in a 200 mesh sieve.
- Wash the cell suspension with PBS, centrifuge at 200 x g for 5 min, and discard the supernatant. Repeat.
- Resuspend the cells with 1 mL of whole blood and tissue dilution solution. Add 3 mL of mouse lymphocyte separation medium, and then centrifuge the cells for 20 min at 300 x g at room temperature.
- Collect the layer of milky white lymphocytes (i.e., the second layer from the top), wash it 2x with PBS, and count with an automated cell counter.
- Magnetic activated cell sorting (MACS)positive selection strategy for purification of iNKT cells
NOTE: For the pretreatment of CD1d tetramers, 1 mg/mL of α-Galcer was diluted to 200 μg/mL with 0.5% of Tween-20 and 0.9% of NaCl, and 5 µL of the resulting solution was added to 100 µL of the CD1d tetramer solution. The mixture was incubated for 12 h at room temperature and placed at 4 °C for use. TCR β was diluted 80x with deionized water. All other antibodies were used as a stock solution.- Resuspend 107 cells with 100 µL of 4 °C PBS, add 10 µL of α-GalCer-loaded CD1d Tetramer-PE, and incubate them at 4 °C for 15 min in the dark.
- Wash the cells 2x with PBS and resuspend them in 80 µL of PBS.
- Add 20 µL of anti-PE-MicroBeads and incubate them at 4 °C for 20 min in the dark.
- Wash them 2x with PBS and resuspend the cells with 500 µL of PBS.
- Place the sorting column in the magnetic field of the MACS sorter and rinse with 500 µL of PBS.
- Add the cell suspension from step 2.3.4 to the sorting column, collect the flowthrough, and rinse 3x with PBS buffer.
- Remove the magnetic field and collect the cells from the sorting column. At this point, add 1 mL of PBS buffer to the sorting column, and quickly push the plunger at a constant pressure to drive the labeled cells to the collection tube and obtain purified iNKT cells. Count with an automated cell counter.
- Identification of the iNKT cell phenotype
- Take 1 x 10⁶ cells from steps 2.2.5 and 2.3.7, respectively, and resuspend them in 50 µL of PBS.
- Antibody incubation: Do not add the antibody to the negative control tube, add 0.5 µL of α-GalCer-PE-CD1d Tetramer or 10 µL of FITC-TCR β in the single positive control tube. Add 0.5 µL of α-GalCer-PE-CD1d tetramer and 10 µL of FITC-TCR β in the sample tube. Incubate them at 4 °C for 30 min in the dark.
- Wash the cells in PBS and then centrifuge at 200 x g for 5 min.
- Discard the supernatant, add 1 mL of Foxp3 Foxation/Permeabilization working solution, and incubate the cells for 45 min at 4 °C in the dark.
- Add 1 mL of 1x Permeabilization Buffer working solution and centrifuge the cells at room temperature for 500 x g at room temperature for 5 min.
- Discard the supernatant. Add 1 μL of Alexa Fluor 647 mouse Anti-PLZF and 1 μL of PerCP-Cy 5.5 mouse anti-T-bet (or 1 μL of PerCP-Cy 5.5 mouse anti-RORΥt) for 30 min at room temperature in the dark.
- Add to 2 mL of Permeabilization Buffer working solution for cleaning.
- Discard the supernatant, resuspend the cells in 500 µL of PBS, and measure by flow cytometry.
- Functional identification of iNKT cells
- Take 3 x 10⁶ iNKT cells from step 2.3.7 and resuspend them in 12 well plates with 1.5 mL of RPMI-1640 incomplete medium (i.e., without serum).
- Add phorbol ester (PMA, 50 ng/mL) and ionomycin calcium (IO, 1 μg/mL) and place in a CO2 incubator for 24 h.
- Collect the cell supernatant and detect the secretion levels of IL-2, IL-17A, TNF-α, IL-6, IL-4, IFN-γ, and IL-10 using a commercial CBA assay according to the manufacturer's protocol.
- Experimental study on the migration pathway of iNKT cells in RA mice
- Dissolve DiR dye (2.5 mg/mL) in DMSO.
- Resuspend iNKT cells in 6 well plates with RPMI-1640 incomplete medium. The density is 1 × 10⁶ cells/mL.
- Add DiR (5 μg/mL) solution and incubate in a CO2 incubator for 25 min.
- Wash with PBS and resuspend the cells (3 x 10⁶/300 µL) to obtain DiR-labeled iNKT cells (DiR-iNKT).
- Inject 1% sodium pentobarbital (50 mg/kg body weight) intraperitoneally to anesthetize the mice. Adequately anesthetized mice do not show a hind paw withdrawal to toe pinch. Apply veterinary ointment to the mouse eyes to prevent dryness while under anesthesia for imaging.
- Inject DiR-iNKT cells 3 x 10⁶ per mouse into the tail vein with the RA model for 8 days. Monitor the iNKT cells in mice postinjection for 0 min, 10 min, 30 min, 60 min, and day 0 (after 3 h), 1, 3, 6, 12, 26, 34, 38, and 42 days using a small animal in vivo imaging system (IVIS). The excitation wavelength used was 748 nm, the emission wavelength was 780 nm, and the exposure time was automatic.
- Place each mouse in a separate cage after each observation and maintain sternal recumbency. Observe until recovery from anesthesia.
3. Evaluation of Adoptive Immunotherapy of RA Mice with iNKT Cells
- iNKT cell adoptive immunotherapy for RA mice
- Inject 3 x 10⁶ cells iNKT cells per mouse through the tail vein. Randomly select 15 mice that were modeled 8 days prior and obtain iNKT cells without DiR labeling from step 2.3.7 by the tail vein infusion.
- Evaluate the efficacy of adoptive immunotherapy for iNKT cells.
- Measure the thickness of the paw of the mouse, quantify the swelling of the ankle joint, and systematically score after the infusion of iNKT cells as described in steps 1.2.1–1.2.2.
- Observe the inflammatory cell infiltration and joint changes of the mouse joints as described in step 1.2.3.
- Determine the secretion levels of IL-2, IL-4, IL-6, IL-10, IL-17A, TNF-α, and IFN-γ as described in step 1.2.4.
- Determine the frequency of iNKT cells and subsets.
- Isolate the mouse thymus and prepare a single cell suspension.
- Separate the lymphocytes with lymphocyte separation fluid.
- Determine the iNKT cell frequency and subgroup frequency as described in step 2.4.
- Statistical analysis
NOTE: All data are presented as mean ± SD. Values of P < 0.05 were considered statistically significant.- Use one-factor analysis of variance (ANOVA). If the variance is satisfied, use the LSD test for further comparison.
- If the variance is not uniform, use the nonparametric test. Use the Kruskal-Wallis H test for further comparison31.
Subscription Required. Please recommend JoVE to your librarian.
Representative Results
The arthritis index score and paw thickness increased after modeling. Compared with the control group, the toes of the RA model group began to show red swelling at 6 days after modeling, with gradual aggravation. At 14 days, the red swelling in the ankle joint peaked, followed by gradual relief. The thickness of the paw changed similarly (P < 0.05) (Figure 1).
The inflammatory cell infiltration increased significantly after modeling. The pathological results showed that the infiltration degree of inflammatory cells in the ankle synovial tissue of the RA model mice was different at different stages. Peak inflammation occurred on day 14 post modeling (Figure 2).
Inflammatory cytokines increased and anti-inflammatory cytokines decreased in the serum. In the RA model group, the serum levels of pro-inflammatory cytokines (TNF-α, IFN-γ, and IL-6) significantly increased (P < 0.05), while anti-inflammatory cytokines (IL-4 and IL-10) significantly decreased (P < 0.05) (Figure 3).
The iNKT cells obtained by in vivo induction and in vitro purification mainly consisted of iNKT2 cell subsets, which secrete anti-inflammatory cytokines. Intraperitoneal injection of α-GalCer increased the frequency of iNKT cells in the body, predominantly the iNKT2 subgroup. The frequency of spleen iNKT cells in normal DBA/1 mice was about 2% of the lymphocytes, (iNKT2 was about 5%, iNKT1 about 15%, iNKT17 about 10%). Three days after the intraperitoneal injection of α-GalCer, the frequency of iNKT cells was about 6% of the lymphocytes, (iNKT2 was about 82%, iNKT1 about 1.5%, and iNKT17 about 0.5%). After purification by MACS, the purity of iNKT cells was over 85%, of which iNKT2 was about 92%, iNKT1 about 0.4%, and iNKT17 about 0.2% (Figure 4).
The harvested iNKT cells secreted more anti-inflammatory cytokines and fewer inflammatory cytokines. The iNKT cells were isolated from the spleens of normal mice and intraperitoneally injected with α-GalCer 3 days after the mouse spleen (α-GalCer group) and the cytokine levels in the cell culture supernatant were examined. Compared with the control group, the inflammatory cytokines (IL-17A, TNF-α, IFN-γ, and IL-6) of the α-GalCer group significantly decreased (P < 0.05), and the anti-inflammatory cytokine IL-4 level significantly increased (P < 0.05). There was no significant difference in IL-10 (P > 0.05). The IFN-γ/IL-4 ratio significantly decreased (P < 0.05) (Figure 5).
IVIS tracing confirmed that DiR-iNKT cells were adoptively infused into RA mice and immediately appeared in the lungs postinjection. Fluorescence was detected in the liver at 10 min and in the spleen at 60 min (Figure 6AI, 6AII, 6AIII). In the isolated organs, there was no fluorescence in the thymus and inguinal lymph nodes within 1 h. Fluorescence was detected in the lungs at 0 min, the fluorescence intensity was the greatest at 10 min, and then gradually weakened. There was weak fluorescence in the liver at 0 min, and then it gradually increased. The fluorescence in the spleen was detected at 30 min and then gradually increased (Figure 6AIV, 6C).
After the infusion of DiR-iNKT cells into RA mice, fluorescence was mainly concentrated in the liver and spleen (Figure 6BI, 6BII, 6BIII), but there was no fluorescence in the thymus and inguinal lymph nodes. The spleen and liver had the highest fluorescence intensity on day 1 after cell infusion, but it gradually weakened. On day 34, the surface fluorescence disappeared. On day 42, the fluorescence of the isolated organs disappeared. The average fluorescence signal intensity of liver after the cell infusion was higher than that of the spleen (Figure 6BIV, 6D).
Adoptive infusion of iNKT cells into RA mice can alleviate disease progression and improve clinical symptoms. The iNKT cells improved the clinical symptoms of RA mice after adoptive infusion. Compared with the untreated RA model group, the swelling of the ankle joint was relieved in the cell treatment group, and the scores significantly decreased from day 10 to day 20 postinjection. In the same period in the cell treatment group, inflammatory cell infiltration in the synovial tissue was reduced in comparison to the RA model group (Figure 2).
The success rates of thymus iNKT cells increased significantly (P < 0.05). Compared with the healthy control group, in the RA model group the rates of iNKT cells in the thymus decreased at the progress (day 11), peak (day 14), and recovery (day 20) stages. At peak inflammation, these values were minimal and rebounded in the remission phase. The cell therapy group showed significantly increased rates of iNKT cells at the peak (day 14) and recovery (day 20) stages in comparison with the RA model group (P < 0.05) (Figure 7).
After iNKT cell infusion, the success rate of iNKT1 and iNKT17 in the thymus decreased and iNKT2 increased. Compared to the control group, in the RA model group on day 11 iNKT1 and iNKT17 in the thymus significantly increased (P < 0.05), and iNKT2 significantly decreased (P < 0.05). On day 14, iNKT1 and iNKT2 in the thymus significantly increased (P< 0.05) and iNKT17 significantly decreased (P< 0.05). On day 20, iNKT1 in the thymus significantly increased (P < 0.05), iNKT2 did not significantly change (P > 0.05), and iNKT17 significantly decreased (P < 0.05). The iNKT1/iNKT2 ratio significantly increased during all three stages (P < 0.05).
Compared to the RA model group, on day 11 in the α-GalCer and the cell therapy groups, iNKT1 and iNKT17 were significantly lower (P < 0.05) and iNKT2 significantly increased (P < 0.05). On day 14, in the α-GalCer group iNKT1 and iNKT17 significantly decreased (P < 0.05), and iNKT2 did not significantly change (P > 0.05); in the cell therapy group iNKT1 and iNKT17 significantly decreased (P < 0.05) and iNKT2 significantly increased (P < 0.05). On day 20, in the α-GalCer group the iNKT1 significantly decreased (P < 0.05), iNKT2 did not change significantly (P > 0.05), and iNKT17 significantly increased (P < 0.05); in the cell therapy group iNKT1 and iNKT17 significantly decreased (P < 0.05) and iNKT2 significantly increased (P < 0.05). The ratio of iNKT1/iNKT2 significantly decreased during all three stages (P < 0.05) (Figure 7).
The levels of inflammatory cytokines were increased in serum and the anti-inflammatory cytokines were decreased after iNKT cell infusion. In the RA model group, the levels of TNF-α, IFN-γ, and IL-6in serum significantly increased (P < 0.05), while IL-4 and IL-10 showed markedly decreased amounts (P < 0.05) in comparison with the control group. In the iNKT cell therapy group, the levels of TNF-α, IFN-γ, and IL-6 in serum significantly decreased at the progress and peak stages of inflammation (P < 0.05), while IL-4 and IL-10 significantly increased (P < 0.05) in comparison with the RA model group (Figure 3).
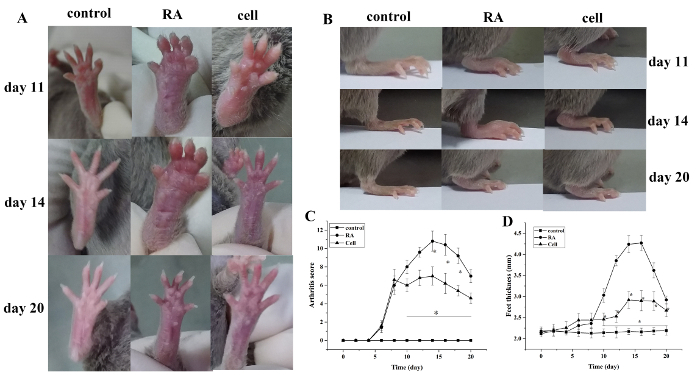
Figure 1: The joint swelling score and paw thickness change in mice. (A) Swelling of the ankle joint in mice. (B,D) Paw thickness in different groups. (C) Clinical score changes in different groups. The mouse arthritis score and the thickness of the paw were significantly reduced in the cell therapy group on days 10–20 (i.e., 2–12 days after treatment) after modeling. *P < 0.05 vs. control, **P < 0.05 vs. RA. Please click here to view a larger version of this figure.

Figure 2: Histopathological changes of the ankle joint. The infiltration of inflammatory cells was significantly reduced in the cell therapy group and was significantly increased in the RA group on day 14. ◊ = inflammatory cells. (A) 100x (B) 400x. Please click here to view a larger version of this figure.

Figure 3: The levels of serum cytokines in each group. (A) Serum cytokines levels in mice on day 11 after modeling (pg/mL). (B) Serum cytokines levels in mice on day 14 after modeling (pg/mL). The levels of TNF-α, IFN-γ, and IL-6 significantly decreased, and the levels of IL-4 and IL-10 significantly increased in the cell therapy group. aP < 0.05 vs. control. bP < 0.05 vs. RA. Please click here to view a larger version of this figure.

Figure 4: The rates of iNKT cells and proportion of iNKT cell subsets. (A,B,C) The rate of iNKT2 in normal mice is ~5%. (D,E,F) The rate of iNKT2 is about 82% after in vivo induction. (G, H, I) The rate of iNKT2 is more than 92% after MACS purification. Please click here to view a larger version of this figure.

Figure 5: Cytokine levels in culture supernatant of mouse spleen-derived iNKT cells. The level of IL-4 significantly increased, and the levels of IL-17A, TNF-α, IFN-γ, and IL-6 significantly decreased. aP < 0.05 vs. control. Please click here to view a larger version of this figure.

Figure 6: Distribution and metabolism of iNKT cells traced by caliper IVIS lumina II. (A,B) Migration path of iNKT cells. (C) The change of the average fluorescence signal intensity in the spleen, liver, and lung. (D) The change of the average fluorescence signal intensity in the spleen and liver. The fluorescence was detected in the lungs and liver at 0 min, and then gradually increased. The fluorescence intensity was strongest at 10 min in the lungs and then decreased. The fluorescence of the spleen was detected at 30 min, then gradually increased. The fluorescence of all organs disappeared on day 42. The average fluorescence signal intensity of the liver is higher than the spleen after cell infusion (I: supine; II: lateral lying; III: prone; IV: isolated tissue; a: control group; b: cell infusion group; 1, 2, 3, 4, 5 are thymus, spleen, liver, inguinal lymph nodes, lungs). Please click here to view a larger version of this figure.

Figure 7: The rates of iNKT and its subsets in the mouse thymus. (A) The rates of iNKT cells at 11, 14, and 20 days after modeling. (B) The ratio of iNKT1/iNKT2. (C,D,E) The rate of iNKT1, iNKT2, and iNKT17. On days 11, 14, and 20 (days 3, 6, and 12 after cell therapy), the rates of iNKT cells significantly increased, the iNKT1 and iNKT17 of the thymus significantly decreased in the cell therapy group, and iNKT2 was significantly increased. aP < 0.05 vs Control. bP < 0.05 vs RA. Please click here to view a larger version of this figure.
Subscription Required. Please recommend JoVE to your librarian.
Discussion
iNKT cells are special T cells that bridge innate and adaptive immunity and are mainly developed from CD4++/CD8+ thymocytes. iNKT cells have diverse immunoregulatory functions and interact with other immune cells by direct contact and secretion of different cytokines23, affecting dendritic cells (DCs), macrophages, neutrophils, B cells, T cells, and NK cell differentiation and development24. α-GalCer is a classical iNKT cell-specific activator extracted from sponges. Several studies indicate that spleen iNKT cell frequency reaches a peak after a single intraperitoneal injection of α-GalCer for 3 days25. Our experimental results demonstrated the predominance of the iNKT2 subset in mice spleen for 3 days after an intraperitoneal injection of α-GalCer, which mainly secretes anti-inflammatory cytokines IL-4 and IL-10. We also found that the abundance of iNKT2 cells decreased and that of iNKT1 and iNKT17 cells increased in the RA model mice during the inflammatory phase. Therefore, we isolated the iNKT cells of the mouse spleen by intraperitoneal injection of α-GalCer for 3 days. These were used to treat the RA model mice. The rate of the iNKT2 subset was 82% after in vivo induction. After purification by MACS, the rate of iNKT2 exceeded 92%.
The specific activation of iNKT cells is employed as a novel biological treatment for RA. Horikoshi et al.21 demonstrated that intradermal injection of α-GalCer inhibited GPI peptide-induced arthritis by significantly inhibiting the number of CD4+ T cells. Chiba et al.26 showed that repeated injections of the synthetic iNKT2 selective activator OCH inhibited CIA, while α-GalCer showed a slight inhibitory effect. We injected spleen-derived iNKT into RA model mice, and the results showed that the degree of swelling of the ankle joints in the cell therapy group and the number of inflammatory cells infiltrating into the joints was reduced. The level of serum anti-inflammatory cytokines (e.g., IL-4 and IL-10) increased, and the secretion of pro-inflammatory cytokines (e.g., IFN-γ and TNF-α) decreased. the targeted activation of iNKT cells was able to alleviate the progression of RA and inhibit the inflammatory response. In addition, we detected the frequency of iNKT in the thymus and found that the number of iNKT cells in the RA model group was significantly reduced, while the frequency in the thymus increased after infusion of the iNKT cells. Due to the presence of the blood-thymus barrier system, we did not consider the adoptively infused increase in the level of iNKT in the thymus that was confirmed in later experiments. Further detection of the subpopulations of iNKT cells in the thymus revealed that, compared to the healthy control group, the number of iNKT1 cells in the RA model group increased significantly during the three stages of inflammation and maximally during the peak of inflammation, while the proportion of the iNKT2 subset began to increase at the peak of inflammation. Notably, the iNKT1 subset might be involved in the early inflammation of RA, and the iNKT2 subset may play an important role in inhibiting the inflammation. Compared to the RA model group, the iNKT1 subset in the cell therapy group significantly decreased during the inflammatory phase, and the iNKT2 subset significantly increased in the early and remission stage of inflammation. These results indicated that adoptive infusion of specific phenotypes and functional iNKT cells significantly increased the frequency of iNKT cells in RA and altered the proportion of iNKT cell subsets.
We used IVIS to observe the distribution of iNKT cells in mice after adoptive infusion and found the highest fluorescence intensity in the lungs 10 min after infusion, which faded gradually. The liver showed weak fluorescence, which increased gradually and decreased gradually after 2 days. Fluorescence was detected in the spleen at 30 min, which increased gradually and decreased after 2 days. The average fluorescence intensity of the liver was stronger than that of the spleen. However, no fluorescence was detected in the thymus and inguinal lymph nodes. The detection of fluorescence in the lungs might be attributed to the infusion of iNKT cells into the tail vein. These cells are circulated to the lungs with the blood. The liver fluoresces earlier than the spleen, and the average fluorescence intensity of the liver is stronger than that of the spleen. This preferential accumulation of the iNKT cells may be due to the abundant blood vessels in the liver, the main metabolic organ. Fluorescence was not detected in the thymus. This might be due to the hematological barrier, which could hinder the entry of iNKT cells. Fluorescence was never detected in the inguinal lymph nodes, perhaps because fewer iNKT cells entered the lymph nodes and did not reach the minimum level of detection. Also, it could be speculated that the iNKT cells infused into the tail vein might not enter the lymph nodes. Therefore, we hypothesize that the development and differentiation of iNKT cells in the thymus might be regulated through cytokine pathways after adoptive infusion into the mice. This needs to be elucidated further.
GPI is present in the serum and synovial fluid of most RA patients and is a commonly used test for clinical RA diagnosis27. Bruns et al.28 used peptides of different lengths from the GPI sequence and immunized the DBA/1 mice to identify six immunodominant T cell epitopes. Of these, three were arthritogenic. The peptides with >95% incidence of arthritis are hGPI 325-339 and hGPI469-483. Our previous studies demonstrated that the use of a mixture of the two peptides to establish an RA model is better than a single peptide. In the resulting RA models, the toes and joints of the mice began to appear red on day 6 and reached a peak of inflammation on day 14. The inflammatory cell infiltration was accompanied by tissue hyperplasia in the synovial tissue of the joints, and the inflammatory cell infiltration was most severe at day 14. The number of iNKT cells was decreased significantly in the thymus at the peak of inflammation, which was consistent with the trend of iNKT cells in RA patients29. Further detection of iNKT cell subsets revealed that the frequency of iNKT1 and iNKT17 in the thymus increased and the frequency of iNKT2 decreased during the progression of inflammation (day 11). In addition, the levels of serum cytokines IFN-γ and IL-17A increased during the progression (day 11) and the peak of inflammation (day 14), suggesting a similar polarization of the Th1 and Th17 subgroups in RA model mice30. Therefore, the RA mouse model induced by hGPI325-339 and hGPI469-483 mixed polypeptide fragments exhibited the characteristics of CD4+ T cell hyperproliferation and iNKT cell defects, which was similar to that of the RA patients, and could be used as an ideal animal model for investigating the immunity of the RA cells. These results were in agreement with those from our previous studies and demonstrated the stability of the hGPIs-induced RA model31.
In general, the RA mouse model induced by the mixed G6PI peptides can simulate the changes in CD4+ T cells, iNKT cells, and related cytokines in RA patients. This provides a good model for in-depth investigation of RA. Consecutively, iNKT (mainly iNKT2) induced by intraperitoneal injection of α-GalCer and purified in vitro was used in the treatment of RA. It can correct the immune imbalance caused by abnormal proliferation of Th subsets, relieve the progression of RA, and in the future may provide novel methods for the clinical treatment of RA.
Subscription Required. Please recommend JoVE to your librarian.
Disclosures
The authors declare no funding or conflicts of interest.
Acknowledgments
Our study was supported by the National Natural Science Foundation of China (NSFC) (81771755), Colleges and university's science and technology key research project of Hebei province (ZD2017009) and the Animal Lab of Medical Experiment Center, Hebei University. We are grateful for their support.
Materials
| Name | Company | Catalog Number | Comments |
| Alexa Fluor 647 Mouse Anti-PLZF | BD | 563490 | America |
| Anti-PE MicroBeads | Miltenyi | 130-048-801 | Germany |
| Columns | Miltenyi | MS | Germany |
| Cryogenic Centrifuge | Beckman | Allegra® X-15R | America |
| DiR | Thermo Fisher Scientific | D12731 | America |
| Embedding Center | Tianjin Aviation Electromechanical Co., Ltd. | BMJ-1 | China |
| FITC Hamster Anti-Mouse TCR β Chain | BD | 553170 | America |
| Flow cytometer | BD | Accuri C6 | America |
| Freund's complete adjuvant | Sigma | F5881 | America |
| hGPI325-339 (IWYINCFGCETHAML) | Karebay Biochem | 18062202 | China |
| hGPI469-483 (EGNRPTNSIVFTKLT) | Karebay Biochem | 18062203 | China |
| In Vivo Imaging System | PerkinElmer | caliper IVIS lumina II | America |
| Ionomycin Calcium | Cayman | 10004974 | America |
| KRN7000 | AdipoGen | AG-CN2-0013 | America |
| Mouse CD1d Tetramer-PE | MBL | TS-MCD-1 | Japan |
| Mouse percoll | Solarbio | P8620 | China |
| Optical Microscope | Olympus | Olympus-II | Japan |
| PerCP-CyTM5.5 Mouse anti-ROR-ϒt | BD | 562683 | America |
| PerCP-CyTM5.5 Mouse anti-T-bet | BD | 561316 | America |
| Pertussis toxin | Sigma | P7208 | America |
| phorbol esters | Cayman | 10008014 | America |
| Red Blood Cell Lysis Buffer | BD | 555899 | America |
| RPMI-1640 | Biological Industries | 01-100-1ACS | Israel |
| Th1/Th2/Th17 cytokines kit | BD | 560485 | America |
| Ultramicrotome | Leica | Leica EM UC6 | Germany |
References
- Tobón, G. J., Youinou, P., Saraux, A. The environment, geo-epidemiology, and autoimmune disease: Rheumatoid arthritis. Autoimmunity Reviews. 35 (1), 0-14 (2010).
- Cross, M., et al. The global burden of rheumatoid arthritis: estimates from the Global Burden of Disease 2010 study. Annals of the Rheumatic Diseases. 73 (7), 1316-1322 (2014).
- Kanashiro, A., Bassi, G. S., Queiróz Cunha, F. D., Ulloa, L. From neuroimunomodulation to bioelectronic treatment of rheumatoid arthritis. Bioelectronics in Medicine. 1 (2), 151-165 (2018).
- Brennan, P. J., Brigl, M., Brenner, M. B. Invariant natural killer T cells: an innate activation scheme linked to diverse effector functions. Nature Reviews Immunology. 13 (2), 101-117 (2013).
- Bianca, B. S. Unraveling Natural Killer T-Cells Development. Frontiers in Immunology. 8, 1950 (2018).
- Mitsuo, A., et al. Decreased CD161+CD8+ T cells in the peripheral blood of patients suffering from rheumatic diseases. Rheumatology. 45 (12), 1477-1484 (2006).
- Miellot, A., et al. Activation of invariant NK T cells protects against experimental rheumatoid arthritis by an IL-10-dependent pathway. European Journal of Immunology. 35 (12), 3704-3713 (2005).
- Miellot-Gafsou, A., et al. Early activation of invariant natural killer T cells in a rheumatoid arthritis model and application to disease treatment. Immunology. 130 (2), 296-306 (2010).
- Tudhope, S. J., Delwig, A. V., Falconer, J., Pratt, A., Ng, W. F. Profound invariant natural killer t-cell deficiency in inflammatory arthritis. Annals of the Rheumatic Diseases. 69 (10), 1873-1879 (2010).
- Ming, M., et al. Effects on immunoregulation of iNKT cells in RA by novel synthetic immunostimulator CH1b. Chinese Journal of Immunology. 32 (02), 218-222 (2016).
- Ming, M., et al. Study of the correlation between the percentage of iNKT cells and the ratio of IFN-γ/IL-4 in patients with rheumatoid arthritis. Chinese Journal of Microbiology Immunology. 35 (3), 213-218 (2015).
- Sharif, S., et al. Activation of natural killer T cells by α-galactosylceramide treatment prevents the onset and recurrence of autoimmune Type 1 diabetes. Nature Medicine. 7, 1057-1062 (2010).
- Gapin, L. Development of invariant natural killer T cells. Current Opinion in Immunology. 39, 68-74 (2016).
- Kwon, D. I., Lee, Y. J. Lineage Differentiation Program of Invariant Natural Killer T Cells. Immune Network. 17 (6), (2017).
- Thapa, P., et al. The differentiation of ROR-γt expressing iNKT17 cells is orchestrated by Runx1. Scientific Reports. 7 (1), 7018 (2017).
- Schurgers, E., Billiau, A., Matthys, P. Collagen-induced arthritis as an animal model for rheumatoid arthritis: focuson interferon-γ. Interferon Cytokine Research. 31 (12), 917-926 (2011).
- Van Haalen, H. G. M., Severens, J. L., Tran-Duy, A., Boonen, A. How cost-effectiveness A systematic review and stepwise approach for selecting a transferable health economic evaluation rheumatoid arthritis. Pharmacoeconomics. 32 (5), 429-442 (2014).
- Schubert, D., Maier, B., Morawietz, L., Krenn, V., Kamradt, T. Immunization with glucose-6-phosphate isomerase induces T cell-dependent peripheral polyarthritis in genetically unaltered mice. Journal of Immunology. 172, 4503-4509 (2004).
- Bockermann, R., Schubert, D., Kamradt, T., Holmdahl, R. Induction of a B-cell-dependent chronic arthritis with glucose-6-phosphate isomerase. Arthritis Research, Therapy. 7, 131613-131624 (2005).
- Kamradt, T., Schubert, D. The role and clinical implications of G6PI in experimental models of rheumatoid arthritis. Arthritis Research, Therapy. 7, 20-28 (2005).
- Horikoshi, M., et al. Activation of Invariant NKT Cells with Glycolipid Ligand α-Galactosylceramide Ameliorates Glucose-6-Phosphate Isomerase Peptide-Induced Arthritis. PlosOne. 7 (12), 51215 (2012).
- Zhang, X. J., et al. Immunization with mixed peptides derived from glucose-6-phosphate isomerase induces rheumatoid arthritis in DBA /1 mice. Chinese Journal of Pathophysiology. 32 (3), 569-576 (2016).
- Motohashi, S., Nakayama, T. Invariant natural killer T cell-based immunotherapy for cancer. Immunotherapy. 1 (1), 73 (2017).
- Jung, S., et al. The requirement of natural killer T-cells in tolerogenic APCs-mediated suppression of collagen-induced arthritis. Experimental and Molecular Medicine. 42 (8), 547-554 (2010).
- Luc, V. K., Lan, W. Therapeutic Potential of Invariant Natural Killer T Cells in Autoimmunity. Frontiers in Immunology. 9, 519-526 (2018).
- Chiba, A., et al. Suppression of collagen-induced arthritis by natural killer T cell activation with OCH, a sphingosine-truncated analog of α-galactosylceramide. Arthritis, Rheumatism. 50 (1), 305-313 (2004).
- Tudhope, S. J., Delwig, A. V., Falconer, J., Pratt, A., Ng, W. F. Profound invariant natural killer t-cell deficiency in inflammatory arthritis. Annals of the Rheumatic Diseases. 69 (10), 1873-1879 (2010).
- Bruns, L., et al. Immunization with an immunodominant self-peptide derived from glucose-6-phosphate isomerase induces arthritis in DBA/1 mice. Arthritis Research, Therapy. 11 (4), (2009).
- Parietti, V., et al. Rituximab treatment overcomes reduction of regulatory iNKT cells in patients with rheumatoid arthritis. Clinical Immunology. 134 (3), 331-339 (2010).
- Yoshida, Y., et al. Functional mechanism(s) of the inhibition of disease progression by combination treatment with fingolimod plus pathogenic antigen in a glucose-6-phosphate isomerase peptide-induced arthritis mouse model. Biological, Pharmaceutical Bulletin. 38 (8), 1120-1125 (2015).
- Chen, D., et al. Study of the adoptive immunotherapy on rheumatoid arthritis with Thymus-derived invariant natural killer T cells. International Immunopharmacology. 67, 427-440 (2019).
