Neutrophil extracellular traps (NETs) are three-dimensional structures generated by stimulated neutrophil granulocytes. It has become clear in recent years that NETs are involved in a wide variety of diseases. Detection of NETs in tissue may have diagnostic relevance, so standardized protocols for labelling NET components are required.
Method Article
Immunofluorescence Labelling of Human and Murine Neutrophil Extracellular Traps in Paraffin-Embedded Tissue
In This Article
Summary
Abstract
Neutrophil granulocytes, also called polymorphonuclear leukocytes (PMN) due to their lobulated nucleus, are the most abundant type of leukocytes. They mature in the bone marrow and are released into the peripheral blood, where they circulate for about 6−8 h; however, in tissue, they can survive for days. By diapedesis through the endothelium, they leave the blood stream, enter tissues, and migrate towards the site of an infection following chemotactic gradients. Neutrophils can combat invading microorganisms by phagocytosis, degranulation, and generation of neutrophil extracellular traps (NETs). This protocol will help to detect NETs in paraffin-embedded tissue. NETs are the result of a process called NETosis, which leads to the release of nuclear, granular, and cytoplasmic components either from living (vital NETosis) or dying (suicidal NETosis) neutrophils. In vitro, NETs form cloud-like structures, which occupy a space several times larger than that of the cells from which they descended. The backbone of NETs is chromatin, to which a selection of proteins and peptides originating from granules and cytoplasm are bound. Thereby, a high local concentration of toxic compounds is maintained so that NETs can capture and inactivate a variety of pathogens including bacteria, fungi, viruses, and parasites, while diffusion of the highly active NET components leading to damage in neighboring tissue is limited. Nevertheless, in recent years it has become apparent that NETs, if generated in abundance or cleared insufficiently, do have pathological potential ranging from autoimmune diseases to cancer. Thus, detection of NETs in tissue samples may have diagnostic significance, and the detection of NETs in diseased tissue can influence the treatment of patients. Since paraffin-embedded tissue samples are the standard specimen used for pathological analysis, it was sought to establish a protocol for fluorescent staining of NET components in paraffin-embedded tissue using commercially available antibodies.
Introduction
Neutrophil extracellular traps (NETs) have a complex three-dimensional structure. High resolution scanning-electron microscopic analysis revealed that they consist of smooth fibers with a diameter of 15−20 nm (chromatin) studded with globular domains of >25 nm which presumably consist of an assortment of about 30 granular and cytoplasmic proteins and peptides1,2. When generated in vitro from isolated neutrophils, NETs can be identified by staining of two or more of their components by immunofluorescence (e.g., histones and neutrophil elastase [NE]). In unstimulated polymorphonuclear leukocytes (PMN), histones are located exclusively in the nucleus, while NE is contained in granules. During NETosis, NE enters the nucleus, where it processes histones3,4. NETs are characterized by colocalization of components, which are clearly separated in unstimulated neutrophils. Since currently no antibodies exist that exclusively detect NET specific epitopes (i.e., do not react with naïve neutrophils), detecting colocalization of neutrophil proteins in NETs is the only way to identify NETs.
In tissue, NETs can hardly be detected by conventional histological stains (e.g., by staining with hematoxylin/eosin [H&E], which depicts NETs as a diffuse pale bluish tinge). Only when highly abundant, NETs can clearly be distinguished with H&E staining, such as in thrombi5. Since NETs are diffuse per se, tissue structure has to be preserved optimally, so cryo-preparations that are prone to induce freezing artifacts are suboptimal for analysis of NETs in tissue. Instead, formaldehyde fixation and paraffin embedding has been shown to preserve NET structure in tissue well2. (Immuno-)histological inspection of sections of paraffin-embedded tissue is the standard method for pathological analysis. As tissue in paraffin blocks is conserved even at room temperature (RT), tissue specimens from daily diagnostic work can be compared with specimens that have been prepared years ago, with questions and techniques that have recently arisen. NETs in tissue have not been detected until recently, and detailed analysis of NET formation and removal during the course of diseases may lead to new insights into pathogenesis. The use of paraffin-embedded tissue has the invaluable advantage to allow the analysis of archival material and to conduct retrospective studies6. Undeniably, these benefits come at a cost. Before embedding into paraffin, tissue has to be formaldehyde-fixed, dehydrated and heated above 50 °C. These procedures induce tissue autofluorescence as well as epitope masking.
To limit fixation artifacts, fixation time should be kept to a minimum, so the size of tissue samples should not exceed an area of 20 mm x 30 mm with ~3 mm thickness. Samples of this size are completely fixed after overnight incubation at RT in formaldehyde, ideally followed by direct dehydration and paraffin embedding. Alternatively, fixed samples can be stored for 1 or 2 days in buffer. For immunofluorescence studies, the fixative should be freshly prepared from paraformaldehyde dissolved in a suitable buffer (e.g., phosphate-buffered saline [PBS] or Tris-buffered saline [TBS]). During fixative preparation, the temperature must be kept below 60 °C to prevent formation of formic acid. Formalin, which is a standard fixative for pathology, should not be used since it contains methanol, other aldehydes, ketones, and formic acid. These impurities lead to increased epitope masking and significant tissue autofluorescence.
For successful immunolabelling, epitope masking has to be reverted in a process called antigen retrieval. Tissue sections are heated in a suitable buffer, which is believed to break methylene bridges, so epitopes become accessible to the antibodies7. For detection of NETs, heat-induced epitope retrieval (HIER) is preferred to other methods such as the use of proteolytic enzymes. Routinely, immunolabelling of paraffin sections is carried out with a single antibody followed by a peroxidase-labelled secondary antibody, which is detected with a precipitating substrate. Compared to immunofluorescence, enzyme-based detection methods have a lower spatial resolution due to diffusion of the substrate precipitate, and generally, simultaneous detection of more than one antigen is limited6.
As currently no antibodies exist that exclusively bind to NETs, this protocol is used to label two proteins, histone 2B, which is nuclear, and neutrophil elastase, which is localized in granules. In unstimulated neutrophils, these proteins are separated, but they are colocalized in neutrophils undergoing NETosis and in NETs. The simultaneous detection of two antigens can be achieved with two primary antibodies raised in different hosts and two species-specific secondary antibodies labelled with different fluorochromes. This report is a standardization of our previously published protocol8 and uses a combination of two commercially available antibodies that reliably stain NET components in paraffin-embedded tissue, both fresh and archival, of human and murine origin.
Protocol
Tissue protocols were approved by Landesamt für Gesundheit und Soziales, Berlin, Germany (G0121/16). Experiments were conducted in accordance with the European directive 2010/63/EU on Care, Welfare and Treatment of Animals.
1. Fixation, dehydration, paraffin embedding, sectioning, mounting of sections
- Prepare 2% formaldehyde solution by dissolving paraformaldehyde in TBS (pH 7.4). Avoid heating above 60 °C. Cool to RT. Formaldehyde solution can be stored at -20 °C.
- Place fresh tissue (here: mouse lung) into a glass Petri dish with TBS. With a scalpel, dissect into pieces not exceeding 20 mm x 30 mm x 3 mm in size. Immerse specimen into 2% formaldehyde solution in TBS.
NOTE: The volume of fixative should be at least 20x that of the tissue. - Fix at RT for 8−20 h. Transfer specimens to TBS. Place into cassettes.
- Dehydrate using a series of ethanol (70%, 80%, 90%, 96%, 100%, 100%), with each step lasting 1 h.
- Clear specimens 2x in 100% xylene (dimethylbenzene), each step 1 h.
- Soak in paraffin 2x at 60 °C (melting temperature 54−56 °C), each step 1 h.
- Mount specimens using embedding molds, use the cassette bottom as a cover.
- Let paraffin solidify and remove embedding molds.
- Prepare 3 µm tissue sections, and let them float on 37 °C water bath.
- Float sections on water surface onto adhesive glass slides (Table of Materials).
- Incubate sections on glass slides overnight at 40 °C to bond the tissue to the glass.
2. Rehydration, heat-induced epitope retrieval, staining, mounting, microscopic analysis
- Place sections on glass slides in racks and submerse them into the media used for dehydration and clearing, in reverse order, with each step for 5 min: 2x 100% xylene, ethanol series (2x 100%, 96%, 90%, 80%, 70%).
- Heat a water bath with a temperature-controlled hot plate to 70 °C. Place a jar filled with heat-induced epitope retrieval (HIER)-buffer (pH 9; Table of Materials), containing 10% glycerol as a temperature buffer, into a water bath. When the HIER buffer has reached 70 °C, place the rack with slides into buffer jar.
- Incubate slides for 120 min at 70 °C.
- Remove the jar from the water bath and let it cool to RT. Rinse sections 3x with deionized water and once with TBS (pH 7.4).
- Carefully remove liquid from slides between sections with rolled filter paper or cotton swab, leaving sections hydrated.
- Create barrier around sections with a hydrophobic barrier pen.
- Incubate sections in blocking buffer (1% bovine serum albumin [BSA], 2% normal donkey serum, 5% cold water fish gelatin and detergents [Table of Materials] in TBS) at RT for 30 min to prevent unspecific binding.
- Dilute primary antibodies at a concentration of 1 µg/mL in blocking buffer.
NOTE: For human and mouse NETs, a combination of rabbit antibody against neutrophil elastase and chicken antibody against Histone 2B can be used (Table of Materials). - Place slides into a moist chamber. Remove blocking buffer and add the diluted primary antibodies without washing to the sections using sufficient volume to prevent drying. Seal moist chamber with paraffin film and incubate overnight at RT.
- Wash sections 3x with TBS for 5 min each.
- Prepare working solution of secondary antibodies in blocking buffer. For detection of primary antibodies, use secondary antibodies raised in donkey and pre-absorbed against serum proteins from multiple species (Table of Materials). Cover tissue sections with working solution of secondary antibodies. Transfer slides to moist chamber, seal with paraffin film. Incubate for 1 h at RT.
NOTE: Donkey anti rabbit conjugated to Cy2 and donkey anti chicken conjugated to Cy3 can be combined with a DNA counterstain. - Wash sections 3x for 5 min each with TBS, then once for 5 min with deionized water.
- Cover sections with mounting medium (Table of Materials) and apply cover glass avoiding bubble formation.
- Let mounting medium solidify, then analyze immunofluorescence using a wide-field microscope with appropriate band pass filters or a confocal microscope.
Results
Using this protocol, NET components can successfully be detected in paraffin-embedded tissue both of human and murine origin. In unstimulated neutrophils, H2B is located exclusively in the nucleus and neutrophil elastase in granules; consequently, their fluorescence signals do not overlap. In contrast, during NETosis and after NET formation, NE, H2B, and DNA partly colocalize. If imaged as green, red, and blue signals, areas of colocalization are depicted as whitish overlay (Figure 1G, Figure 2D, and Figure 3D). This overlay can also be quantified using image analysis software. Pixels from overlapping signals that are positive for green, red, and blue have been used to create a purple overlay depicting NET areas in Figure 1G’, Figure 2D’, and Figure 3D’. Some of the cells in Figure 1 and Figure 2 have lobulated nuclei but are negative for NE. It is believed that these cells are eosinophil granulocytes.
If the tissue sections have a thickness of 2–3 µm, they can be analyzed by wide-field microscopy using 10x or 20x objectives. An example is presented in Figure 1, which depicts a section of human appendicitis tissue stained for NE (green), H2B (red) and Hoechst 33342 (blue). Panels A, C, E, and G are from an area of the section containing NETs, while panels B, D, F, and H are from a different area of the same section, which contains numerous neutrophils (Figure 1B, NE) but no NETs. Areas with massive NET formation can easily be found even at low magnifications, since all three NET components colocalize, often in stringy extracellular structures, which in the overlay of the three channels appear as whitish extracellular fibers (Figure 1G), purple overlay in Figure 1G’.
The staining patterns of both tissue areas are clearly different, with NE contained in granules (Figure 1B) and DNA in nuclei (Figure 1F). Interestingly, the staining for H2B is rather weak in neutrophil-rich areas (Figure 1D) compared to NET-containing tissue (Figure 1C). This could be due to the size of the antibody (IgY has 180 kD compared to 150 kD for IgG), which may prevent binding to compact chromatin in intact nuclei, while access to H2B is facilitated if the chromatin is decondensed as is the case in NETs (Figure 1C).
For higher resolution, confocal microscopes or widefield microscopes with deconvolution have to be used to minimize out-of-focus blur. Figure 2 depicts a NET-rich area from the same human appendicitis specimen. It is a maximum projection of a confocal stack. NE (green, Figure 2A) is found in granules but is also abundant extracellularly, where it colocalizes with H2B (red, Figure 2B) and DNA (blue, Figure 2C). The extracellular colocalization results in a whitish color combination (Figure 2D). These pixels positive for green, red, and blue have been used to create a purple overlay presenting NETs in Figure 2D’.
Figure 3 is a detail of a central section from a mouse lung infected with Mycobacterium tuberculosis (M. tb). Antigen retrieval and staining conditions are the same as for Figure 1 and Figure 2. Again, colocalization of all three NET components is clearly visible as whitish areas between neutrophils, which has been used to create a purple layer indicating NETs in Figure 3D’.
The specificity of the staining is demonstrated in Supplementary Figure 1, which depicts negligible staining with control antibodies, and Supplementary Figure 1A,B depicts rabbit non-immune serum (green) and chicken anti-GFP IgY (red). Figure 1C,D shows the staining with secondary antibodies alone, the combination was the same as was used in Figure 1, Figure 2, and Figure 3. Supplementary Figure 1A,C shows a section of human appendicitis similar to Figure 1 and Figure 2. Supplementary Figure 1B,D is mouse lung tissue similar to Figure 3. DNA is stained with Hoechst 33342. Scale bar represents 25 µm.

Figure 1: Wide-field fluorescence microscopy of a paraffin section of a human appendicitis sample.
Panels A, C, E, and G depict a tissue area with NETs, while panels B, D, F, and H show a different area of the same section that is rich in neutrophils but without NET formation. Staining is against NE (A,B; green), H2B (C,D; red), and DNA (E,F; blue). Figure 1G,H represents the overlay of all three channels. Pixels with an intensity between 80 and 256 in all colors represent areas of overlapping staining for NE, H2B, and DNA and are considered to be derived from NETs or neutrophils undergoing NETosis. These pixels have been pseudo-colored as purple in panel G’, where they form a large area; and in panel H’, where only small spots are found. Images were taken with a wide-field microscope using a 20x objective, and scale bar represents 25 µm. Please click here to view a larger version of this figure.
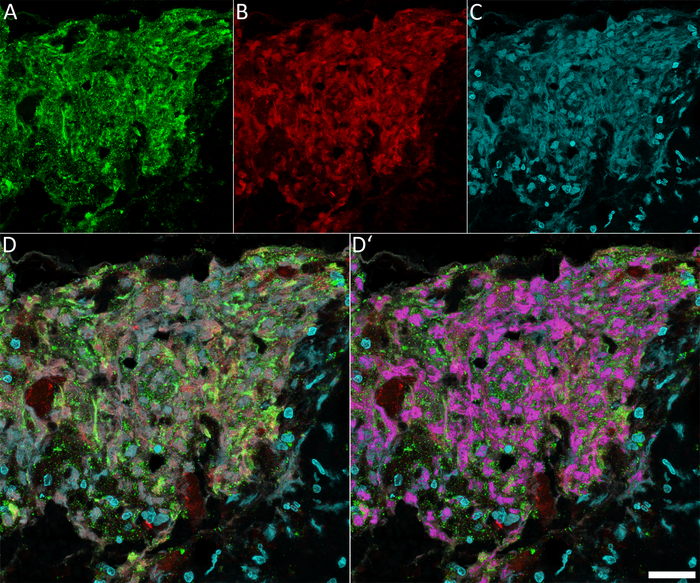
Figure 2: Confocal fluorescence microscopy of NET components in a human appendicitis sample.
The same tissue section used in Figure 1 was used. (A) Staining against NE, (B) Depiction of H2B, and (C) Hoechst 33342 staining of DNA. (D) The overlay of all three channels. Colocalization of all three signals is pseudo-colored purple in panel D’. For this, pixels with an intensity >80 in all three colors were detected using Volocity 6.3. The purple area depicts NETs or neutrophils undergoing NETosis. The images were taken with a confocal microscopy as Z-stacks and presented as maximum projection. Scale bar represents 25 µm. Please click here to view a larger version of this figure.
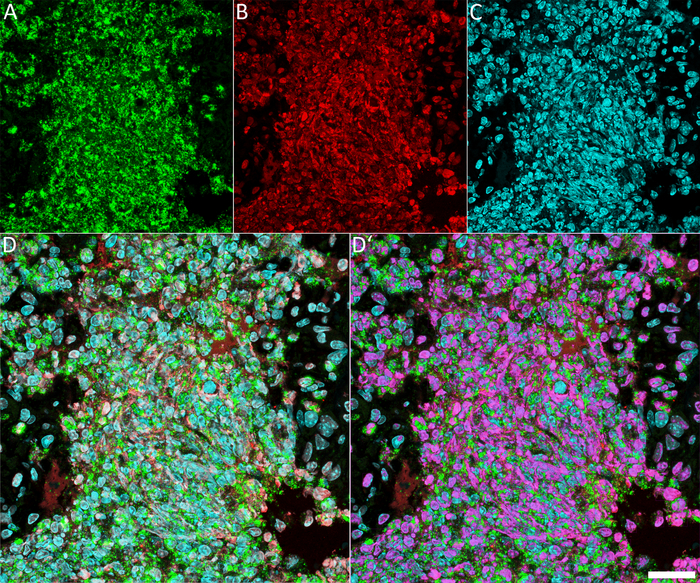
Figure 3: Confocal fluorescence microscopy of NET components in a mouse lung infected with M. tb.
It is a detail from the central part of a section of a complete lung with massive neutrophil infiltration. (A) NE staining, (B) H2B staining, and (C) DNA staining. (D) The overlay of all three channels. The purple overlay in panel D’ indicates pixels with intensity values of >80 in all three colors indicating neutrophils undergoing NETosis as well as NETs. The images were taken as a Z-stacks with a confocal microscope and presented as maximum projection. Scale bar represents 25 µm. Please click here to view a larger version of this figure.
Supplementary Figure 1: Staining control with unrelated primary antibodies. Human (A,C) and murine tissue (B,D) as was used for Figure 1 and Figure 2, and Figure 3, respectively, were stained with unrelated primary antibodies (A,B) or without primary antibodies (C,D). As control primary antibodies in panels A and B, serum from a non-immunized rabbit and a chicken IgY against GFP were applied. Secondary antibodies were the same as shown in all other staining and also used in panels C and D. As expected, in all conditions, negligible background staining was detected, illustrating the specificity of the antibodies used for Figure 1, Figure 2, and Figure 3. The images were taken with a confocal microscope, DNA stained with Hoechst 33342, and scale bar represents 25 µm. Please click here to download this figure.
Discussion
With growing awareness of the role of NETs during pathogenesis9, their detection in tissue from patients or experimental animals is gaining increasing importance. Paraffin-embedded tissue samples have a number of advantages compared to other tissue preparations (e.g., sections of cryopreserved specimens). The tissue preservation in paraffin-embedded samples is clearly superior, and once embedded, the samples are preserved for decades, enabling retrograde studies. For detection of NETs, which are filigree structures, good sample conservation is a precondition ruling out the use of cryopreserved material, which is prone to tissue damage due to ice crystal formation that can give rise to artifacts morphologically resembling NETs.
For optimal preservation, tissue from experimental animals should be fixed shortly after death, ideally by perfusion, to avoid autolysis. As fixative, freshly prepared or freshly thawed solutions of paraformaldehyde in a suitable buffer like TBS or PBS ore optimal. This is chemically defined in contrast to formalin preparations used for standard histology, and induces less tissue autofluorescence. In contrast, human tissue often is not fixed directly after excision, and as fixative, normally a 10% dilution of formalin is utilized which contains 10% to 15% of methanol as a stabilizer to prevent polymerization, as well as formic acid, other aldehydes, and ketones. Often, the tissue is stored in this fixative for extended amounts of time before embedding. The result can be autolysis (depending on the time between excision and fixation), and excessive formation of methylene bridges due to the overfixation. Formaldehyde fixation induces changes in the tertiary structure of proteins by formation of intra- and inter-molecular methylene bridges10. Non-proteinaceous cell components like nucleic acids, carbohydrates and lipids are not fixed directly, but immobilized in the three-dimensional protein network. For successful labelling, methylene bonds have to be broken to expose the epitopes in the process of antigen retrieval. This is accomplished by heating of tissue sections mounted onto microscope slides in a suitable heat-induced antigen retrieval buffer (HIER buffer)11. Our previous study analyzed the influence of pH and temperature of HIER buffers on the detection of NET components in paraffinized tissue, and it was found that successful tissue pretreatment for one component often is suboptimal for a second component8.
In the meantime, it has been found that heating the tissue to 70 °C in HIER buffer at a pH of 9 is a good compromise for many NET components and will retain good tissue preservation, which is often compromised at higher temperatures. It is proposed to use the retrieval time indicated as a starting point, but especially with archival specimens of unknown fixation parameters, the staining intensity can be unsatisfactory. In this case, prolongation of or higher temperature during the retrieval procedure can improve staining efficiency. This can also influence the histone 2B staining of the IgY antibody used in our protocol. As shown in Figure 1, decondensed chromatin can be found in neutrophils undergoing NETosis as well as in NETs stains much stronger with this antibody compared to chromatin in resting neutrophils. This is probably due to restricted access of the 180 kDa IgY molecule to compact nuclei and may differ after increased epitope recovery. This may intensify binding efficiency even in areas of condensed chromatin, which will result in stronger fluorescence in normal nuclei of neutrophils and other cells. The difference in staining efficiency between neutrophils undergoing NETosis and non-stimulated neutrophils could be less pronounced than depicted in Figure 1. Areas of NET formation still would be identified by the co-localization of NE, H2B, and DNA.
The fixation procedure can also induce significant autofluorescence of the tissue, mainly in the bluish/greenish part of the spectrum. It is important to avoid most of this autofluorescence by using adequate narrow bandpass fluorescence filter sets (wide-field) or detector settings (confocal) that match the emission maximum of the fluorochrome used with blue excitation, e.g., Cy2, Alexafluor 488. In extreme cases of autofluorescence, the bluish/greenish part of the spectrum should be avoided. Instead, fluorescence signals can be detected easier in the far red part of the spectrum (e.g., secondary antibodies coupled to Cy 5 or Alexafluor 635), but this requires filterless black/white cameras or confocal microscopes. Since the human eye is rather insensitive beyond 600 nm, far red fluorescence signals can hardly be detected using oculars. In any case, it is important to use negative controls (e.g., non-immune sera/isotype controls instead of primary antibodies or omitting primary antibodies) to determine suitable exposure times or detector settings.
Tissue sections of 1−2 µm can be analyzed with wide-field microscopes using 10x or 20x objectives. These lenses provide a large focal depth, so (nearly) the entire tissue section will be in focus. This can be used to quickly scan tissue sections for areas of NET formation if they are sufficiently large (as in Figure 1). The colocalization of the green (NE), red (H2B), and blue (DNA) channels results in a white staining indicating areas of NET formation (Figure 1G). For higher magnifications, confocal or wide-field microscopes with deconvolution are necessary. Figure 2 shows details of the human appendicitis specimen also used for Figure 1. In Figure 2A, NE localizes to small dots (granules), but a large proportion is extracellular, often forming stripes which overlap with H2B (Figure 2B) and DNA (Figure 2C). This colocalization results in a whitish overlay indicating NETs (Figure 2D). A very similar pattern can be found in the lung section of a mouse infected with M. tuberculosis (Figure 3).
The specimens presented here are characterized by areas with a high degree of NET formation which can be identified even at low magnification. Depending on the tissue density and respective stimulus, NET formation can be much less pronounced, down to NET formation of small groups of neutrophils (for an example in myocarditis, see a previous publication12). It is believed that this protocol will help foster more research on NETs in tissue and hopefully aid in unravelling unrecognized roles of NETs in the formation or prevention of diseases.
Disclosures
The funding source of this work is the Max Planck Society. We thank Arturo Zychlinsky for critically reading the manuscript and Philippe Saikali for the mouse tissue.
Acknowledgements
The authors have nothing to disclose.
Materials
| Name | Company | Catalog Number | Comments |
|---|---|---|---|
| bovine serum albumine | Sigma | A7906 | |
| chicken anti Histone 2B antibody | Abcam | ab 134211 | |
| cold water fish gelatine | Sigma-Aldrich | G7765 | |
| donkey anti chicken antibody, Cy3 conjugated, for multiple labelling | Jackson Immuno Research | 703-165-155 | |
| donkey anti rabbit antibody, Cy2 conjugated, for multiple labelling | Jackson Immuno Research | 711-225-152 | alternatively Cy5 conjugate, 711-175-152 |
| embedding cassettes | Roth | K116.1 | |
| embedding molds | Sakura | 4162 | |
| embedding station | Microm | AP280 | |
| ethanol | Roth | 9065.4 | |
| filter paper, rolled | OCB | ||
| forceps | Dumont | 7a | |
| glass cylinder with 20 cm diameter | VWR | 216-0075 | |
| glycerol | Roth | 3783.1 | |
| HIER buffer pH 9 | Scytek | TES999 | |
| Hoechst 33342 | Sigma | 14533 | |
| incubator (dry, up to 40 °C) | Memmert | MMIPP30 | |
| moist chamber (plastic box with tight lid) | Emsa | 508542 | |
| Mowiol 40-88 | Aldrich | 32.459-0 | |
| normal donkey serum | Merck | S30 | |
| PAP-pen ImmEdge | Vector Lab | H-4000 | |
| paraffin microtome | Microm | 355S | water bath included |
| paraformaldehyde | Aldrich | 16005 | |
| petri dishes | Schubert /Weiss | 7020051 | |
| rabbit anti ELANE antibody | Atlas | HPA068836 | |
| racks, jars for microscope slides | Roth | H554.1 H552.1 | |
| scalpel | Braun | Fig.22 | |
| Superfrost Plus glass slides | Thermo Scientific | J1800AMNZ | |
| temperature-controlled hot plate | NeoLab | D6010 | |
| tissue processor for paraffin embedding | Leica | TP1020 | |
| Tris buffered saline TBS | VWR | 788 | |
| Triton X100 | Roth | 3051.4 | |
| Tween 20 | Fluka | 93773 | |
| water bath 37 °C | GFL | 1052 | |
| widefield or confocal microscope | Leica | DMR, SP8 | |
| xylene (dimethylbenzene) | Roth | 9713.3 |
References
- Brinkmann, V., et al. Neutrophil extracellular traps kill bacteria. Science. 303 (5663), 1532-1535 (2004).
- Urban, C. F., et al. Neutrophil extracellular traps contain calprotectin, a cytosolic protein complex involved in host defense against Candida albicans. PLOS Pathogens. 5 (10), e1000639(2009).
- Fuchs, T. A., et al. Novel cell death program leads to neutrophil extracellular traps. Journal of Cell Biology. 176 (2), 231-241 (2007).
- Papayannopoulos, V., Metzler, K. D., Hakkim, A., Zychlinsky, A. Neutrophil elastase and myeloperoxidase regulate the formation of neutrophil extracellular traps. Journal of Cell Biology. 191 (3), 677-691 (2010).
- de Boer, O. J., Li, X., Goebel, H., van der Wal, A. C. Nuclear smears observed in H&E-stained thrombus sections are neutrophil extracellular traps. Journal of Clinical Pathology. 69 (2), 181-182 (2016).
- Robertson, D., Savage, K., Reis-Filho, J. S., Isacke, C. M. Multiple immunofluorescence labelling of formalin-fixed paraffin-embedded (FFPE) tissue. BioMed Central Cell Biology. 9, 13(2008).
- Rait, V. K., Xu, L., O'Leary, T. J., Mason, J. T. Modeling formalin fixation and antigen retrieval with bovine pancreatic RNase A II. Interrelationship of cross-linking, immunoreactivity, and heat treatment. Laboratory Investigation. 84 (3), 300-306 (2004).
- Brinkmann, V., Abu Abed, U., Goosmann, C., Zychlinsky, A. Immunodetection of NETs in Paraffin-Embedded Tissue. Frontiers in Immunology. 7, 513(2016).
- Papayannopoulos, V. Neutrophil extracellular traps in immunity and disease. Nature Reviews Immunology. 18 (2), 134-147 (2018).
- Cattoretti, G., et al. Antigen unmasking on formalin-fixed, paraffin-embedded tissue sections. Journal of Pathology. 171 (2), 83-98 (1993).
- Yamashita, S., Okada, Y. Mechanisms of heat-induced antigen retrieval: analyses in vitro employing SDS-PAGE and immunohistochemistry. Journal of Histochemistry and Cytochemistry. 53 (1), 13-21 (2005).
- Weckbach, L. T., et al. Midkine drives cardiac inflammation by promoting neutrophil trafficking and NETosis in myocarditis. Journal of Experimental Medicine. 216 (2), 350-368 (2019).
Reprints and Permissions
