A procedure to measure the speed and accuracy of rats’ motor performance in a social condition is described. The protocol enables us to investigate the effect of the mere presence of others on speed and accuracy of motor performance in one experiment.
Method Article
A Task for Assessing the Impact of a Partner on the Speed and Accuracy of Motor Performance in Rats
In This Article
Summary
Abstract
To our knowledge, no study has examined the effect of mere presence on accuracy of performance in animals. Therefore, we developed an experimental task to measure rats’ motor performance (speed and accuracy) in a social condition. Rats were trained to run on a runway and pull down a lever at the end of the runway. In testing, rats performed the task solitarily (single) or in the presence of a confederate rat beyond the lever (pair or a social condition). As indices of the performance speed, we measured the time needed to start running, run through the runway, and pull down the lever. As the index of performance accuracy, we counted the number of trials in which rats could pull down the lever during their first attempt. One-way and two-way repeated-measure analyses of variance were used to analyze the data. This run-and-pull task enabled us to examine the effect of the presence of another conspecific on both speed and accuracy of motor performance in one experiment. The results showed that rats performed the task faster but less accurately in pair sessions than in single sessions. This protocol would be a valid animal model to examine the effect of mere presence on speed and accuracy of motor performance in rats.
Introduction
The effect of social conditions on one’s performance has been investigated in humans and animals for a long time, since Allport1 referred to “social facilitation” as “an increase in response merely from the sight or sound of others making the same movement”2. Although Allport1 did not distinguish the social situation (co-action or the mere presence of another), it has been shown that the mere presence of other(s) affects one’s performance speed or frequency3,4,5,6. Additionally, in animals, the mere presence of other conspecific results in a higher response rate or higher response speed during a lever-press task in rats7,8 and higher response rate in rhesus monkeys during a simple cognitive task9.
In humans, it has been shown that social situations affect not only response frequency or speed but also accuracy of performance10. Based on a meta-analysis by Bond and Titus11, Strauss12 argued that situations used in studies on social facilitation would have a different effect depending on features of the task used. Especially, decrement in the performance would be expected when the study used a task that placed high demands on one’s ability to control his/her body precisely and to perform with some extent of speed, which tends to be scored by its qualitative aspects (e.g., accuracy of the performance)13.
Except for a couple studies14,15, however, most studies on social facilitation in animals have not focused on the accuracy of performance. For instance, Takano and Ukezono16 investigated the effect of mere presence in rats using a skilled reaching task17. They required rats to turn around and then grasp a reward pellet on a shelf by using their forelimb. The authors reported only the performance speed, despite the fact that the task could provide an index of performance accuracy. Conversely, Ogura and Matsushima14 examined the effect of co-action on the pecking accuracy as well as running speed in chicks. The result showed that the pecking accuracy was lower and running speed was higher in the co-action situation than in the solitary situation.
Although Ogura and Matsushima14 focused on the qualitative aspect of an action for the first time, their study was about the effect of co-action. Most social conditions, including co-action, inevitably imply the presence of another. To examine the effect unique to co-action, it is indispensable to dissociate the effect of mere presence from that of co-action on an individual’s performance. However, the study did not investigate the effect of mere presence. To our knowledge, no study has examined the effect of mere presence on the accuracy of performance in animals.
We modified the task used in Takano and Ukezono’s study16 to evaluate the effects of mere presence on both performance speed and accuracy. This method enables us to examine the effect of social conditions, especially the mere presence of a conspecific, on performance accuracy and performance speed in rats in one experiment.
Protocol
This experimental protocol was approved by the Doshisha Committee of Animal Experiment.
NOTE: Conduct all experimental sessions during the light period.
1. Animals
- Use 15 experimentally naïve male albino Wistar rats that weigh 300−350 g. House them in individual cages of a controlled breeding room with the appropriate temperature and humidity (23 ± 2 °C, 70%) and ad libitum access to the water. Maintain the light/dark cycle at 12 h/12 h (the light period begins at 8:00 AM).
- Assign 10 rats as subjects, and the remaining as confederate rats using randomization.
- Maintain rats’ weights at 85−90% of their free-feeding weights throughout the experiment by food deprivation.
NOTE: The assignment of confederate is to reduce the number of animals required and time for one study.
2. Apparatus
NOTE: The overview of the apparatus is shown in Figure 1. The apparatus was developed and modified in reference to previous studies16,17.
- Construct a clear acrylic box (19 cm x 110 cm x 20 cm) with a central partition (5 cm wide) and insert two guillotine doors. Place the guillotine doors 15 cm away from each end of the box. Mount a buzzer (400 Hz, 75 dB) on the partition, and set up a pellet dispenser for serving a reward pellet (45 mg) into a food receptacle on the subject’s side of the box.
- Set up a metal lever (grip bar: φ3 mm, 5 cm high) on a shelf inside the central partition, which has a slit (1.5 cm wide) on each wall facing the runway (Figure 2), in order to allow the subject rat to access the lever by using its forelimbs. On the confederate’s side, however, insert a transparent wall in front of the partition’s wall that prohibits the confederate from accessing the lever.
- Place a switch for activating the dispenser under the lever that is pressed by the lever-pull movement of rats. Tie the proper length of gut to the lever, which is needed for the experimenter to pull up the lever.
- Use Arduino Mega 2560 REV3 to control the guillotine doors, buzzer, and pellet dispenser, and to obtain the value from the infrared sensors and switch of the dispenser. Prepare an air compressor (25 L) to operate the air cylinder and open the guillotine door.
- Place a video camera near the partition of the outside of the apparatus, in order to record lever-pull performance of the rats from a lateral view (60 frames per second [fps]). Use an adequate video playback software to conduct frame-by-frame analysis of the video recording.
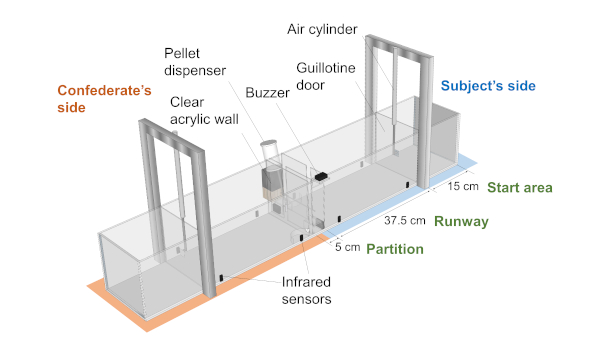
Figure 1: A schematic of the apparatus used in this protocol. A central partition divides the box into two fields. There is a guillotine door on each side of the box, and the door divides the field into the start area and runway. Please click here to view a larger version of this figure.
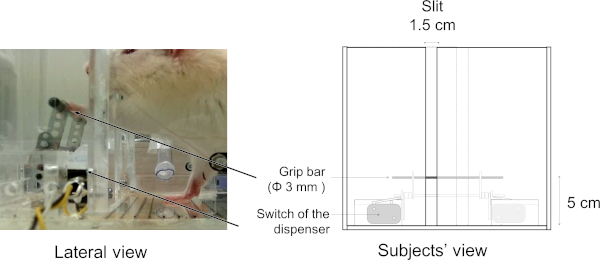
Figure 2: The central partition of the apparatus. Rats can grasp a bar and pull the lever through a slit of the partition. A switch of the pellet dispenser is set under the lever, and one lever-pull action results in one pellet delivery. This figure has been modified from Sekiguchi and Hata12. Please click here to view a larger version of this figure.
3. Procedure
- Handling and habituation for the reward pellets
- Before the training procedures, handle all rats for 10 min/day for 3 days by the experimenter.
- As a habituation for the reward pellets, give each rat 3 g of reward pellets for 3 days after handling.
- Habituation to the apparatus
- Subject rats
- On the third day of habituation for the reward pellets, before the experimenter gives daily pellets, place each rat in the runway of the subject’s side of the apparatus for 15 min for habituation, with the guillotine door closed.
- Confederate rats
NOTE: There are two habituation sessions.- At the first habituation, place each rat on the runway of the confederate’s side of the apparatus for 15 min during the same period as step 3.2.1.1.
- At the second habituation, follow the method in step 3.2.2.1 on the day after subject rats completed training for the run-and-pull sequence (as mentioned in section 3.6).
NOTE: Conduct habituation sessions for confederate rats and subject rats separately, i.e., one rat at a time. Do not let a rat meet another rat in the apparatus until the test phase starts.
- Subject rats
- Magazine training
NOTE: For the subject rats, conduct a magazine training session on the next day of the habituation to the apparatus as follows. If rats do not eat all the food pellets, then conduct the magazine training session again on the next day.- Put one reward pellet on the food receptacle on the confederate’s side to exclude the effect of the olfactory property of the pellet, which the confederate eats in the test phase (refer to section 3.7).
- Place a subject rat on the runway of the subject’s side, with the guillotine door closed.
- Deliver a reward pellet into the food receptacle 60 times using the pellet dispenser on a variable time 30-s schedule. Ensure that the subject rat eats all the delivered pellets.
- Shaping for the lever-pull action
NOTE: Figure 3 is a flowchart of the experiment.- Put one reward pellet on the food receptacle on each subject’s side and confederate’s side. Do not place the confederate rat in shaping sessions.
- Place the subject rat on the runway of the subject’s side with the guillotine door closed. Then train the rats to pull down the lever. Shape the lever-pull behavior gradually with following five reinforcement criteria (A-E): (A) Approach the slit. (B) Touch the grip bar to the rat’s muzzle or forelimbs, with the lever beforehand pulled down to the subject’s side. (C) Touch the grip bar, with the lever inclined to the rat’s side (at an angle of 60°−30°). (D) Grasp and pull down the bar to rat’s side using the same condition as in criterion C. (E) Grasp and pull down the bar to rat’s side with the lever standing upright.
- Finish daily sessions when 60 rewards are given, or 30 min has elapsed. When a rat completes criterion E 40 times in a session, the lever-pull shaping phase is finished on that day.
NOTE: Almost all rats finish the daily shaping session within 20 min. Wistar rats need about 3 days to reach criterion E.
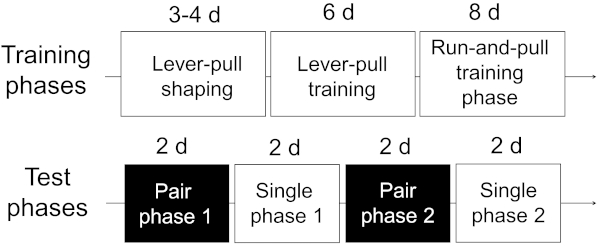
Figure 3: A flowchart of the experimental procedure. Subject rats go through the training phases and test phases in this order. This figure has been modified from Sekiguchi and Hata12. Please click here to view a larger version of this figure.
- Training for the lever-pull action
- Place the subject rat on the start area. Do not place the confederate rat in the training sessions. Present the buzzer tone for 5 s, and then open the door. When the subject rat pulls down the lever, deliver a food pellet and pull the lever up using a gut tied to the lever.
- After rats pull down the lever for 10 times (first 3 days of the phase) or 6 times (last 3 days of the phase) and consume all reward pellets, close the door and move them to the start area by the experimenter’s hand.
- After an inter-trial interval (ITI) of 20 s, repeat steps 3.5.1 and 3.5.2. Finish daily sessions when each rat has earned 60 pellets.
NOTE: This training also aims to habituate rats to the buzzer tone and door opening because Wistar rats ordinarily show freezing behavior at first in response to door movement. A daily session for each rat requires about 15 min. Six days are needed for this training phase.
- Training phase for the run-and-pull sequence
- Conduct the same procedure in step 3.5.1.
- When rats pull down the lever one time and consume a reward pellet, close the door and move them to the start area by the experimenter’s hand.
- After an ITI of 20 s, start the next trial (steps 3.6.1 and 3.6.2). Finish the daily session when each rat has earned 30 pellets.
NOTE: A daily session for each rat requires about 20 min. About 10 days are needed for rats’ scores to reach asymptote.
- Test phases
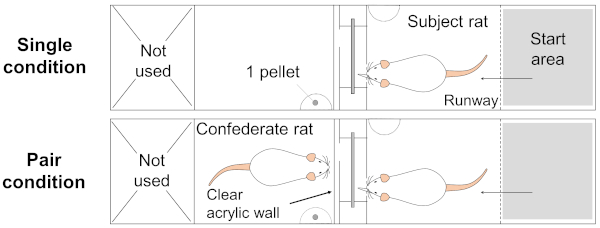
Figure 4: Description of each test condition. In single phases, the subject rat performed the task solitarily. In the pair phases, place the confederate rat in the runway on the opposite side to the subject rat. A transparent wall in front of the partition precludes the confederate rat from accessing the lever. This figure has been modified from Sekiguchi and Hata12. Please click here to view a larger version of this figure.
NOTE: Test phases include sessions in two conditions, single or pair (Figure 4). In the single condition, rats perform the task solitarily; that is, trials are identical to the session of the training for the run-and-pull sequence (section 3.6). In the pair condition, the confederate rat is present at the opposite side of the box. The confederate rat cannot access the lever because of the clear acrylic wall in front of the partition.
- Conduct a single session that is identical to the sessions in the training phase for the run-and-pull sequence (section 3.6). Finish the daily session when each rat has earned 30 pellets. Put one reward pellet on the food receptacle on the confederate’s side, especially during sessions in the single condition.
- In pair sessions, give the confederate rat a reward pellet during the ITI of the subject rat in order to keep the confederate rat near the partition.
4. Data Analysis
- Index of performance accuracy
- Record videos of rats’ lever-pull movement using the video camera near the partition of the outside of the apparatus. After all sessions are completed, confirm the evaluation by frame-by-frame analysis of the video recordings using an adequate video playback software.
- Evaluate whether the rat’s pulling movement of a trial was the first-hit or not by visual observation of the experimenter during the experiment.
NOTE: The first-hit trial is defined as the trial in which rats could grasp and pull down the lever during their first attempt to the lever. - Calculate first-hit rates for each subject as the proportion of first-hit trials to all trials in each session (for the run-and-pull training phase) or in each phase (for test phases) to use in the analysis.
- Indices of performance speed
- Calculate the time needed to complete a trial from the value of the switch of the pellet dispenser: the time needed to complete a trial = (the time when the switch is pressed) - (the time when the door is opened). Then divide the time needed for completion of a trial into three sections using values from the infrared sensors (Figure 5).
NOTE: Start latency (Figure 5a) is defined as the time from the door opening to the arrival of the rat at the first sensor. Similarly, running time (Figure 5b) is the time from the arrival at the first sensor to the arrival at the second sensor. Lever-pull latency (Figure 5c) is the time from the arrival at the second sensor to the time point when the switch of the dispenser is pressed. - Use only the durations from the first-hit trials for analysis. Calculate median values of each subject for each session (of the training sessions) and each phase (of the test phases) for analysis.
- Calculate the time needed to complete a trial from the value of the switch of the pellet dispenser: the time needed to complete a trial = (the time when the switch is pressed) - (the time when the door is opened). Then divide the time needed for completion of a trial into three sections using values from the infrared sensors (Figure 5).
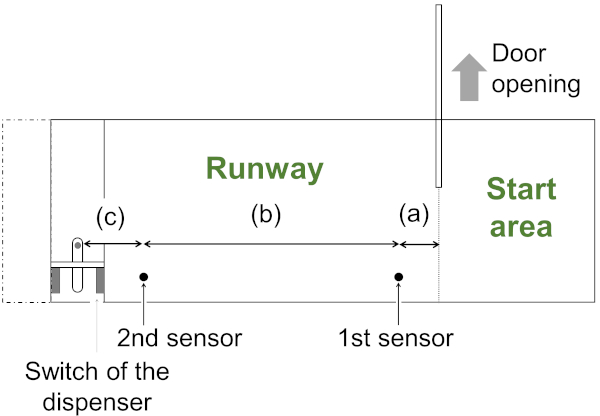
Figure 5: Measurement of the indices of performance speed. (a) Start latency: the duration from the door opening to the arrival of the rat at the first sensor. (b) Running time: the duration from the arrival of the rat at the first sensor to its arrival at the second sensor. (c) Lever-pull latency: the duration from the arrival of the rat at the second sensor to the completion of a lever-pull response. This figure has been modified from Sekiguchi and Hata12. Please click here to view a larger version of this figure.
- Statistical analysis
- For the indices in the training phase of the run-and-pull sequence, conduct one-way repeated-measure analysis of variance (ANOVA) with the number of sessions as the within-subject factor for each index.
- For the indices in the test phase, conduct two-way repeated-measure ANOVA with the number of the phase (phase 1 or 2) and condition (pair or single) as the within-subject factors for each index in the test phases. Statistical significance was set at α = 0.05.
Results
Training phase for the run-and-pull sequence
Figure 6 shows the mean ± standard error of the mean (SEM) scores from the training phase for the run-and-pull sequence. The mean first-hit rate (Figure 6A) increased gradually during the first half of the training phase and then stopped at about 85%. The ANOVA results showed that the main effect of the number of sessions was significant (F(7,63) = 3.74, p = 0.002, η2G = 0.211). Multiple comparisons revealed that there were no significant differences among the latter four sessions (all p values > 0.60).
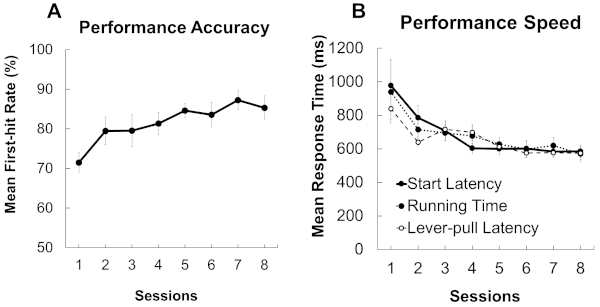
Figure 6: Mean ± SEM scores from sessions in the training phase for the run-and-pull sequence. (A) Index of performance accuracy. (B) Indices of performance speed. This figure has been modified from Sekiguchi and Hata12. Please click here to view a larger version of this figure.
Similarly, indices of performance speed (Figure 6B; start latency, running time, and lever-pull latency) decreased continuously during the first four sessions, and all values stabilized at about 600 ms among the latter four sessions. For all indices, ANOVA showed that main effects of the number of sessions were significant (start latency: (F(7,63) = 6.21, p < 0.001, η2G = 0.279; running time: (F(7,63) = 3.98, p = 0.001, η2G = 0.170; lever-pull latency: (F(7,63) = 11.85, p < 0.001, η2G = 0.350). Multiple comparisons by sessions resulted in no significant difference among the latter four sessions for all measures (all p values > 0.12).
Figure 7 shows the mean ± SEM scores from sessions in the test phase. Regarding the index of performance accuracy, the first-hit rate (Figure 7A) in pair phases was lower than in the single phases. Additionally, the first-hit rate in the second phase was higher than in the first phase in the two conditions. The results of ANOVA showed significant main effects of the condition (F(1,9) = 6.25, p = 0.034, η2G = 0.114) and phases (F(1,9) = 14.1, p = 0.005, η2G = 0.147), but the interaction was not significant (F(1,9) = 0.15, p = 0.703, η2G = 0.002).
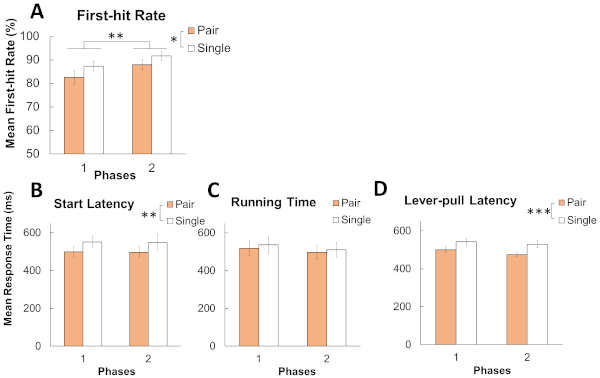
Figure 7: Mean ± SEM scores from sessions in the test phase. Index of performance accuracy (A: first-hit rate) and indices of performance speed (B: start latency, C: running time, and D: lever-pull latency). *** p < 0.001, ** p < 0.01, * p < 0.05. This figure has been modified from Sekiguchi and Hata12. Please click here to view a larger version of this figure.
Regarding indices of performance speed, the start latency in pair phases (Figure 7B) was shorter than in single phases. The ANOVA results showed that for the start latency, only the main effect of the condition was significant (F(1,9) = 23.1, p = 0.001, η2G = 0.065), while the main effect of phases and the interaction was not significant (phases: F(1,9) = 0.03, p = 0.878, η2G < 0.001; interaction: F(1,9) = 0.002, p = 0.970, η2G < 0.001). Similarly, a difference was observed between conditions for the lever-pull latency (Figure 7D). As with the start latency, for the lever-pull latency, ANOVA showed a significant main effect of the condition (F(1,9) = 23.3, p = 0.001, η2G = 0.183). There was no significant main effect of phases (F(1,9) = 2.72, p = 0.133, η2G = 0.028) and the interaction (F(1,9) = 1.07, p = 0.327, η2G = 0.002). For the running time, there was no significant effect (Figure 7C, condition: F(1,9) = 3.03, p = 0.116, η2G = 0.004; phases: F(1,9) = 4.46, p = 0.063, η2G = 0.010; interaction: F(1,9) = 0.29, p = 0.602, η2G < 0.001).
Figure 1: A schematic of the apparatus used in this protocol. A central partition divides the box into two fields. There is a guillotine door on each side of the box, and the door divides the field into the start area and runway. Please click here to view a larger version of this figure.
Figure 2: The central partition of the apparatus. Rats can grasp a bar and pull the lever through a slit of the partition. A switch of the pellet dispenser is set under the lever, and one lever-pull action results in one pellet delivery. This figure has been modified from Sekiguchi and Hata12. Please click here to view a larger version of this figure.
Figure 3: A flowchart of the experimental procedure. Subject rats go through the training phases and test phases in this order. This figure has been modified from Sekiguchi and Hata12. Please click here to view a larger version of this figure.
Figure 4: Description of each test condition. In single phases, the subject rat performed the task solitarily. In the pair phases, place the confederate rat in the runway on the opposite side to the subject rat. A transparent wall in front of the partition precludes the confederate rat from accessing the lever. This figure has been modified from Sekiguchi and Hata12. Please click here to view a larger version of this figure.
Figure 5: Measurement of the indices of performance speed. (a) Start latency: the duration from the door opening to the arrival of the rat at the first sensor. (b) Running time: the duration from the arrival of the rat at the first sensor to its arrival at the second sensor. (c) Lever-pull latency: the duration from the arrival of the rat at the second sensor to the completion of a lever-pull response. This figure has been modified from Sekiguchi and Hata12. Please click here to view a larger version of this figure.
Discussion
This task enables us to evaluate the effect of the mere presence of others on speed and accuracy of motor performance. The effect sizes reported herein would be large enough. We recalculated η2 (there was not much difference between η2 and η2G in this experiment), and these effect sizes are regarded as medium (η2 > 0.06) or large (η2 > 0.14) according to the criterion presented by Cohen18. For this reason, we considered that the differences seen in this study are meaningful and reliable. Results in the experiment were almost in line with those from studies in humans4,10, and the result of Ogura and Matsushima’s study14, which investigated the effect of co-action on the speed and accuracy of running and pecking behavior in chicks. Although studies about social facilitation in humans investigated the effect of social conditions on both speed and accuracy of behavior, most previous studies in animals have not investigated the mere presence effect on performance accuracy. The protocol presented herein provides a better animal model for investigating the effect of mere presence on motor performance.
As a limitation, the difference between the first-hit rate in pair and single conditions could be interpreted as an effect of practice. Despite presumably sufficient training, there could be room for improvement in the performance of rats. There were no more changes in the indices of performance accuracy and performance speed in the last four sessions of the training phase for the run-and-pull sequence. However, in the test phases, the first-hit rate increased continuously. This increase might be interpreted as the effect of practice. Additionally, this experimental design (A-B-A-B design) cannot exclude the effect of practice from the effect of conditions. Future experiments should (1) use the A-B-B-A design or another appropriate experimental design to exclude the effect of practice, and (2) consider extending the training phase for the run-and-pull sequence.
This protocol can be used in a study with a between-subject design, although the answer to the questions “Which design is appropriate? Within subject or between subject?” would be on a case-by-case basis. Generally, a study using the between-subject design can exclude the practice effect that might be observed in this study. However, the between-subject design requires more animals and more time for one study (i.e., if using the protocol in this article, 7−8 h per day would be needed to test all the rats in 1 day using one apparatus). A study that uses the within-subject design can reduce the number of animals required and time for one study, but the experimenter must control the effect of practice. Time and cost should be carefully weighed before the experimenter choses the experimental design.
With minor modification, this task can be applied to investigate the effect of co-action or social facilitation by mirror10 and other social situations that have been studied in humans on the performance speed and performance accuracy of rats. To investigate the effect of co-action, separate the lever in the central partition into two levers, and arrange the levers so that each lever can be pulled by one side of the box. To investigate the effect of using a mirror, change the acrylic clear wall on the confederate’s side of the box to the mirror. In the same manner, the effect of an invisible confederate behind the opaque wall could be investigated. Future studies using these modifications will contribute to comprehensively understanding social facilitation by multifaceted comparison of motor performance between species.
Disclosures
The authors have nothing to disclose.
Acknowledgements
This work was supported by a Grant-in-Aid for Scientific Research (KAKENHI) to Y.S. (grant number: JP18J10733) from the Japan Society for the Promotion of Science.
Materials
| Name | Company | Catalog Number | Comments |
|---|---|---|---|
| 45 mg Dustless Precision Pellets Rodent, Purified | Bio-Serv. | F0021 | |
| Arduino Mega 2560 REV3 | Arduino S.r.l. | None | |
| Pellets Dispenser with Feeder (Rats) | Harvard Apparatus | 76-0353 | |
| Power DVD 14 | CyberLink | None | Use an adequate video playback program which enables frame-by-frame playback. |
| Run-and-pull task apparatus | Bio Medica Corp. | Custom-made item | The set of apparatus (box), an air compressor, and a control device for air cylinders which receives inputs from Arduino. |
| Video camera | JVC | GZ-R300 |
References
- Allport, F. H. Social Psychology. , Houghton Mifflin. New York, NY. (1924).
- Guerin, B. Social Facilitation. , Cambridge University Press. Cambridge, UK. (1993).
- Zajonc, R. B. Social facilitation. Science. 149 (3681), 269-274 (1965).
- Markus, H. The effect of mere presence on social facilitation: an unobtrusive test. The Journal of Social Psychology. 14 (4), 389-397 (1978).
- Schmitt, B. H., Gilovich, T., Goore, N., Joseph, L. Mere presence and social facilitation: one more time. The Journal of Experimental Social Psychology. 22 (3), 242-248 (1986).
- Pinto, A., Oates, J., Grutter, A., Bshary, R. Cleaner wrasses Labroides dimidiatus are more cooperative in the presence of an audience. Current Biology. 21 (13), 1140-1144 (2011).
- Gipson, C. D., et al. Social facilitation of d-amphetamine self-administration in rats. Experimental and Clinical Psychopharmacology. 19 (6), 409-419 (2011).
- Levine, J. M., Zentall, T. R. Effect of a conspecific's presence on deprived rats' performance: social facilitation vs distraction/imitation. Animal Learning & Behavior. 2 (2), 119-122 (1974).
- Reynaud, A. J., Guedj, C., Hadj-Bouziane, F., Meunier, M., Monfardini, E. Social facilitation of cognition in Rhesus monkeys: audience vs. coaction. Frontiers in Behavioral Neuroscience. 9, 328(2015).
- Innes, J. M., Gordon, M. I. The effects of mere presence and a mirror on performance of a motor task. The Journal of Social Psychology. 125 (4), 479-484 (1985).
- Bond, C. F., Titus, L. J. Social facilitation: a meta-analysis of 241 studies. Psychological Bulletin. 94 (2), 265-292 (1983).
- Strauss, B. Social facilitation in motor tasks: a review of research and theory. Psychology of Sport and Exercise. 3 (3), 237-256 (2002).
- Sekiguchi, Y., Hata, T. Effects of the mere presence of conspecifics on the motor performance of rats: higher speed and lower accuracy. Behavioural Processes. 159, 1-8 (2019).
- Ogura, Y., Matsushima, T. Social facilitation revisited: increase in foraging efforts and synchronization of running in domestic chicks. Frontiers in Neuroscience. 5, 91(2011).
- Dorfman, A., Nielbo, K. L., Eilam, D. Traveling companions add complexity and hinder performance in the spatial behavior of rats. PLoS One. 11, e0146137(2016).
- Takano, Y., Ukezono, M. An experimental task to examine the mirror system in rats. Scientific Reports. 4, 6652(2014).
- Metz, G. A., Whishaw, I. Q. Skilled reaching an action pattern: stability in rat (Rattus norvegicus) grasping movements as a function of changing food pellet size. Behavioural Brain Research. 116 (2), 111-122 (2000).
- Cohen, J. Statistical Power Analysis for the Behavioral Sciences. , Second Edition, Erlbaum. Hillsdale, NJ. (1988).
Reprints and Permissions
