Here, we present a method to investigate diurnal rhythms in performance following accurate categorization of participants into circadian phenotype groups based on the Munich ChronoType Questionnaire, gold standard circadian phase biomarkers and actigraphic measures.
Method Article
Human Circadian Phenotyping and Diurnal Performance Testing in the Real World
In This Article
Summary
Abstract
In our continuously developing 'around the clock' society, there is a need to increase our understanding of how changes in biology, physiology and psychology influence our health and performance. Embedded within this challenge, is the increasing need to account for individual differences in sleep and circadian rhythms, as well as to explore the impact of time of day on performance in the real world. There are a number of ways to measure sleep and circadian rhythms from subjective questionnaire-based methods to objective sleep/wake monitoring, actigraphy and analysis of biological samples. This paper proposes a protocol that combines multiple techniques to categorize individuals into Early, Intermediate or Late circadian phenotype groups (ECPs/ICPs/LCPs) and recommends how to conduct diurnal performance testing in the field. Representative results show large differences in rest-activity patterns derived from actigraphy, circadian phase (dim light melatonin onset and peak time of cortisol awakening response) between circadian phenotypes. In addition, significant differences in diurnal performance rhythms between ECPs and LCPs emphasizes the need to account for circadian phenotype. In summary, despite the difficulties in controlling influencing factors, this protocol allows a real-world assessment of the impact of circadian phenotype on performance. This paper presents a simple method to assess circadian phenotype in the field and supports the need to consider time of day when designing performance studies.
Introduction
At the behavioral level, assessing individual rest/activity patterns can be done using subjective questionnaire-based methods or objective monitoring through wrist actigraphy. Actigraphic data have been validated against polysomnography (PSG) for various sleep parameters including: total sleep time, sleep efficiency and wake after sleep onset1. Although PSG is known as the gold standard for measuring sleep, it is challenging to use for prolonged periods outside of the sleep laboratory2. Therefore, actigraphs are intended to provide a simple, more cost-effective alternative to PSG and allow monitoring of 24 h rest/activity pattern. Subjective self-report measures can define one's 'chronotype' using the Munich ChronoType Questionnaire (MCTQ)3, or diurnal preference using the Morningness-Eveningness Questionnaire (MEQ)4. The groups at either end of this spectrum can be referred to as Early circadian phenotypes (ECPs) and Late circadian phenotypes (LCPs) with those in between as Intermediate circadian phenotypes (ICPs).
Although ECPs and LCPs are clearly distinguishable through their behavior (i.e., sleep/wake patterns), these individual differences are also partly driven by variations in physiology5 and genetic predisposition6,7. Physiological biomarkers are often used to determine the circadian phase/timing of an individual. Two of the main hormones indicative of circadian timing are melatonin, which rises in the evening to reach a peak in the middle of the night, and cortisol, which peaks in the morning8. Using these circadian phase markers, individual differences in sleep-wake patterns are able to be identified. For example, dim light melatonin onset (DLMO)9,10 and the time of cortisol awakening response11,12 peak earlier in ECPs, which is mirrored by the circadian rhythm of core body temperature13. Saliva allows easy, safe and noninvasive collection from which these hormones can be analyzed by radioimmunoassay (RIA) or enzyme-linked immunosorbent assay (ELISA) without the need to extract any cellular material. RIA and ELISA are sensitive and specific assays that detect concentrations of antigens in biological samples (e.g., blood, plasma or saliva), through antigen-antibody reactions involving radiolabeled isotopes (e.g., iodine (125I) or enzyme-linked antibodies14).
Strictly controlled laboratory protocols such as constant routine (CR) and forced desynchrony (FD) are the gold standard in the field of chronobiology to study endogenous circadian rhythms15. However, there is an increasing need to study individuals in their home environment outside of artificial laboratory settings to gather contextual data and increase the external validity of results. Hence, we require better ways to categorize, measure and assess individual differences in the field. In addition, diurnal variations in various measures of physical (aerobic capacity, muscle strength) and cognitive (reaction time, sustained attention, executive function) performance have been uncovered with ECPs performing better earlier in the day and LCPs in the evening16,17. This emphasizes that time of day and circadian phenotype should be factors that are considered when carrying out performance testing in research studies.
The number of different measures and protocols used in laboratory studies allow highly controlled conditions to be implemented. Field studies tend to be more challenging due to the number of influencing factors. Therefore, using a more holistic approach by combining multiple techniques may provide more accuracy when monitoring an individual's behavior, psychology and performance in their home environment18. Here, we discuss a method that can easily be implemented in the field to identify individual differences in circadian phenotypes using the MCTQ, actigraphy and physiological biomarkers. We hypothesize that these variables will differ significantly between circadian phenotype groups and will be significantly correlated with chronotype (= corrected mid-sleep on free days (MSFsc) gathered from the MCTQ). Furthermore, we suggest ways to measure diurnal performance, highlighting the need to analyze data separately for each circadian phenotype group. We hypothesize that differences in diurnal performance rhythms will be obscured if data are only analyzed at the whole population level.
Protocol
All methods described here have been approved by the University of Birmingham Research Ethics Committee.
1. Participant screening and experimental design
- Perform all methods following the appropriate ethical approvals, in accordance with the Declaration of Helsinki and gain written informed consent from all participants before any involvement.
- Recruit participants with no prior diagnoses of sleep, neurological or psychiatric disorders, and without taking any medications that affect sleep, melatonin or cortisol rhythms.
- Ensure that no participants are shift workers, participants have not travelled more than two time zones within the past month and they are free to take part in the study (i.e., able to commit to wearing the actiwatch, give saliva samples on a 'free day' and be present for performance testing at specific times (see section 2.1)).
- Invite participants who pass inclusion criteria to attend an initial set up meeting to gain consent, collect questionnaire data, receive training in collecting saliva samples at home and be set up with an actigraphic device and sleep diary. At this meeting, familiarize the participants with the physiological sampling protocols to make sure they understand what is required (see section 3).
- Ask the participants to complete the Munich ChronoType Questionnaire (MCTQ), which assesses individual differences in sleep/wake variables and light exposure on work and free days3. This allows the calculation of corrected mid-sleep times on free days (MSFsc), used as a marker of chronotype.
2. Actigraphy and sleep diaries
- For at least two-weeks19 (can be longer time periods depending on the study aims), ask the participants to wear a wrist activity monitor or 'actigraph', to gather rest/activity patterns, and light (1-32,000 lux) data throughout the study period.
- Give each participant details of how to use the actigraphs, including removing for bathing/showering (if not waterproof) and preventing sleeves covering them to allow light data to be gathered. Ensure actigraphs are worn on the non-dominant wrist.
- In combination with actigraphy and to facilitate sleep/wake analysis derived from the actigraphic data, give each participant a sleep diary to complete on a daily basis. Ensure that questions asked include bedtimes, sleep times, night time awakenings, wake up times, sleep quality, naps and times when actigraphs were removed.
- Collect actigraphy data for rest/activity analysis etting the parameters according to what is required (this study used a 30Hz sampling frequency and medium sensitivity setting). Extract details of daily bedtime and get up times from sleep diaries and input to the manufacturer's software or alternative (e.g., open source validated code in order to obtain actigraphic variables relevant for the study).
3. Physiological sampling
- Pre-prepare sampling packs by labelling polypropylene collection tubes or salivettes (use 7 mL plastic bijous in this study). Label the tubes with participant ID number, morning or evening and individual sampling numbers. Include a 'spare' tube to use in case of mistakes.
- Prepare a sample collection record sheet for both morning and evening protocols to allow the participants to time stamp when samples are taken (e.g., Morning Sample 1, Time taken = hh:mm, Morning Sample 2, Time taken = hh:mm). Include participant ID number, date for seasonal information and location for calculating photoperiod.
NOTE: It is crucial that military time is used to ensure that there are no issues with AM/PM. Different colored labels for morning vs. evening sampling tubes can also be used to distinguish between samples. - Give the participants the relevant protocols for physiological sampling and pre-made packs during training of how to take saliva samples in their home/work environment.
- Inform the participant that samples must be collected on a free day when the participants are able to go to bed and wake up at preferred times (i.e., without the need for an alarm). To ensure reliable calculation of DLMO, participants should not perform the evening saliva sampling protocol the day before the performance testing due to the need to stay awake past habitual bedtime.
- Ask the participants to allocate one morning and one evening (on the same day) during week two of the study when they are able to commit to giving the saliva samples. Advise the participants to collect morning samples followed by evening samples on the same day.
NOTE: The order of sampling (morning then evening) must be followed to ensure any changes in sleep timing do not impact the results (if evening samples are taken first requiring staying awake past habitual bedtime, this could influence the mornings samples if taken the following day). - Morning sampling protocol for cortisol awakening response
- Ensure that saliva samples are collected at point of first wake up (whilst still in bed), every 15 min for the first hour and then every 30 min for the next 1 to 2 h. Collect saliva samples by spitting into the appropriately labelled vial (starting with No. 1, 2, 3, etc.).
- During this period, ensure that the participants: abstain from alcoholic drinks, drinks containing artificial coloring and food for the period of testing and refrain from cleaning teeth, with or without toothpaste during the sampling period.
- Once all samples have been provided, ensure that the participants store their samples in their freezer at -20 °C until collection by the research team.
NOTE: It is best to store the samples frozen if possible, but they will remain viable if stored in the fridge until collection the next day. Under the Human Tissue Act (HTA) 2004, samples must be collected and processed within seven days of collection to render them acellular, unless an HTA license is held by the Institution performing the analysis.
- Evening sampling protocol for dim light melatonin onset
- Ensure that saliva samples are collected every 30 min from 3 to 4 h before habitual bedtime until 1 to 2 h after habitual bedtime (e.g., if habitual bedtime is 22:00 h, the participant would start at 18:00/19:00 h until 23:00/00:00 h). Collect saliva samples by spitting into in the appropriately labelled vial (starting with No. 1 then 2, 3, etc.).
- During this period, ensure that participants: abstain from caffeinated drinks (e.g., tea, coffee, coca-cola) from 6 h prior to habitual bedtime (e.g., if habitual bedtime is 22:00 h, caffeine consumption should stop at 16:00 h on the day of collection).
- Ensure that the participants remain seated indoors in dim light (< 10 lux, e.g., a single table lamp preferably red light, on the other side of the room, no overhead lights, no electronic screens, curtains closed). Ensure that the participants avoid drinking beverages containing alcohol or artificial coloring and refrain from cleaning teeth, with or without toothpaste, during the sampling period.
- If the participants wish to eat something, go to the toilet or make a non-caffeinated drink, ensure that they do so immediately after collection of a sample and try to be seated again for 15 min before the next sample is due to be collected. If food is consumed between samples, ensure the participants wash their mouths out with water 15 min prior to collection of the next sample.
- Ensure that all other rooms have the same light conditions so that the participant remains in dim light (preferably red light) for the duration of the sampling period.
- Once all samples have been provided, ensure that the participants store their samples in their freezer at -20 °C until collection by the research team.
NOTE: It is critical that participants adhere to dim light protocol. Where possible, researchers should measure the light conditions in order to monitor intensity and spectral composition.
4. Radioimmunoassay
- Perform RIA or ELISA of melatonin and cortisol in human saliva to determine relative concentrations at each time point.
NOTE: The procedure in these representative results used RIA with an Iodine (125I) radioactive labelled tracer and solid phase separation. This protocol is employed routinely in the Chronobiology Laboratory, University of Surrey, UK20. - Calculate individual DLMOs as the timepoint at which melatonin concentration exceeds two standard deviations of the three baseline measures (the first three samples).
NOTE: This method adjusts for individual baseline differences compared to using a flat rate concentration14. Other methods can be used depending on the time points used in the sampling (e.g., over a 24 h period for a full profile14). - Calculate the cortisol peak as the time of highest cortisol concentration recorded during the morning cortisol awakening response.
5. Diurnal performance testing
NOTE: The measures that were used in this protocol are the Psychomotor Vigilance Task (PVT)21, and the Karolinska Sleepiness Scale (KSS)22. However, other tests could be used keeping the same design depending on the aim of the study (e.g., if the study was investigating the impact of circadian phenotype on working memory, a memory task would be required).
- Ask the participants to perform at least one (depending on the task) practice trial during the week prior to testing to familiarize themselves with the set up.
NOTE: Practice trials can be done remotely if monitored. The number of practice tests should be tailored based on the task(s) being used in the study. For example, a more complex executive function task may require a number of practice tests to reach a plateau compared to a simpler task. - Arrange testing sessions according to the study hypotheses based on number of time points being investigated at specific clock times.
NOTE: Depending on the study design, performance testing can be conducted at home or in the laboratory. Due to the time sensitive nature of the protocol, if performance testing is done in the home environment, compliance must be monitored to ensure participants are conducting it themselves, as well as being time and date stamped. - Conduct testing on a relevant device (this study used a DQ67OW, i7-2600 processor, 4GB RAM, 32-bit desktop with a standard keyboard and mouse).
NOTE: If a laptop, iPad or other device is required for testing, ensure the same device and settings are used throughout the study for all participants and each testing session due to potential variability in responses from a mouse vs. track pad vs. touch screen.
6. Analysis
- Categorize circadian phenotype groups based on their value for the five variables collected: MSFsc, wake up time, peak time of cortisol awakening response, DLMO and sleep onset (cut offs are given in Table 1).
- Allocate a score per variable for each participant. A variable is allocated 0 if it is in the ECP category, 1 if it is in the ICP category and 2 if it is in the LCP category. For example, if a participant is in the LCP category for all variables, they would accumulate a score of 10. Out of a total score from 0-10 identify participants as ECPs (0-3), ICPs (4-6) and LCPs (7-10).
- From the total score, subcategories of circadian phenotypes can be determined as follows: 0 = extreme ECP, 1 = definite ECP, 2 = moderate ECP, 3 = mild ECP, 4 = early ICP, 5 = ICP, 6 = late ICP, 7 = mild LCP, 8 = moderate LCP, 9 = definite.
NOTE: Statistical analysis should be determined based on the research questions for individual studies. Non-parametric tests should be used where data do not follow a normal distribution. Post hoc tests should be run to determine time of day effects. When measuring a number of parameters, further corrections of multiple comparisons should be done (e.g., FDR correction of p-values).
Results
These results in ECPs and LCPs have previously been published by Facer-Childs, Campos, et al.23. All permissions have been obtained from the publisher. For studies requiring an investigation of all three groups (Early, Intermediate and Late), the same methods and cut offs can be used.
Circadian Phenotyping (Table 1, Table 2 and Figure 1)
The first hypothesis presented in this paper is that the groups would differ significantly in sleep and circadian variables. From the participants (n = 22) that took part in this study, those that were categorized as ECPs had a score between 0-1 and all LCPs between 8-10 (cuts off given in Table 1). To confirm these results, group averages were compared for each variable. MSFsc was 02:24 ± 00:10 h for ECPs compared to 06:52 ± 00:17 h in LCPs (t(36) = 12.2, p < 0.0001). Physiological markers also differed significantly between the two groups. DLMO occurred at 20:27 ± 00:16 h in ECPs and at 23:55 ± 00:26 h in LCPS (t(30) = 6.8, p < 0.0001). Peak time of the cortisol awakening response occurred at 07:04 ± 00:16 h in ECPs and 11:13 ± 00:23 h in LCPs (t(36) = 8.0, p < 0.0001). The same relationships were observed with actigraphic variables for sleep onset and wake up timings with average sleep onset occurring at 22:57 ± 00:10 h in ECPs and 02:27 ± 00:19 h in LCPs (t(34) = 8.9, p < 0.0001) and wake up time occurring at 06:33 ± 0.10 h in ECPs and 10:13 ± 00:18 h in LCPs (t(34) = 9.9, p < 0.0001). Other sleep variables including duration, efficiency and latency did not differ significantly between the groups (Table 2).
The second hypothesis is that MSFsc gathered from the MCTQ would be significantly correlated with the gold standard actigraphic and circadian phase biomarkers. Figure 1 shows that MSFsc was significantly correlated with DLMO (R2 = 0.65, p < 0.0001), peak time of cortisol awakening response (R2 = 0.75, p < 0.0001), sleep onset (R2 = 0.80, p < 0.0001) and wake up time (R2 = 0.86, p < 0.0001).
These representative results show that the different circadian phenotype groups have clear differences in sleep onset/offset (i.e., wake up time), as well as in physiological variables (DLMO and peak time of morning cortisol).
Diurnal Testing (Figure 2)
It was hypothesized that by testing multiple times over the course of the day, diurnal rhythms in subjective sleepiness and performance would be able to be identified in each group (ECPs/LCPs). In addition, it was hypothesized that if circadian phenotypes were not considered and data were analyzed at a whole group level only, then diurnal variations would be misrepresented.
Significant diurnal variations were found at the whole group level for the PVT and KSS. PVT performance at the 08:00 h testing session was significantly slower than the 14:00 h test (p = 0.027), as was subjective sleepiness (p = 0.024). Significantly slower PVT performance was also found between 08:00 h and 20:00 h (p = 0.041).
When each group was analyzed separately, significant diurnal variations in PVT performance were found in LCPs but not in ECPs. LCPs were significantly worse at 08:00 h compared to 14:00 h (p = 0.0079) and better at 20:00 h compared to 08:00 h (p = 0.0006). Subjective sleepiness showed significant diurnal variations within each group. ECPs reported higher sleepiness at 20:00 h compared to 08:00 h (p = 0.0054). The opposite was observed in LCPs who reported highest sleepiness at 08:00 h and lowest at 20:00 h. Sleepiness at 08:00 h was significantly higher than 14:00 h and 20:00 h in LCPs (both p < 0.0001).

Figure 1: Linear regression analysis to show relationships between sleep/wake variables using actigraphy and physiological biomarkers. Corrected mid-sleep on free days (MSFsc) is displayed as time of day (h) on the x axis. Early circadian phenotypes (ECPs) are shown in the blue box, Late circadian phenotypes (LCPs) in the red box. (a) Peak time of cortisol awakening response (h), (b) Wake up time (h), (c) Dim light melatonin onset (DLMO) (h), (d) Sleep onset time (h). R2 value is shown in the bottom right corner with significance level displayed at **** = p < 0.0001. This figure has been modified, with permission, from Facer-Childs, et al.23. Please click here to view a larger version of this figure.
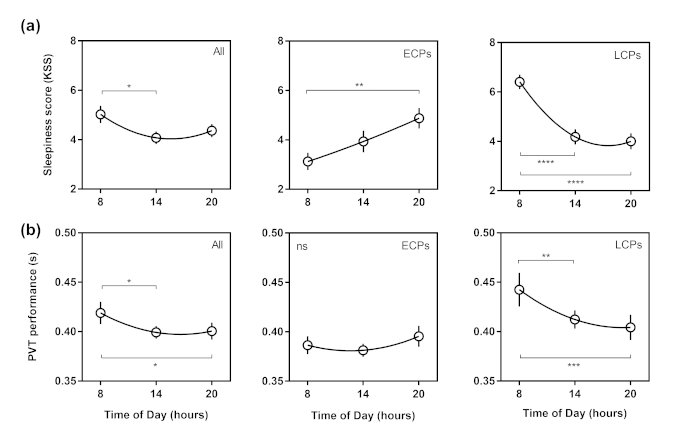
Figure 2: Diurnal variations curves in Karolinska Sleepiness Scale and Psychomotor Vigilance Task (PVT) performance. Time of day (h) is shown on the x axis. Whole group results are shown in the first column, Early circadian phenotypes (ECPs) in the second column and Late circadian phenotypes (LCPs) in the third column. (a) Subjective sleepiness (KSS) score, (b) Reaction time from PVT (s). Second order polynomial non-linear regression curves have been fitted. Significance level is shown as ns (not significant), * (p < 0.05), ** (p < 0.01), *** (p < 0.001) and **** (p < 0.0001). This figure has been modified, with permission, from Facer-Childs, et al.23. Please click here to view a larger version of this figure.
| Variable measured | ECP Category | ICP Category | LCP Category |
| Actigraphic wake up time | < 07:30 h | 07:31 - 08:29 h | > 08:30 h |
| Peak time of morning cortisol | < 08:00 | 08:01 - 08:59 h | > 09:00 h |
| Dim light melatonin onset (DLMO) | < 21:30 h | 21:31 - 22:29 h | > 22.30 h |
| Actigraphic sleep onset | < 23:30 h | 23:31 - 00:29 h | > 00:30 h |
| Corrected mid-sleep on free days (MSFsc) | < 04:00 h | 04:01 - 04:59 h | > 05:00 h |
| Score per variable | 0 | 1 | 2 |
| TOTAL SCORE | 0 - 3 | 4 - 6 | 7 - 10 |
| Subcategories | 0 = extreme ECP 1 = definite ECP 2 = moderate ECP 3 = mild ECP | 4 = early ICP 5 = ICP 6 = late ICP | 7 = mild LCP 8 = moderate LCP 9 = definite LCP 10 = extreme LCP |
Table 1: Categorization cut offs for circadian phenotyping into Early (ECP), Intermediate (ICP) and Late (LCP) groups. Each variable is allocated a score per participant depending on their result and total scores (0-10) allow categorization into each group and each sub-category.
| Variable Measured | ECPs | LCPs | Significance |
| Sample Size | N = 16 | N = 22 | n/a |
| Number of Males/Females | M = 7 | M = 7 | p = 0.51c |
| F = 9 | F = 15 | ||
| Age (years) | 24.69 ± 4.60 | 21.32 ± 3.27 years | p = 0.028a |
| Height (cm) | 171.30 ± 1.97 | 171.10 ± 2.38 | p = 0.97a |
| Weight (kg) | 66.44 ± 2.78 | 67.05 ± 2.10 | p = 0.88a |
| MSFsc (hh:mm) | 02:24 ± 00:10 | 06:52 ± 00:17 | p < 0.0001a |
| Sleep Onset (hh:mm) | 22:57 ± 00:10 | 02:27 ± 00:19 | p < 0.0001a |
| Wake Up Time (hh:mm) | 06:33 ± 0.10 | 10:13 ± 00:18 | p < 0.0001a |
| Sleep Duration (h) | 7.59 ± 0.18 | 7.70 ± 0.14 | p = 0.72a |
| Sleep Efficiency (%) | 79.29 ± 1.96 | 77.23 ± 1.14 | p = 0.46a |
| Sleep Onset Latency (hh:mm) | 00:25 ± 00:06 | 00:25 ± 00:03 | p = 0.30b |
| Phase Angle (hh:mm) | 02:28 ± 00:16 | 02:34 ± 00:18 | p = 0.84a |
| Dim Light Melatonin Onset (hh:mm) | 20:27 ± 00:16 | 23:55 ± 00:26 | p < 0.0001a |
| Cortisol Peak Time (hh:mm) | 07:04 ± 00:16 | 11:13 ± 00:23 | p < 0.0001a |
Table 2: Study variables for circadian phenotype groups; Early (ECPs) and Late (LCPs). Values are shown as mean ± SEM apart from age which is shown as mean ± SD. Corrected mid-sleep on free days (MSFsc) is calculated from the MCTQ. Type of statistical tests used are shown in superscript; parametric testsa, non-parametric testsb and Fisher's exact testc. Phase angle is determined by the difference (h) between dim light melatonin onset (DLMO) and sleep onset. All p values are FDR corrected24. This Table has been modified, with permission, from Facer-Childs, et al.23.
Discussion
Due to the complex interaction of circadian- and sleep-dependent influences on behavior, exploring the relative contributions of each is challenging. Laboratory based protocols are largely unrealistic and expensive, thus hold poorer external validity when relating results to everyday functioning25. Therefore, there is increasing need to study individuals in their home environment to promote generalizability to real-world contexts. Although field studies do not allow for the control of exogenous influences, an integrated approach may help to shed light on how both biological and environmental factors affect health, physiology and performance23,26,27. This protocol was designed specifically to be able to monitor individuals in their home environment whilst following their habitual routines. These saliva sampling protocols have been successfully undertaken in challenging settings such as the Amazon28 and the Antarctic29 supporting the ease of conducting this protocol.
Questionnaires are a useful tool in sleep and circadian studies as they allow a quick and simple way to gather a wide range of information. However, discrepancies between subjective and objective measures can create difficulties when attempting to study individual differences. Therefore, being able to collect multiple subjective and objective measures can strengthen the categorization of circadian phenotype groups. This combination of methods - MCTQ, actigraphy, physiological sampling and performance testing - has highlighted how results can be misinterpreted if individual differences in circadian phenotypes are not considered. Measuring all of these variables provides the most reliable categorization of circadian phenotype groups, however, there is potential for developing the method further to allow fewer requirements. For example, although the reliability remains to be investigated, to reduce the cost, researchers could remove the cortisol sampling step or use a different questionnaire. It would be worth noting, however, that since DLMO is a current gold standard marker for circadian timing and actigraphy is a standard method for monitoring rest/activity patterns, this would be essential variables to include in assessments.
Scheduling performance tests based on clock times instead of basing timings relative to the individual (internal biological time) increases the feasibility and allows the protocol to be applied in real world settings. A limitation of this design, however, is the inability to determine the influence of the circadian system vs. homeostatic influences. This becomes a challenge as there is no way of confirming specific mechanisms contributing to the results. However, since the purpose of this protocol is to investigate these groups in a real-world scenario, reducing the sleep dependent mechanisms would minimize the external validity of the results. It could be argued, therefore, that using an integrated method is more applicable and more feasible for field studies.
Direct measures of performance are highly relevant to society, but it seems that without taking into consideration the multiple influencing factors, especially the need to group individuals according to their circadian phenotype and sleep pressure, studies could be missing key results.
As discussed, the PVT and KSS have been widely used in many fields of research. The simplicity of the PVT and flexibility in task duration makes it an attractive test to use in circadian and sleep restriction studies requiring multiple testing times, and has been shown to be a sensitive marker of sleep deprivation30,31. Although test accuracy and overall reaction times increase with task duration, the 2 min, 5 min and 10 min PVT tasks all show similar time of day relationships32.
Our protocol design could be implemented using a range of different performance tasks and at more frequent time points if required. Previous studies have shown time of day effects in both physical and cognitive performance metrics such as aerobic capacity15 and executive function25. Implementing this protocol and accounting for individual differences will increase understanding of how to study the mechanisms contributing to performance, especially in more niche settings such as elite sports. In summary, this protocol allows a real-world assessment of circadian phenotype and provides an insight into how to measure the impact of time of day on performance.
Disclosures
B.M. and D.J.S. are co-directors of Stockgrand Ltd. The authors declare no other competing financial interests.
Acknowledgements
This work was supported by funding from the Biotechnology and Biological Sciences Research Council (BBSRC, BB/J014532/1) and the Engineering and Physical Sciences Research Council (EPSRC, EP/J002909/1). E.R.F.C was supported by a Wellcome Trust Institutional Strategic Support Fund (ISSF) Scheme accelerator fellowship (Wellcome 204846/Z/16/Z) and an Australian Government, Department of Industry, Innovation and Science grant (ICG000899/19/0602). Our sincere thanks are to all participants and Stockgrand Ltd for assay reagents.
Materials
| Name | Company | Catalog Number | Comments |
|---|---|---|---|
| Actiwatch Light | Cambridge Neurotech Ltd | Various different validated actigraph devices can be used depending on what is required | |
| Sleep Analysis 7 Software | Cambridge Neurotech Ltd | Various different validated software can be used depending on what is required | |
| 7 ml plastic bijous | Various different tubes or salivettes can be used depending on what is required | ||
| DQ67OW, Intel Core i7-2600 processor, 4GB RAM, 32-bit Windows 7 | Various different devices can be used depending on what is required |
References
- de Souza, L., et al. Further Validation of Actigraphy for Sleep Studies. Sleep. 26 (1), 81-85 (2003).
- Kushida, C. A., et al. Comparison of actigraphic, polysomnographic, and subjective assessment of sleep parameters in sleep-disordered patients. Sleep Medicine. 2 (5), 389-396 (2001).
- Roenneberg, T., Wirz-Justice, A., Merrow, M. Life between clocks: daily temporal patterns of human chronotypes. Journal of Biological Rhythms. 18 (1), 80-90 (2003).
- Horne, J. A., Ostberg, O. A self-assessment questionnaire to determine morningness-eveningness in human circadian rhythms. International Journal of Chronobiology. 4 (2), 97-110 (1976).
- Brown, S. A., et al. Molecular insights into human daily behavior. Proceedings of the National Academy of Sciences. 105 (5), 1602-1607 (2008).
- Allebrandt, K., Roenneberg, T. The search for circadian clock components in humans: new perspectives for association studies. Brazilian Journal of Medical and Biological Research. 41 (8), 716-721 (2008).
- Lane, J. M., et al. Genome-wide association analysis identifies novel loci for chronotype in 100,420 individuals from the UK Biobank. Nature Communications. 7, 10889(2016).
- Gunn, P. J., Middleton, B., Davies, S. K., Revell, V. L., Skene, D. J. Sex differences in the circadian profiles of melatonin and cortisol in plasma and urine matrices under constant routine conditions. Chronobiology International. 33 (1), 39-50 (2016).
- Burgess, H. J., Fogg, L. F. Individual differences in the amount and timing of salivary melatonin secretion. PLoS One. 3 (8), e3055(2008).
- Voultsios, A., Kennaway, D. J., Dawson, D. Salivary melatonin as a circadian phase marker: validation and comparison to plasma melatonin. Journal of Biological Rhythms. 12 (5), 457-466 (1997).
- Bailey, S. L., Heitkemper, M. M. Circadian rhythmicity of cortisol and body temperature: morningness-eveningness effects. Chronobiology International. 18 (2), 249-261 (2001).
- Kudielka, B. M., Federenko, I. S., Hellhammer, D. H., Wüst, S. Morningness and eveningness: the free cortisol rise after awakening in "early birds" and "night owls". Biological psychology. 72 (2), 141-146 (2006).
- Baehr, E. K., Revelle, W., Eastman, C. I. Individual differences in the phase and amplitude of the human circadian temperature rhythm: with an emphasis on morningness-eveningness. Journal of sleep research. 9 (2), 117-127 (2000).
- Benloucif, S., et al. Measuring melatonin in humans. Journal of Clinical Sleep Medicine. 4 (1), 66-69 (2008).
- Blatter, K., Cajochen, C. Circadian rhythms in cognitive performance: Methodological constraints, protocols, theoretical underpinnings. Physiology & behavior. 90 (2-3), 196-208 (2007).
- Facer-Childs, E., Brandstaetter, R. The Impact of Circadian Phenotype and Time since Awakening on Diurnal Performance in Athletes. Current Biology. 25 (4), 518-522 (2015).
- Schmidt, C., et al. Circadian preference modulates the neural substrate of conflict processing across the day. PLoS One. 7 (1), e29658(2012).
- Hofstra, W. A., de Weerd, A. W. How to assess circadian rhythm in humans: a review of literature. Epilepsy & Behavior. 13 (3), 438-444 (2008).
- Van Someren, E. J. Improving actigraphic sleep estimates in insomnia and dementia: how many nights? Journal of sleep research. 16 (3), 269-275 (2007).
- Moreno, C., et al. Sleep patterns in Amazon rubber tappers with and without electric light at home. Scientific Reports. 5, 14074(2015).
- Dinges, D. F., Powell, J. W. Microcomputer analyses of performance on a portable, simple visual RT task during sustained operations. Behavior Research Methods, Instruments, & Computers. 17 (6), 652-655 (1985).
- Åkerstedt, T., Gillberg, M. Subjective and objective sleepiness in the active individual. International Journal of Neuroscience. 52 (1-2), 29-37 (1990).
- Facer-Childs, E. R., Campos, B. M., Middleton, B., Skene, D. J., Bagshaw, A. P. Circadian phenotype impacts the brain's resting-state functional connectivity, attentional performance, and sleepiness. Sleep. 42 (5), (2019).
- Benjamini, Y., Hochberg, Y. Controlling the false discovery rate: a practical and powerful approach to multiple testing. Journal of the royal statistical society. Series B (Methodological). , 289-300 (1995).
- Zee, P. C., et al. Strategic Opportunities in Sleep and Circadian Research: Report of the Joint Task Force of the Sleep Research Society and American Academy of Sleep Medicine. Sleep. 37 (2), 219-227 (2014).
- Facer-Childs, E. R., Boiling, S., Balanos, G. M. The effects of time of day and chronotype on cognitive and physical performance in healthy volunteers. Sports Medicine Open. 4 (1), 47(2018).
- Facer-Childs, E. R., Middleton, B., Skene, D. J., Bagshaw, A. P. Resetting the late timing of 'night owls' has a positive impact on mental health and performance. Sleep Medicine. , (2019).
- Moreno, C. R., et al. Sleep patterns in Amazon rubber tappers with and without electric light at home. Scientific Reports. 5, 14074(2015).
- Arendt, J., Middleton, B. Human seasonal and circadian studies in Antarctica (Halley, 75 degrees S)). General and Comparative Endocrinology. 258, 250-258 (2018).
- Basner, M., Dinges, D. F. Maximizing sensitivity of the psychomotor vigilance test (PVT) to sleep loss. Sleep. 34 (5), 581-591 (2011).
- Basner, M., Mollicone, D., Dinges, D. F. Validity and Sensitivity of a Brief Psychomotor Vigilance Test (PVT-B) to Total and Partial Sleep Deprivation. Acta Astronautica. 69 (11-12), 949-959 (2011).
- Loh, S., Lamond, N., Dorrian, J., Roach, G., Dawson, D. The validity of psychomotor vigilance tasks of less than 10-minute duration. Behaviour research methods instruments and computers. 36 (2), 339-346 (2004).
Reprints and Permissions
