This protocol presents an integrated Raman spectroscopy-mass spectrometry (MS) platform that is capable of achieving single-cell resolution. Raman spectroscopy can be used to study cellular response to drugs, while MS can be used for targeted and quantitative analysis of drug uptake and metabolism.
Method Article
An Integrated Raman Spectroscopy and Mass Spectrometry Platform to Study Single-Cell Drug Uptake, Metabolism, and Effects
In This Article
Summary
Abstract
Cells are known to be inherently heterogeneous in their responses to drugs. Therefore, it is essential that single-cell heterogeneity is accounted for in drug discovery studies. This can be achieved by accurately measuring the plethora of cellular interactions between a cell and drug at the single-cell level (i.e., drug uptake, metabolism, and effect). This paper describes a single-cell Raman spectroscopy and mass spectrometry (MS) platform to monitor metabolic changes of cells in response to drugs. Using this platform, metabolic changes in response to the drug can be measured by Raman spectroscopy, while the drug and its metabolite can be quantified using mass spectrometry in the same cell. The results suggest that it is possible to access information about drug uptake, metabolism, and response at a single-cell level.
Introduction
Cells respond differently to changes in their microenvironment at the single-cell level, a phenomenon termed cellular heterogeneity1. Despite this, current drug discovery studies are based on average measurements of cell populations, which obfuscate information about potential subpopulations as well as single-cell variations2. This missing information may explain why some cells are more susceptible to drugs while others are resistant. Interestingly, the lack of single-cell information about drug response is a possible reason for the failure of phase II clinical trials of drugs3. Therefore, to address this issue, cellular interactions with the drug (i.e., uptake, metabolism, and response) must be measured at the single-cell level.
To achieve this, we have designed a unique system in which living single cells are screened using label-free Raman spectroscopy then further characterized using mass spectrometry4. Raman spectroscopy provides a molecular fingerprint of the cellular state, a complex spectrum resulting from the contributions of many molecules inside the cell. Despite this complexity, it can be considered that Raman fingerprints reflect a whole cell's structure and metabolism5,6. Raman spectroscopy excels at measuring cellular states in a noninvasive and relatively high throughput manner, which makes it useful for screening and assessing drug response at the single-cell level.
In contrast, MS provides the required sensitivity and selectivity for measuring drug uptake at the single-cell level. Since MS is destructive (the sample [cell] is typically consumed during analysis), integrating it with nondestructive, label-free Raman spectroscopy can provide a high throughput and sensitive system. This combined platform is capable of providing more information about drug uptake, metabolism, and effects at the single-cell level.
This manuscript elucidates a protocol used to study cellular interactions with drugs at the single-cell level using in vitro cultures by using an integrated Raman-MS platform. To do so, hepatocellular carcinoma cells (HepG2) and tamoxifen are used as a model. HepG2 cells were chosen because they take up tamoxifen and metabolize the drug, and they are simultaneously affected due to its hepatotoxic effects. Two states are used in this manuscript: drug-treated cells vs. non-treated cells (control).
Protocol
1. Cell culture
- Culture cells of interest in an appropriate culture media. Penicillin-streptomycin may be added to avoid contamination. In the case of HepG2 cells, culture cells in a culture media containing Dulbecco's modified Eagle's medium (DMEM) supplemented with 10% fetal bovine serum (FBS) and 0.1% penicillin-streptomycin. To faciltate Raman spectroscopy measurements, cells can be grown on a 0.1% gelatin-coated glass-bottom dish or quartz slides.
- Incubate cells for 2 days at 37 °C and 5% CO2 in a humidified incubator.
- Synchronize cell cultures to reach 70% confluency.
- Subculture cells into a 35 mm glass-bottom grid dish or quartz slides using the same medium at a seeding density of 0.7 x 10⁶, then incubate at 37 °C for 24 h.
NOTE: Culture dishes or slides can be pre-coated with collagen or gelatin coating solution with a culture surface ratio of 5 ug/cm2 to allow them to fix, ensuring their survival during measurement.
2. Drug treatment
- Remove cell cultures from the incubator and wash 2x with prewarmed PBS buffer (37 °C).
NOTE: It is optimal to remove cells for drug treatment at a confluency of 50%-60%. - Divide cells into drug-treated and untreated subgroups in 35 mm culture dishes.
- Mix the drug of choice with the culture media. For example, dissolve tamoxifen in dimethyl sulfoxide (DMSO) and mix with the culture media to obtain a final volume of 2 mL and tamoxifen concentration of 10 µM. This will be the drug-treated group.
- Mix a corresponding volume of solvent (DMSO) into the medium as a control to study the effects of DMSO. This will be the control group.
- Incubate both groups in 2 mL of the spiked media prepared in steps 2.3-2.4 for 24 h. The expected confluency after incubation should be 70%-80%.
3. Raman spectral imaging and spectral processing
NOTE: Although Raman spectroscopy systems are commercially available, the Raman spectroscopy system used here is a home-built line-scanning confocal microscope previously described7,8. Briefly, this system is equipped with a 532 nm diode pumped solid-state laser. The laser light is shaped into a plane using a cylindrical lens, which allows measurement of 400 spectra in a single exposure. Raman spectra were recorded using a cooled CCD camera mounted on a polychromator that uses a 1,200 grooves/mm grating to maximize the spectral resolution of the fingerprint region (from 500-1,800 cm-1). This spectral area contains a high density of frequencies specific to molecules that generates Raman scattering. A water-immersionobjective lens (NA = 0.95) is also used. The spatial resolution of this system is ~300 nm and the spectral resolution is 1 cm-1. To ensure cell survival during the experiment, a microchamber fixed onto a motorized microscope stage is used.
- Prior to spectral measurements, verify the alignment of the optics. A 50 µm pinhole can be used to verify that the pinhole and laser position match exactly. Enter the spectrophotometer slit when narrowed as much as possible.
- Use ethanol to calibrate the spectrophotometer prior to each experiment. To do so, place EtOH in a glass-bottom dish, measure the spectrum at a given laser intensity (measured at sample) for 1 s, and associate the peak to known wavelengths7.
- Minimize the laser intensity at the sample to ~2.4 mW/µm2 so that cells survive laser exposure.
- Set up the microchamber at 5% CO2 and 37 °C.
- Once the microscope system is ready, remove cells from the incubator and immediately rinse cells 2x with warmed PBS (37 °C) buffer, then add 2 mL of warmed PBS (37 °C) or DMEM to resuspend the cells.
NOTES: Both PBS and FluoroBrite DMEM-based media are sufficient options for Raman spectroscopy measurements because they produce a minimal background signal. - Add 10 µL of water onto the water-immersion objective lens and delicately place the glass-bottom cell dish onto the microscope stage.
- Measure each cell by focusing the laser line. A 15 s exposure time per cell is sufficient here to obtain a cross-section of a cell with a clear Raman signal. A galvano mirror allows scanning of one cell or a group of cells within several dozen minutes.
NOTES: Higher resolution of full spectral imaging of cells requires more time and can lead to photodamage. Here, cells were measured using a single-line exposure to obtain a cross-section of each cell. This approach is a good trade-off to increase throughput and obtain sufficient information to discriminate cells, while also ensuring cell viability by limiting photodamage.
4. Preprocessing of spectral data and multivariate analyses
NOTE: Preprocessing is a necessary step prior to additional analysis in order to remove unwanted technical variations within the spectral data. Due to diversity of the methods and software, an exhaustive list cannot be provided, and there are many helpful reviews found in the literature7,8. In this section, we briefly describe the approach used to analyze and interpret spectral Raman data obtained from living single cells.
- Extract and preprocess Raman images to remove possible cosmic ray interference.
NOTE: Spectral axis of spectra obtained during different days/weeks/months may include some variations due to small technical variations during calibration using ethanol. This will strongly impact subsequent multivariate analyses and statistical comparisons. In the case that experiments are performed during different weeks/months, small optical variations are expected. In this case, data must be interpolated to correct for eventual spectral shifts of the data across experiments. Interpolation using cubic spline is used here. After this step, all spectra axis should be aligned. A range of 500-1,800 cm-1 is considered for subsequent analysis. - Extract spectral data of cells and background (absence of cells) from each image using a homemade algorithm. Subtract the background signal from the cell's signal. Then, average the spectra of the remaining pixels, which should correspond to a single cell. The following steps are performed using the 2D spectra of cells.
- Perform a baseline correction using the ModPoly9 or any other algorithm that it estimated to fit sufficiently. Trim the spectral range to 600-1,700 cm-1 to select the fingerprint region and ensure that there is no unwanted edge effects on the spectra due to bad polynomial fitting.
- Perform a normalization step such as vector normalization (intensity at each wavenumber is divided by the global l2 norm or maximum singular value of a spectrum) to normalize the spectral intensity10, although other normalizations can be considered.
- Prepare a dataset with the appropriate label for each class/condition.
NOTE: Comparative spectral analyses can be perfored to explore the nature of possible differences among cell class/conditions (e.g., by subtracting the average spectrum of the control group to other groups to identify regions of interest [such as potential biomarkers]). ANOVA and Fisher scores calculations can also be performed10. - To identify treated and untreated cells based on spectral features, multivariate analyses can be applied. A normalized spectral data should be used as a training dataset, and an unknown dataset (without label) from a replicate experiment should be used as test data, if possible.
NOTE: Discriminant analysis performed on some vector of a principal component analysis (PCA-DA10), projection on latent scores followed by discriminant analysis (PLS-DA), and support vector machines (SVM)11 are models often used in the field, and each presents different statistical considerations. Preprocessing of data should be performed consequently. - Use machine learning that fits the experimental objectives. Here, a projection on latent structure (PLS) model is built using the spectral fingerprint region of Raman spectra (600-1,710 cm-1)11,12. Mean-center the data as necessary. For cross-validation of the model, different techniques can be applied.
NOTE: Here, a Venetian blind cross-validation with 10 splits is applied. The model complexity (number of components or latent variable) should be tested so that the best model minimizes the root mean square error (RMSE) value. It was found that three latent vectors (LVs) provided the best discrimination with our dataset. - Identify which Raman spectral peaks contribute to discrimination of the cells (e.g., by plotting the score of variable importance in projection [VIP] for each Raman wavenumber or the magnitude of the regression coefficient).
NOTES: The VIP score of a variable is calculated as a weighted sum of the squared correlations between the PLS-DA components and original variable. Details regarding PLS and VIP scores algorithm can be found in the literature11,12.
5. Single-cell sampling set-up and procedures
- Fix the cell sampling system onto the Raman microscope as shown in Figure 1. Connect the 3D micromanipulator to the glass capillary holder that is attached to an empty syringe for sample sucking by applying negative pressure (Figure 1).
- Set the microscope to a high magnification field (40x) to observe the tip of the glass capillary and make sure it is not broken. Control the position of the glass capillary using the micromanipulator (x-, y-, z-axes). Ensure that the capillary tip is centered in the field of view, then move the capillary up on the z-axis to give clearance for the culture dish later.
NOTE: Microsampling of the cells is performed by the glass capillary for cells with diameters between 10-15 µm. A capillary with a bore size of ~5 µm is recommended. If the bore size is too small, the capillary tip will be plugged by the cell, and if it is too large, the sensitivity of later MS measurements may be compromised. - Place the sample plate/dish on the stage of the microscope, adjust the magnification and focus, select the target cell on the grid dish, and move it into the center of view. Then, carefully lower down the glass capillary using micromanipulator (z-axis) until the tip comes into focus.
NOTE: Be sure not to move the capillary in the x- and y-axes until the capillary is in focus. - Under microscopic observation, touch the target single cell with the capillary tip, then start applying negative pressure using the syringe to trap the cell inside the capillary tip. Record this procedure by taking a photo or video to check the timing and sucked location of the cell precisely, if necessary.
- Move the capillary up on the z-axis. Then, detach the capillary from the capillary holder using forceps in preparation for MS analysis.
6. Mass spectrometry measurements
- Calibrate the mass accuracy of the MS instrument according to the manufacturer's recommendations. After calibration, make sure that the mass error is no greater than 3 ppm.
- Optimize the MS instrument to parameters that are best suited for the analyte of interest.
NOTE: In the case of tamoxifen and 4-OHT analysis, the instrument parameters are set to the following: inlet capillary temperature: 400 °C, spray voltage: 1500 V, automatic gain control target (AGC): 5.00E+06, S-lens RF level: 90%, SIM range: 347-397 m/z, SIM maximum injection time: 200 ms, SIM resolution: 140,000 FWHM, MS/MS range: 50-400 m/z, MS/MS AGC target: 2.00E+05, MS/MS maximum injection time: 100 ms, MS/MS resolution: 17,500 FWHM, MS/MS isolation window: 1 m/z, MS/MS normalized collision energy (NCE): 35. - Set up an automatic acquisition method with a duration of 5 min for SIM mode to achieve relative quantitation, and another MS/MS method for positive identification of the drug and its metabolite. The parameters of the acquisition method should be set to the optimized values mentioned in step 6.2.
- Prepare the ionization solvent under a fume hood. The solvent composition depends on the analyte of interest. Here, the organic solvent used consists of 80% MeOH, 10% DMSO, and 0.1% formic acid.
- Mix an appropriate internal standard with the organic solvent prior to measurements. In this experiment, 5.31 nM of d5-tamoxifen is used as an internal standard.
- To avoid false positives, aspirate the media surrounding the cells treated with the drug using a 1 µm bore-size capillary with constant microscopic observation to avoid sampling any cellular parts.
- Add 2 µL of the ionization solvent to the wide end of the capillary containing the media using a pipette attached to loader tips. Then, analyze the sampled media by MS, check for the presence of the analyte of interest (normally, it should not be detectable).
- Add 2 µL the ionization solvent to the capillary containing the cell, fix the capillary to a nanoelectrospray adapter (nano-ESI) connected to a suitable mass spectrometer, and start the automatic acquisition method.
7. Mass spectrometry data processing and analysis
NOTE: Any suitable software can be used to perform data analysis. However, if researchers wish to perform data analysis using a software that is not provided by the MS vendor, then the raw data should be converted from the proprietary vendor format to an open format or as a text file first (which was done here).
- Normalize the data by dividing the peak area of the analyte of interest(s) by that of the internal standard from the same MS scan. Then, log transform the peak ratios to reduce skewness.
- Plot the normalized intensity of the drug or its metabolite as a boxplot or density curve to visualize distribution across single cells. Here, R statistical software is used, along with the ggplot2 package.
- Calculate the metabolized drug to unmetabolized drug ratio by dividing the abundance of the drug metabolite by that of the unmetabolized parent molecule in each cell (i.e., 4-OHT and tamoxifen, respectively.
NOTE: The correlation between variations of specific Raman peaks of interest and the variations in MS peaks of the drug or its metabolites can be studied. This is an addition to the possible correlation between the drug itself and its metabolite in single cells. This can be done by calculating the Pearson correlation coefficient using a two-tailed test. More advanced integrative approaches should also be considered.
Results
Single-cell analysis of drug interactions (uptake, metabolism, and effects) is essential in uncovering any hidden or drug-resistant subpopulation as well as understanding the effects of cellular heterogeneity. In this protocol, two complementary techniques were used to measure the aforementioned interactions in single cells: Raman spectroscopy and MS. Raman spectrometry rapidly identifies cells affected by drugs based on spectral biomarkers of the drug response. MS is used to monitor the uptake and metabolism of the drug in a selective and semi-quantitative manner. Cells were first screened by Raman spectroscopy then individually sampled for analysis by MS.
A comparative analysis of the average spectrum of each condition (with and without drug treatment) is shown in Figure 2. The averaged spectrum of the two conditions clearly differ at various peaks, which were previously identified and assigned to molecular compounds2. In particular, the peaks at 1000 cm- (assigned to aromatic compounds such as phenylalanine and tyrosine) show strong differences. The significance of the statistical difference should be assessed by further multivariate analyses.
The data set was then used to train a PLS model (steps 4.5-4.8) aimed to distinguish the two cell treatments (with drug: n = 290, without drug: n = 115). The predictive ability to classify the cells cultured in the presence of tamoxifen reached 100% sensitivity and 72% specificity in the test data (unknown from the cross-validated trained model). Sensitivity is a measure of the true positives that are correctly identified by the model, while specificity is a measure of the actual negatives that are identified by the model. Alternative models such as SVMs, LDAs, and neural networks may provide similar or better results, although a comprehensive comparison has not been performed in this study.
Based on the PLS model, the VIP scores were calculated, which represent the importance of wavelengths (Raman shifts) in discriminating the experimental conditions (Figure 3). Importantly, the highest peaks of the VIP profiles corresponded to Raman peaks for which strong differences were seen between the two treatments. This confirmed the specific molecular differences between treated and untreated cells. Consequently, researchers can identify possible spectral biomarkers that reflect the response of single cells to drug treatment. These biomarkers can be tested further to verify their biological relevance and generalization across various conditions and cell lines.
A live single-cell mass spectrometry (LSC-MS) system was able to detect both the drug and its metabolites in single, drug-treated HepG2 cells that were previously measured by Raman spectroscopy. In addition, tandem MS may be used to confirm the structure of both molecules. After positive identification, the relative abundance of the drug and its metabolites were measured in each cell and compared to background peaks in untreated cells. Strong variation was observed in tamoxifen abundance, and this phenomenon was even more pronounced in the case of its metabolite, 4-OHT (Figure 4). The relationship between tamoxifen abundance and its metabolites was also studied, in which a significant positive correlation was found between the two (r = 0.54, p = 0.0001, n = 31).

Figure 1: Cell picking system mounted on a microscope stage. Please click here to view a larger version of this figure.
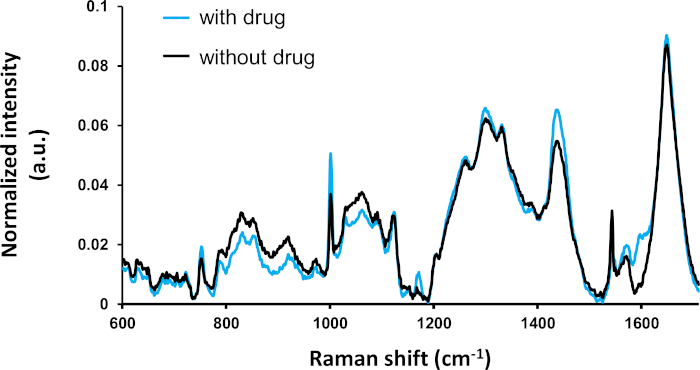
Figure 2: Averaged spectrum of the drug-treated cells (with tamoxifen: n = 295) and untreated cells (without tamoxifen: n = 115). Raman peaks can be identified from the literature. Most of the strong spectral differences are statistically significant (ANOVA, p ≤ 0.5) as described previously4. This figure has been modified from a previous publication4. Please click here to view a larger version of this figure.
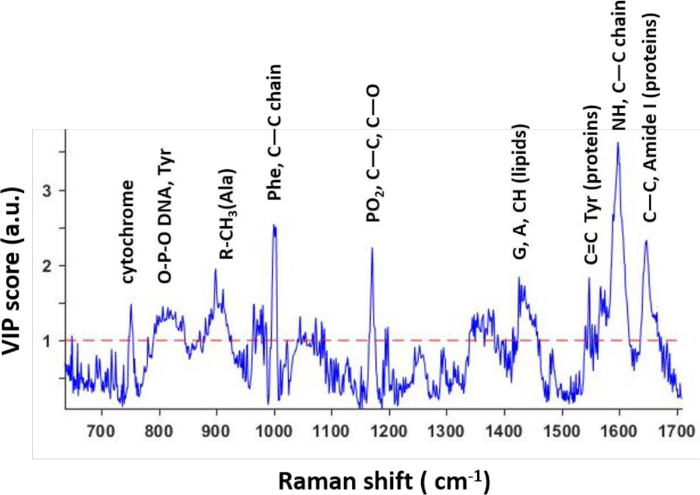
Figure 3: VIP scores extracted from the predictive PLS model. VIP scores reflect the wavelengths that contribute to distinguishing between the two classes in the model. Most of the peaks correspond to specific molecules that are observed as spectral biomarkers of drug effects on drug-treated cells. This figure has been modified from a previous publication4. Please click here to view a larger version of this figure.
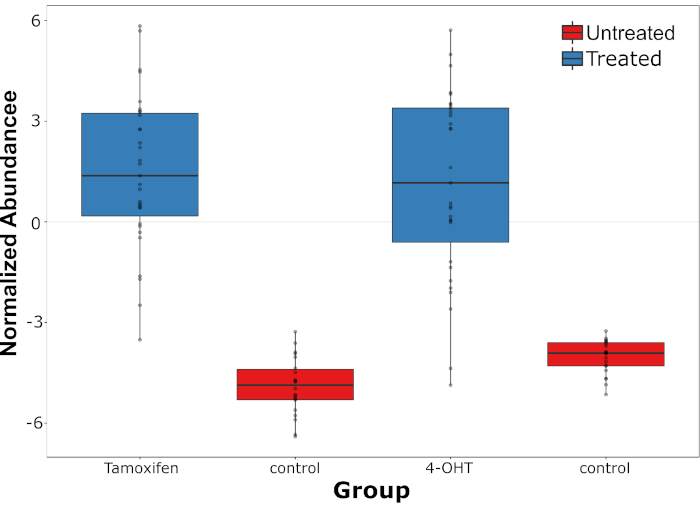
Figure 4: Distribution of tamoxifen abundance and its metabolite. Distribution of tamoxifen abundance and its metabolite, 4-OHT (measured at the single-cell level) compared to endogenous peaks in the untreated cells (control). This figure has been modified from a previous publication4. Please click here to view a larger version of this figure.
Discussion
In this manuscript, a simple case was chosen in which HepG2 cells were exposed (or not) to tamoxifen. The ability of a Raman spectroscopy and mass spectrometry system is demonstrated to monitor the effects of tamoxifen on cells. Raman spectroscopy allowed identification of potential biomarkers that reflected a general response of single cells to drug exposure. Some heterogeneity between single cells was observed, suggesting that some cells did not respond to drug exposure. On the other hand, LSC-MS was capable of performing a targeted analysis of the drug and its metabolite at the single-cell level, in which a high degree of heterogeneity was observed in the drug and its metabolite abundance. This heterogeneity helps explain why some cells are affected by the drug while others are seemingly not, despite the cells originating from a supposedly uniform population12.
Among particular aspects of this technique that require attention, it is important to evaluate the quality of the microscope set-up and signal processing to ensure reproducibility of the data. If preprocessing of the spectra is done carefully, the signal variations should be maximized at the local maximum of each peak. By contrast, the baseline and edge of the spectra should overlap between the tested cell conditions. Another important aspect is the multivariate model used to investigate differences between treatments. One must carefully evaluate the models and model parameters to ensure a precise and accurate analysis. One advantage of the PLS model, unlike neural networks, is that it allows access to the weights associated with each wavelength (Raman shifts) that best distinguish the conditions tested by the model.
Despite Raman spectroscopy successfully discriminating the drug response, it should be stressed that this technique is limited in its use to provide biological interpretation. This is mainly due to the complexity of the spectral signal, which encompasses a mixture of thousands of molecules. Therefore, further investigation is required to evaluate systematic variations between Raman spectral intensities and variations in drug concentrations. Also, similar studies of other cell lines are required to evaluate the generalization of spectral biomarkers associated with tamoxifen.
Furthermore, it may be of interest to perform living tissues measurements to assess pharmacodynamics and study how drugs penetrate and flow within each cell. Furthermore, it should be noted that the sampling step in LSC-MS is highly dependent on the skill of the operator. Parameters such as spatial resolution, cell position inside the capillary after sampling, and throughput strength are wholly operator dependent, which limits large scale adoption of LSC-MS. Although, automated sampling systems may alleviate this issue. Furthermore, while LSC-MS excels at sampling adherent or floating cells in their native states, it performs more poorly in sampling cells embedded in tissue sections. This is due to the sampling capillary tip's tendency to break if the sample density is high. Therefore, another approach such as the single-probe may be more suitable in such cases14,15.
Since the cells used here are sampled in ambient conditions with minimal sample preparation, LSC-MS can be easily integrated with other technologies, as shown by its integration with Raman in this protocol. Another similar integration with 3D holography has allowed for achieving absolute quantitation of cellular metabolites on the subcellular level16. Additionally, integration with flow cytometry has allowed for the uncovering of metabolic biomarkers in single circulating tumor cells of neuroblastoma cancer patients17,18.
In the future, due to recent increasing interest in combining datasets from imaging modalities19, it may also be of interest to study the systematic variations between Raman signals and mass spectrometry results (as well as other omics methods) by using integrative computational approaches. Interestingly, we have already found several weak but significant linear correlations between the intensities of Raman peaks identified by VIP scores and the abundance of tamoxifen or its metabolite at the single-cell level as identified by MS4. This data may suggest a metabolic relationship between MS profiles and Raman spectra and the possibility to predict these values.
Disclosures
The authors declare no conflicts of interest.
Acknowledgements
The authors thank Toshio Yanagida for his support and RIKEN internal collaborative funds attributed to Dr. Arno Germond.
Materials
| Name | Company | Catalog Number | Comments |
|---|---|---|---|
| 0.1% penicillin-streptomycin | Nacalai Tesque | 09367-34 | |
| 35mm glass bottom grid dish | Matsunami | ||
| 4-Hydroxy Tamoxifen standard | Sigma-Aldrich | 94873 | |
| 532 nm diode pumped solid-state laser | Ventus, Laser Quantum | ||
| BIOS-L101T-S motorized microscope stage | OptoSigma | ||
| CT-2 cellomics coated sampling capillaries | HUMANIX | ||
| d5-Tamoxifen standard | Cambridge Isotope Laboratories | ||
| Dimethyl sulfoxide LC-MS grade | Nacalai Tesque | D8418 | |
| Dulbecco's Modified Eagle's medium | Sigma-Aldrich | D5796 | |
| Eppendorf GELoader tips | Eppendorf | ||
| fetal bovine serum | Hyclone laboratories | SH3006603 | |
| FluoroBrite DMEM | Thermo Fisher Scientific | ||
| Formic acid LC-MS grade | Sigma-Aldrich | 33015 | |
| HepG2 cell line (RCB1886) | RIKEN cell bank center | RCB1886 | |
| MC0-19A1C Incubator | Sanyo Electric Co. | MC0-19A1C | |
| Methanol LC-MS grade | Sigma-Aldrich | 1060352500 | |
| MMO-203 3-D Micromanipulator | Narshige | MMO-203 | |
| NA:0.95, UPL40 water-immersion Olympus objective lens | Olympus | ||
| Nanoflex nano-ESI adaptor | Thermo Fisher Scientific | ES071 | |
| On-stage incubator | ibidi | ||
| Pierce LTQ Velos ESI calibration solution | Thermo Fisher Scientific | 88323 | |
| PIXIS BR400 cooled CCD camera | Princeton Instruments | ||
| Q-Exactive Orbitrap | Thermo Fisher Scientific | ||
| Rat-tail collagen coating solution | Cell Applications Inc. | ||
| Tamoxifen standard | Sigma-Aldrich | 85256 |
References
- Altschuler, S. J., et al. Cellular heterogeneity: do differences make a difference? Cell. 141 (4), 559-563 (2010).
- Ali, A., et al. Single-cell metabolomics by mass spectrometry: Advances, challenges, and future applications. TrAC Trends in Analytical Chemistry. , (2019).
- Bunnage, M., et al. Target validation using chemical probes. Nature Chemical Biology. 9 (4), 195-199 (2013).
- Ali, A., et al. Single-Cell Screening of Tamoxifen Abundance and Effect Using Mass Spectrometry and Raman-Spectroscopy. Analytical Chemistry. 91 (4), 2710-2718 (2019).
- Wu, H., et al. In vivo lipidomics using single-cell Raman spectroscopy. Proceedings of the National Academy of Sciences of the United States of America. 108 (9), 3809-3814 (2011).
- Okada, M., et al. Label-free Raman observation of cytochrome c dynamics during apoptosis. Proceedings of the National Academy of Sciences of the United States of America. 109 (1), 28-32 (2012).
- Palonpon, A. F., et al. Raman and SERS microscopy for molecular imaging of live cells. Nature Protocols. 8 (4), 677-692 (2013).
- Butler, H. J., et al. Using Raman spectroscopy to characterize biological materials. Nature Protocols. 11 (4), 664-687 (2016).
- Mark, H., Workman, J. Jr Chemomtrics in Spectroscopy. , Second Edition, Academic Press. (2018).
- Lieber, C. A., Mahadevan-Jansen, A. Automated method for subtraction of fluorescence from biological Raman spectra. Applied Spectroscopy. 57, 1363-1367 (2003).
- Germond, A., et al. Raman spectral signature reflects transcriptomic features of antibiotic resistance in Escherichia coli. Communications Biology. 1, 85(2018).
- Wold, S., et al. Partial Least Squares Projections to Latent Structures (PLS) in Chemistry. Encyclopedia of Computational Chemistry. , (2002).
- Chong, I. G., Jun, C. H. Performance of some variable selection methods when multicollinearity is present. Chemometrics and Intelligent Laboratory Systems. 78, (2005).
- Inde, Z., Dixon, S. J. The impact of non-genetic heterogeneity on cancer cell death. Critical Reviews in Biochemistry and Molecular Biology. 53 (1), 99-114 (2018).
- Pan, N., et al. The single-probe: a miniaturized multifunctional device for single cell mass spectrometry analysis. Analytical chemistry. 86 (19), 9376-9380 (2014).
- Rao, W., et al. Applications of the Single-probe: Mass Spectrometry Imaging and Single Cell Analysis under Ambient Conditions. Journal of Visualized Experiments. (112), e53911(2016).
- Ali, A., et al. Quantitative Live Single-cell Mass Spectrometry with Spatial Evaluation by Three-Dimensional Holographic and Tomographic Laser Microscopy. Analytical Sciences: the International Journal of the Japan Society for Analytical Chemistry. 32 (2), 125-127 (2016).
- Abouleila, Y., et al. Live single cell mass spectrometry reveals cancer-specific metabolic profiles of circulating tumor cells. Cancer Science. 110, 697-706 (2018).
- Hiyama, E., et al. Direct Lipido-Metabolomics of Single Floating Cells for Analysis of Circulating Tumor Cells by Live Single-cell Mass Spectrometry. Analytical Sciences: the International Journal of the Japan Society for Analytical Chemistry. 31 (12), 1215-1217 (2015).
- Ryabchykov, O., et al. Fusion of MALDI Spectrometric Imaging and Raman Spectroscopic Data for the Analysis of Biological Samples. Frontiers in Chemistry. 6, 257(2018).
Reprints and Permissions
