Presented here is a protocol for cell culture on silicon nitride membranes and plunge-freezing prior to X-ray fluorescence imaging with a synchrotron cryogenic X-ray nanoprobe. When only room temperature nano-analysis is provided, the frozen samples can be further freeze-dried. These are critical steps to obtain information on the intracellular elemental composition.
Method Article
Cell Culture on Silicon Nitride Membranes and Cryopreparation for Synchrotron X-ray Fluorescence Nano-analysis
Opens in a new tab
In This Article
Summary
Loading...
$$\rightleftharpoonup{xx}$$
$$\longleftharp{xx}$$,
$$\longrightharp{xx}$$,
Abstract
Loading...
$$\rightleftharpoonup{xx}$$
$$\longleftharp{xx}$$,
$$\longrightharp{xx}$$,
Very little is known about the distribution of metal ions at the subcellular level. However, those chemical elements have essential regulatory functions and their disturbed homeostasis is involved in various diseases. State-of-the-art synchrotron X-ray fluorescence nanoprobes provide the required sensitivity and spatial resolution to elucidate the two-dimensional (2D) and three-dimensional (3D) distribution and concentration of metals inside entire cells at the organelle level. This opens new exciting scientific fields of investigation on the role of metals in the physiopathology of the cell. The cellular preparation is a key and often complex procedure, particularly for basic analysis. Although X-ray fluorescence techniques are now widespread and various preparation methods have been used, very few studies have investigated the preservation of the elemental content of cells at best, and no stepwise detailed protocol for the cryopreparation of adherent cells for X-ray fluorescence nanoprobes has been released so far. This is a description of a protocol that provides the stepwise cellular preparation for fast cryofixation to enable synchrotron X-ray fluorescence nano-analysis of cells in a frozen hydrated state when a cryogenic environment and transfer is available. In case nano-analysis has to be performed at room temperature, an additional procedure for freeze-drying the cryofixed adherent cellular preparation is provided. The proposed protocols have been successfully used in previous works, most recently in studying the 2D and 3D intracellular distribution of an organometallic compound in breast cancer cells.
Introduction
Loading...
$$\rightleftharpoonup{xx}$$
$$\longleftharp{xx}$$,
$$\longrightharp{xx}$$,
Newly designed synchrotron X-ray fluorescence (SR-XRF) nanoprobes allow visualization of the subcellular distribution of elements in a fully quantitative manner. As an example, this analytical capability allows investigation of the uptake of nanoparticles1 or organometallic molecules such as osmium-based complexes2, providing insight into the intracellular uptake of metal-based molecules with potent anticancer properties. As a multielement technique, SR-XRF3 with a nanoprobe provides a way to simultaneously quantify and localize intracellularly most biologically important elements, including phosphorus, sulfur, potassium, calcium, iron, copper, and zinc. Indeed, the use of hard X-rays provides large penetration depth to image whole frozen-hydrated cells in a label-free fashion. Furthermore, providing access to the K-edge of most elements of interest, the X-ray fluorescence is excited most efficiently. The use of cryogenic approaches allows reduction of radiation damage and optimization of the preservation of the cell structure and elemental distribution.
Most available spatially resolved analytical techniques to study metals in cells are surface techniques requiring very thin and flat sections of cells to be produced. This mainly encompasses scanning transmission electron microscopy with energy-dispersive X-ray analysis (STEM–EDX), energy-filtered transmission electron microscopy (EF-TEM), and nanoscale secondary ion mass spectrometry (nanoSIMS). The latter cannot be performed on frozen, hydrated cell sections while cryo-analysis can be done with electron microscopy with unsurpassed spatial resolution but poor elemental sensitivity. Particle-induced X-ray emission (PIXE) has allowed the study of elemental distributions in whole cells. It has the advantage of being fully quantitative with a fair elemental sensitivity at the micron scale and even at submicron resolution4, but suffers from radiation damage and lack of cryogenic capabilities to study frozen-hydrated cells. All these analytical techniques complement each another in the elemental imaging of cells, but for all techniques the sample preparation procedure is a crucial step. It should be kept simple to limit possible contamination as well as elemental redistribution and/or leakage to obtain meaningful results. As demonstrated in electron microscopy, a cryogenic workflow, including cryo-immobilization of the cell and cryotransfer to a cryoscanning stage, allows an optimal elemental preservation at subcellular levels as close as possible to the native state5,6,7,8,9,10. This understanding has been successfully implemented into the development of synchrotron cryo-soft X-ray microscopy (e.g., full field microscopes and scanning microscopes) to produce ultrastructural imaging of entire frozen-hydrated cells in 2D or 3D. Various cryogenic workflows were developed11 for soft X-ray microscopes at Beamline 2.1 (XM-2) of the Advanced Light Source at Lawrence Berkeley National Laboratory12, beamline U41-XM at the electron storage ring BESSY II (Germany)13, beamline MISTRAL of the ALBA light source (Spain)14, and at Beamline B24 of the Diamond light source15, among others. A similar workflow was recently shown to be the most reliable preparation and preservation method for intracellular elemental analysis using X-ray microprobes16,17.
Although X-ray nanoprobe techniques are starting to be widely used for cellular elemental analysis, particularly with the advent of cryogenic SR-XRF capabilities, no stepwise protocol has been disseminated so far to the research community. Here, a detailed procedure is provided to prepare cryofixed adherent cells cultured as monolayers on silicon nitride membranes to be analyzed under cryogenic conditions. A freeze-drying step to be applied after the protocol in case the X-ray analysis must be performed at room temperature is also provided. While the proposed protocol has been successfully used with human breast cancer cells MD-MB-2312 and the freeze-drying was demonstrated among others on mouse neurons18,20,21, it can be easily extended to various types of human or animal cells.
Protocol
Loading...
$$\rightleftharpoonup{xx}$$
$$\longleftharp{xx}$$,
$$\longrightharp{xx}$$,
Experimental procedures were approved by the animal care committee of the CEA's Life Sciences Division (CETEA, A14-006). They were conducted in compliance with the French legislation and the European Community Council Directive of 24 November 1986 (86/609/EEC).
1. Silicon nitride (Si3N4) membrane support preparation
NOTE: Because the membrane is fragile and delicate, its support (200 µm thick silicon frame) has to be handled gently, ideally with a thin carbon tweezers or Dumont Tweezers #5, Straight Self-closing fine tips. This protocol used silicon nitride membranes with a frame of 5 mm x 5 mm and a membrane size of 1.5 mm x 1.5 mm. The membrane should be prepared roughly 12 h before starting the experiment (i.e., cell seeding). Membranes can be prepared at the end of the day and left drying overnight under a Class II laminar flow hood so they are ready to use the next morning. A silicon frame thickness of 200 µm is standard for most companies that sell silicon nitride windows. If the product used in this protocol is not available, a membrane size in the range of 0.5−1.5 mm can be used with a standard frame size of 5 mm x 5 mm. The larger membrane size is preferred when X-ray tomography will be used. TEM grid type silicon nitride windows with a membrane size of 0.5 mm and a thickness of 50 nm can also be used.
- Open the capsule containing the Si3N4 membrane support (Figure 1). Gently squeeze the capsule in order to lightly loosen the support.
- Hold one of the corners of the silicon frame using the thin tweezers. Be careful not to touch the Si3N4 membrane in the center. The 200 or 500 nm thick membrane can be easily damaged.
- Using the thin tweezers, gently place the Si3N4 membrane support in a sterile glass Petri dish, flat surface of the silicon nitride window facing up (i.e., the cavity facing the bottom of the dish).
- Remove the lid of the Petri dish and leave the membranes under UV light for 25−30 min under the laminar flow cabinet.
NOTE: The UVC light (254 nm) is typically set at 200 µW/cm2. - Put 10 µL of poly-L-lysine on the membrane. The drop should cover the Si3N4 membrane well and can spread a bit over the silicon frame. Leave it at 37 °C for 25 min in the standard tissue culture incubator at 100% relative humidity and 95% air, 5% CO2.
NOTE: In this case a poly-L-lysine coating was used for the MDA-MB-231 breast cancer cells. Depending on the type of cell line, various coatings can be used, and this step should be optimized accordingly. - In a sterile 48 well plate, fill different wells with 200−250 µL of ultra-pure and ultra-trace water filtered through a 0.22 µm sterile filter. Typically, each well can be used to rinse up to 2−3 membranes. Using fine tweezers, pick-up the membrane support at a corner of its silicon frame. Rinse the membrane gently by submerging it vertically 10 s in three successive wells.
NOTE: The membrane supports are taken out of the incubator and can be processed at room temperature, with the temperature and the humidity defined by a Class II laminar flow hood. - Put the membrane support vertically in an empty well of a sterile 96 well plate, cover it, and let it dry overnight under a Class II laminar flow hood.
2. Cell seeding
- In a sterile 4 well plate, place the membranes with their flat side facing up.
- MDA-MB-231 cells are maintained in a monolayer culture in DMEM with phenol red/Glutamax I, supplemented with 10% fetal calf serum and 1% penicillin and streptomycin at 37 °C in a 5% CO2 air humidified incubator.
- When the cells reach 60−70% confluency remove the media from the dish or flask.
- Wash 1x with 10 ml of Dulbecco's phosphate buffered saline without Ca2+ or Mg2+.
- Add 3 mL/T75 flask of 0.05% trypsin/EDTA solution and ensure that the entire monolayer is covered with the trypsin solution.
- Incubate for 3−5 min at 37 °C until the cells begin to detach. Care should be taken to not over-trypsinize the cells and not force the cells to detach prematurely.
- Add 8 ml of DMEM supplemented with 10% fetal calf serum and 1% penicillin and streptomycin or complete media and collect the cells by pipetting. The serum in the media will neutralize the trypsin.
- Spin down at 250 x g for 3 min at room temperature. Aspirate the supernatant.
- Add 8 ml of fresh complete media to the 15 ml tube containing the cell pellet, and pipet the cells up and down until the cells are dispersed into a single cell suspension.
- Count the cells using a hemocytometer and dilute to a concentration of 5 x 10⁶ cells per mL in complete media (DMEM with Phenol Red/1% of a 200 mM L-alanyl-L-glutamine dipeptide in 0.85% NaCl solution supplemented with 10% fetal calf serum and 1% penicillin and streptomycin).
- Take 10 µL of the MDA-MB-231 cell suspension and deposit it on the membrane. This corresponds to 50,000 cells/10 µL for MDA-MB-231. The drop should cover the Si3N4 membrane well and can spread a little bit on the silicon frame. Care should be taken to not touch the Si3N4 membrane with the tip of the micropipette.
NOTE: Depending on the type of cell line and experiments or measurements, cell density may vary and should be tested accordingly. Here, the proposed cell density for seeding the Si3N4 membrane was found optimal for the experimental conditions and further SR-XRF nano-analysis of the MDA-MB-231 cells2. - For hippocampal neurons (HN), remove the hippocampus brain tissue from embryonic day 18.5 mice and digest it in 0.25% trypsin in Hepes-HBSS (5.3 mM KCl, 0.44 mM KH2PO4, 137.9 mM NaCl, 0.34 mM NaH2PO4, 5.56 mM glucose) at 37 °C for 15 min18,19.
- Using a P1000 pipette with a P1000 tip and a P200 tip, perform the mechanical dissociation by drawing and releasing the cone content with the pipette several times. During this step, be careful not to create air bubbles in the medium, because air bubbles are toxic to neurons.
- Wait a few minutes until the aggregate settles at the bottom of the tube.
- Transfer the supernatant containing the dispersed cells to a sterile Eppendorf tube. Leave ~25 µl of culture medium containing the aggregate.
- Count the dissociated cells using a hemocytometer. Isolated HN neurons are plated at a concentration of 7 x 10⁴ cells cm-2 on poly-L-lysine (1 mg/mL poly-L-lysine)-coated silicon nitride membrane.
- Only for membranes with HN, incubate the neurons in first DMEM supplemented with 10% fetal bovine serum. One h after plating HN in DMEM, the medium is changed to neurobasal plating media (200 mM L-alanyl-L-glutamine dipeptide in 0.85% NaCl solution, and B27 supplement d = 1/50 diluted in Neurobasal)18,19.
- For the MDA-MB-231 cells, put the membrane supports at 37 °C in the incubator (100% relative humidity, 95% air and 5% CO2) for 25 min. This allows the cells to settle and start to attach to the substrate. This may be adapted depending on the cell line used.
- Add 1 mL of the required complete culture medium (DMEM with Phenol Red/1% of a 200 mM L-alanyl-L-glutamine dipeptide in 0.85% NaCl solution supplemented with 10% fetal calf serum and 1% penicillin and streptomycin) in each well of the MDA-MB-231 cells by putting the pipette tip against the wall of the plastic well and releasing the medium very slowly while it covers the membrane.
- Put the membrane vertical against the wall of the 4 well plate in order to take away any air bubbles trapped in the well cavity of the Si3N4 membrane (Figure 2). To do so, use fine tweezers and push away the bubble very gently, moving parallel to the Si3N4 backside frame to avoid touching and damaging the membrane.
- Put the membrane back horizontally at the bottom of the well and leave the 4 well plate in the incubator for the required time depending on the growth rate of the cell line used. The MDA-MB-231 cells were incubated overnight.
3. Treatment or medium change
- Remove the medium from the 4 well plate.
- Rinse once with 1 mL of PBS solution at 37 °C. Discard the PBS and add 1 mL of warmed complete fresh medium in presence or in absence (controls) of the desired treatment using a 1 mL pipette tip, releasing the liquid very slowly against the wall of the well plate. The Si3N4 membrane should be slowly submerged without any disturbances to avoid membrane motion or lifting.
4. Cryo-immobilization of the cellular preparation by plunge-freezing
NOTE: At the end of the required incubation time, in the presence or absence of treatment, the cells have to be carefully rinsed and cryofixed. Around 30 min before starting to rinse and blot the cellular preparation prior to plunge-freezing, first set-up and cool down the automatic plunge freezer machine. As you manipulate cryogens, the use of appropriate cryogenic gloves, safety glasses, closed shoes, and a laboratory coat are required. Liquid nitrogen must be transported in appropriate Dewars, and the working place should be sufficiently ventilated with the presence of an oxygen monitor. Ideally, a low hygrometry level of 20−30% helps to limit ice contamination of the materials, Dewars, and cryogens, that is detrimental for the vitrification of the samples (i.e., an amorphous ice layer). Ideally, depending on the experience level of the researcher, up to 10−12 samples for a single session can be prepared using the same secondary cryogen liquid ethane cup for vitrification. Between sessions, the automatic plunge freezer requires a 1 h automatic bake-out procedure. Ideally, samples should be processed with identical incubation conditions. Still, controls can be processed first, followed by the samples with a particular treatment condition.
NOTE: For plunge-freezing the following steps apply both to MDA-MB-231 or HN cells.
- Set up the cryoplunger for rapid cryofixation of cells.
- Turn on the automatic plunge freezer.
- Enter the parameters (e.g., temperature, percent humidity, blotting time if automatic blotting is used, and position for lifting the sample to the surface of the cryogen to facilitate transfer to a cryogenic container) directly from the console and parameters settings menu. In the present case, the parameters of the humidity chamber were set to 37 °C and 80% humidity.
NOTE: Better vitrification results were obtained for this protocol and X-ray imaging with quick and careful manual blotting. Thus, the protocol does not use an automatic blotting sequence program. - Attach the humidifier chamber and in order to preserve the humidity first fill it using a syringe with 60 mL of double-distilled water, and then 20 mL as called for on the automatic plunge freezer console.
NOTE: Avoid using ultrapure water because it may damage the vaporizer system. Close the valve and leave the tubing attached on the backside of the humidifier. - Install the black ethane cup into its holder and cover it with the plastic caps.
- Fill the Dewar of the cold chamber with LN2, bringing it to the level of the grid within the working area.
- Put a dedicated cryo-box to store the membranes after cryofixation in the transfer container held in the dedicated location in the EM-GP working area and close to the ethane cup holder.
NOTE: The dedicated cryo-box is an in-house development at the nanoprobe beamline ID16A of the European synchrotron radiation in Grenoble. Drawings with specifications are available upon request (Figure 3). They can be stored four at a time in a 50 mL conical tube for long-term storage in an LN2 Dewar. An alternative possibility consists in using a small 0.2 mL regular PCR thin wall tube with dome caps to store a single Si3N4 membrane support. You will need to drill a ~2 mm hole in the top part of the wall tube using a heated syringe needle in order to allow LN2 to fill the tube. - Fill the transfer container with LN2 and cover it with the dedicated aluminum lid. Continue to fill the cold chamber with LN2 (typically ~2 L is needed) keeping at 100% the LN2 level monitor display on the console. Wait until the final required temperature is reached.
- Remove the plastic cap and cover the ethane cup with the liquefier connected to the ethane bottle. Wait until the temperature of the ethane cup equilibrates to the temperature setpoint. When reached, start to use the secondary cryogen (i.e., liquified ethane).
NOTE: The setpoint used was -180 °C, slightly above the ethane melting point (-182.8 °C). You do not need to precool the ethane liquefier because it can be a source of frost formation and contamination of the ethane cup. - Open the high-purity ethane bottle main valve and very slowly open the pressure regulator until you get a slow fog of ethane. Keep this very low flow until liquid ethane builds up. Fill the cup to its top edge. Close the pressure regulator and the main valve of the ethane bottle. Remove the Leica liquefier carefully and leave it aside on a small polystyrene support under the fume hood. Keep the working area loosely covered with the black polystyrene cap provided with the machine to prevent frost contamination of the working area and ethane container.
- Just before manual blotting of the sample, remove the black polystyrene cap and from the menu of the console press "Lower Chamber", which brings the environmental chamber in contact with the cryogenic working area.
- Prepare to blot the sample.
- Prepare the adequate buffer to remove traces of salts from the culture medium. For this protocol, ammonium acetate buffer was used for rinsing the MDA-MB-231 cells.
NOTE: Ammonium acetate buffer is suitable for most cell types, and it does not add to the X-ray fluorescence signal (considering elements with Z > 9). Some particular cell lines such as neuronal cells may require the use of a dedicated buffer. For example, for primary cortical neurons, a saline solution consisting of 1.8 volume of 0.5 M Na2HPO4 and 1.9 volume of 0.5 M NaH2PO4 can be used15. On the other hand, phosphorus or chlorine contained in the buffer will contribute to the XRF spectrum. This limitation of spurious X-ray emission lines must be kept in mind depending on the elements of interest to be detected. - Prepare a 150 mM ammonium acetate solution from ammonium acetate ultrapure solution and check for pH (7.0–7.3) and osmolarity (270–300 mOsm/kg)
NOTE: The above mentioned osmolarity is equivalent to Dulbecco's phosphate buffer saline (D-PBS) without calcium and magnesium and can be checked using a micro-osmometer. - Fill in the required number of wells from a 12 well plastic plate with the ammonium acetate buffer.
- Cut a quarter of filter paper for blotting, either from No. 1 filter paper with a precut hole, or from manually punched filter paper of a 55 mm diameter with a 15 mm central hole.
- Take out the required sample stored in the incubator at 37 °C at the last moment before rinsing and plunge-freezing the membrane.
- Unlock the tweezers using the black clamp ring of the quick-release forceps (typically a Dumont clamping ring high-precision medical tweezers) and grab the Si3N4 membrane support from the culture well.
NOTE: Grab the middle of the silicon frame, keeping the tip of the tweezers near the membrane. Move the black clamp ring down to the first stripes to lock the tweezers. - Immerse the Si3N4 membrane support vertically in the ammonium acetate buffer solution kept at 37 °C for ~5 s.
NOTE: The support should remain vertical in the buffer. Note that the buffer solution in each well of the plate can be used for up to three membranes for the same incubation conditions. - Blot manually with filter paper to drain out the excess buffer from the membrane rinsing solution (Figure 4) in order to leave a thin and homogeneous layer of ammonium acetate aqueous solution covering the cells.
NOTE: To do so, first press the backside of the window onto the filter paper to remove nearly all the aqueous buffer remaining in the well and the back of the membrane. Second, blot the front side, starting from both sides of the tweezers, then each side of the frame (Figure 4). Never touch the membrane. The excess of buffer drained can be monitored with the aureole formed on the filter paper. - Open the environmental chamber door and quickly mount the tweezers, sliding it into the forceps interlock, and close the door (Figure 5).
- Press "Blot/A plunge". The tweezers holding the Si3N4 membrane will be quickly plunged into the cryogen.
- Remove the lid of the transfer container with precooled forceps.
- Press "Transfer". The Si3N4 membrane will be slightly moved up above the cryogen.
- In a single quick movement, disconnect the tweezers by sliding them out of the forceps interlock and slightly tilt out of the interlock to bring directly into an empty slot of the cryo-box in the transfer container filled with LN2. Release the black clamp ring to free the membrane (Figure 5).
NOTE: The transfer container should always be covered with LN2. When a refill is required, cover the ethane cup with the plastic lid provided with the machine to avoid mixing LN2 and ethane. - Cover the transfer container with a lid and use a small white polystyrene cup filled with LN2 to transfer it to a polystyrene box filled with LN2.
NOTE: The cryo-box or tube containing the membranes can then be stored in 50 mL conical tubes filled with LN2 and transferred to a long-term storage LN2 Dewar. Before starting to plunge freeze the next sample, warm up all cold and frosted tweezers with a hair dryer or a hot plate/cryotools dryer (45 °C) to avoid contamination with ice crystals.
- Prepare the adequate buffer to remove traces of salts from the culture medium. For this protocol, ammonium acetate buffer was used for rinsing the MDA-MB-231 cells.
5. Freeze-drying of plunge-frozen cells cultured on silicon nitride membranes
NOTE: For freeze-drying, the following steps apply to both MDA-MB-231 and HN cells. To cool down the freeze dryer, you will need to wait around 40 min to 1 h.
- Set up the freeze dryer
- Switch the power on with the rocker switch located on the rear panel of the instrument.
- Start to enter the parameters following the LCD menu: Segment 1 = 2 h at -120 °C; Segment 2 = 2 h ramp from -120 °C to -80 °C; Segment 3 = 2 h at -80 °C; Segment 4 = 2 h ramp from -80 °C to 50 °C; Segment 5 = 2 h at -50 °C; Segment 6 = 6 h ramp from -50 °C to 30 °C.
- At the end of the parameter set-up, save the settings, close the chamber lid and press "START".
- The unit will pump down to 1.10-5 mbar. When this pressure is reached, the command line of the display will show "Start Cooling Now, START to continue".
- Fill the liquid nitrogen Dewar regularly to cool down the stage below the temperature triple point setting.
NOTE: The stage triple point temperature is set to -140 °C. Before loading the sample for this protocol, it is best to wait about 1 h and a temperature stage of -160 °C. - The display will show "Press ENTER" when ready to "Load sample".
- Cool down to liquid nitrogen temperature within an LN2 filled polystyrene Dewar, the sample transfer holder provided by the supplier, and the two additional brass cylindrical Si3N4 membrane holders.
- Mount the Si3N4 membrane brass holder on top of the sample transfer holder provided by the supplier in the polystyrene Dewar (Figure 6A). Keep the level of LN2 to about 1−2 mm below the top edge of the first brass piece.
- Pick up a Si3N4 membrane sample support from the cryo-box or the PCR tube using precooled self-closing tweezers in inox or teflon-coated.
- Deposit the membrane with the cells sample side facing up in the brass holder numbered cavity.
- Cover the assembly with the second brass piece as a lid (Figure 6C).
NOTE: We designed two brass discs each having a thickness of 5 mm, a diameter of 50 mm, and a central 11 mm diameter hole. The first brass disc has 14 machined rectangular (8 mm x 6 mm) locations to accommodate supports (5 mm x 5 mm). Each slot has a flat and polished well with a depth of 2 mm. The second brass disc is flat to cover the Si3N4 membrane brass support and acts as a cold trap enclosure. - Precool the transfer rod in the LN2 filled polystyrene foam box and use it to lock in the full assembly (Figure 6D,E).
- Press "ENTER" on the front panel of the freeze dryer.
- The turbo and rotary pumps will stop and the chamber purged with dry nitrogen gas to allow opening the lid of the chamber.
- Immediately transfer the sample transfer assembly with the spring-loaded transfer rod into the freeze dryer chamber and clip it on the copper LN2 cold stage.
NOTE: Leave the full assembly with the transfer rod into the chamber. - Immediately close the lid of the freeze dryer chamber and press "START" to continue with the freeze-drying cycle.
- Fill up the LN2 reservoir of the freeze dryer manually every 2 h.
NOTE: An automatic LN2 filling system may be connected to this reservoir. - At the end of the freeze-drying cycle, press "STOP" to vent the chamber, and remove the full assembly to access the freeze-dried samples.
Results
Loading...
$$\rightleftharpoonup{xx}$$
$$\longleftharp{xx}$$,
$$\longrightharp{xx}$$,
A typical optical video microscope view of frozen hydrated MDA-MB-231 cells that were sub-cultured onto a poly-L-lysine coated Si3N4 membrane support is shown in Figure 7A. The optical view of the sample in the vacuum chamber was obtained in reflection mode using the dedicated online video microscope of the ID16A beamline of the ESRF22. While electron or soft X-ray microscopy requires the ice layer embedding the cell to be as thin as possible (typically <0.5 µm), hard X-rays (>10 keV) have the advantage of a much higher penetration depth and lower dose deposition. The ice thickness can therefore be larger, typically <10 µm including the cell so that the ice embedding the cell is a few µm in thickness. This can be estimated through the measured X-ray intensity in transmission compared to the intensity without the sample, taking into account the absorption of the 500 nm thick Si3N4 membrane. This ice thickness can be achieved through manual blotting as described in the present protocol. In the Newton rings region, the ice thickness can be even thinner (not measured).
The X-ray fluorescence elemental mapping of the frozen hydrated cell is shown in Figure 7B with the representative distributions of physiological elements such as potassium (K), sulfur (S), and zinc (Zn). These maps represent the elemental areal mass (i.e., elemental projected mass). While not done in the present case, such maps can be normalized through X-ray propagation-based phase contrast imaging that provides the estimation of the sample projected mass23. As reported by many studies, the highly diffusible K ion in cells preserved in their near-native state was assumed to be homogeneously distributed throughout the entire cell23,24,16. As shown in the 2D X-ray fluorescence elemental images in Figure 7B, the tightly bound element S was evenly distributed within the cell, similarly to K, and represents a good estimate of the cellular mass profile. The Zn distribution had a higher signal in the nucleus than in the cytosol and clearly outlined the nucleus. It can be noted that small Zn-enriched regions can be detected at the spatial resolution (50 nm) in the nuclear region.
The existing X-ray nanoprobes or the ones to be built do not necessarily accommodate cryogenic capabilities. In this case, the best alternative to get X-ray fluorescence images of cells at sub-100 nm spatial resolutions is to perform a freeze-drying procedure described in this protocol after plunge-freezing of the cell. Figure 8A shows a typical bright field microscopy view of resultant freeze-dried primary mouse hippocampal neurons directly cultured on the Si3N4 membrane. In this case, if stored in a clean desiccated chamber, the samples can be prepared 1−2 weeks in advance and be observed with an ordinary upright optical microscope for registration of regions of interest. Care should be taken to prevent exposure to ambient humidity as it may be captured by the freeze-dried sample and lead to damage under the X-ray nanobeam. This procedure was applied successfully to very sensitive cells (i.e., neuronal cells) and even better results were obtained with other more robust types of cells, such as cancer cells. As for plunge-frozen cells, the X-ray fluorescence images of K, S, and Zn on the entire freeze-dried cell display are similar to the ones described above. They are representative of the elemental distributions to be found in various types of freeze-dried cells at 50−100 nm spatial resolution. While freeze-drying whole cells is an alternative to preserve elemental integrity, it is at the expense of a perfect preservation of the cell morphology16, particularly cell membranes.
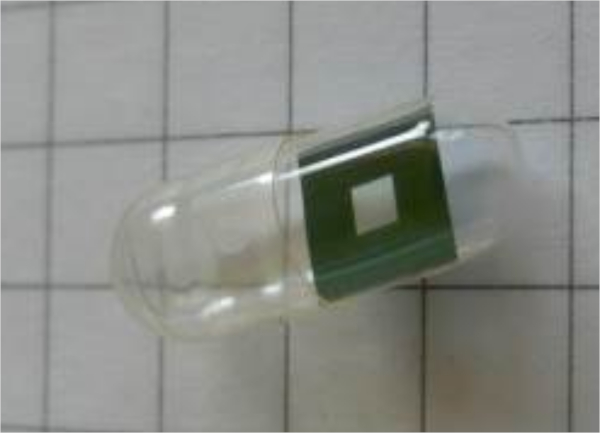
Figure 1: Typical sample support for X-ray fluorescence nano-analysis. A Si3N4 membrane support in its protective capsule. This type of substrate can be used both for room temperature analysis (plunge-freeze cellular preparation followed by low temperature and low vacuum freeze-drying process) or for cryogenic X-ray fluorescence analysis. Please click here to view a larger version of this figure.
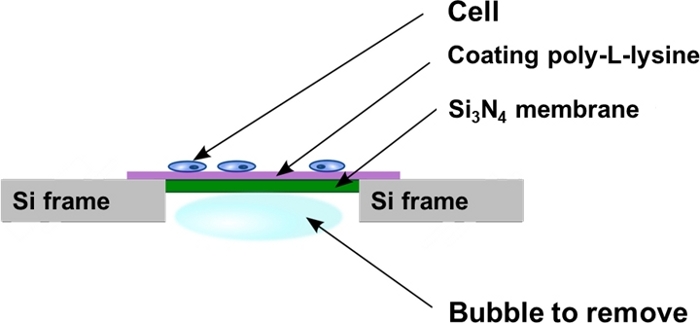
Figure 2: Schematic view of the silicon nitride windows after cell seeding. The cells are cultured directly onto the poly-L-lysine coated flat surface of the Si3N4 membrane support. Sometimes air bubbles can be trapped in the backside cavity of the Si3N4 membrane support and have to be removed as described in the protocol. Please click here to view a larger version of this figure.
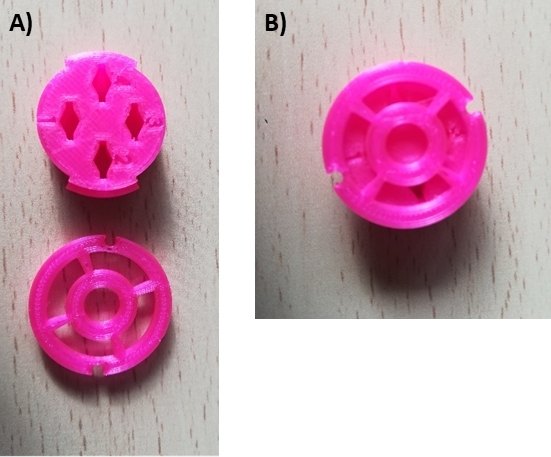
Figure 3: In-house developed 3D printed cryo-box for long-term storage of plunge frozen Si3N4 membrane supports in liquid nitrogen Dewar. (A) Cryo-box disassembled with the container and the caps (lower part) and (B) the assembled cryo-box with locked caps. The caps can be manipulated with the tweezers, opening or locking by rotation. A detailed plan for 3D printing is available upon request from ESRF ID16A. The design has been made to accommodate silicon nitride TEM grids. Please click here to view a larger version of this figure.
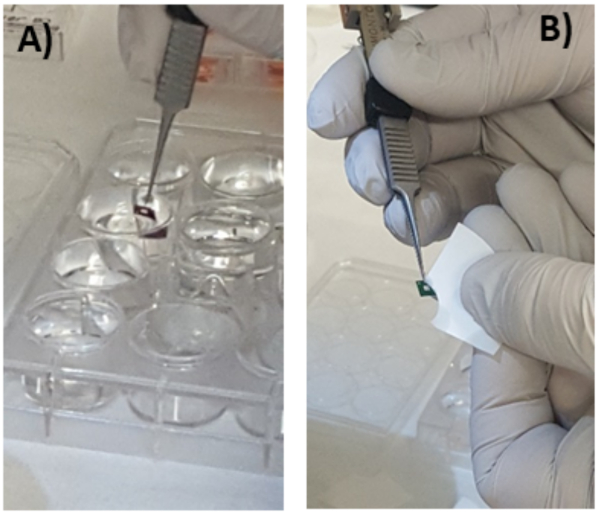
Figure 4: Blotting of cells cultured on Si3N4. Prior to plunge-freezing the cell monolayer cultured onto a Si3N4 membrane needs to be rinsed in ammonium acetate solution (A) and carefully manually blotted using filter paper (B). Please click here to view a larger version of this figure.
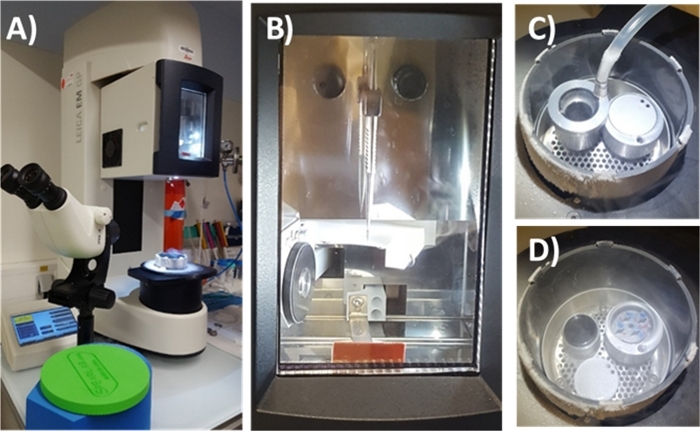
Figure 5: Automatic plunge-freezing EM-GP machine. (A) The automatic plunge freezer. (B) Environmental chamber with the tweezers locked in. (C) The ethane cup covered with the Leica liquefier connected to an ethane bottle. (D) The plunge-freezing enclosure showing the black cup full of liquified ethane and the cryo-box for further storage in LN2 of the vitrified Si3N4 membranes. Please click here to view a larger version of this figure.
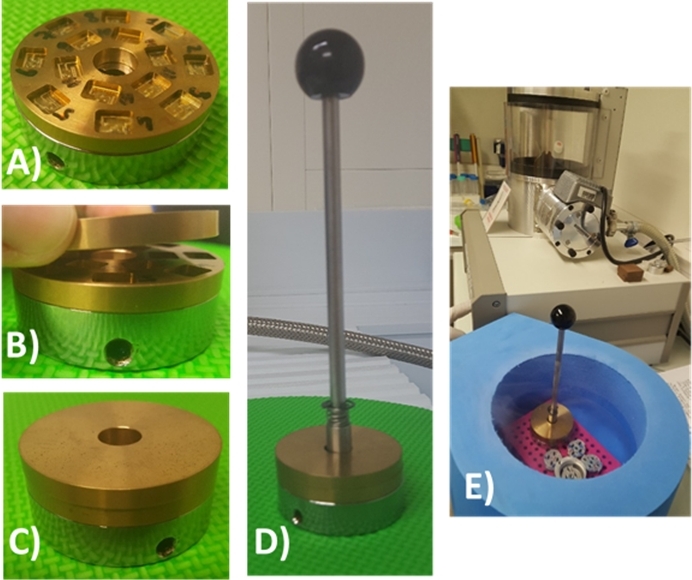
Figure 6: Sample cryotransfer assembly for freeze-drying procedure. (A) The first brass recipient for Si3N4 membranes is mounted on top of the sample transfer holder provided by the freeze dryer supplier. (B) and (C) show that the second flat brass disc is used as a cover and acts as a cold trap enclosure to be inserted in the vacuum enclosure of the freeze dryer. (D) The full assembly with the spring-loaded transfer rod. (E) The sample holder carrying the vitrified cellular preparation grown on the Si3N4 membrane must be further inserted in the LN2-cooled freeze dryer. All the steps for mounting the assembly are done in LN2 in a Styrofoam box. For clarity, all the images were produced in the absence of LN2. Please click here to view a larger version of this figure.
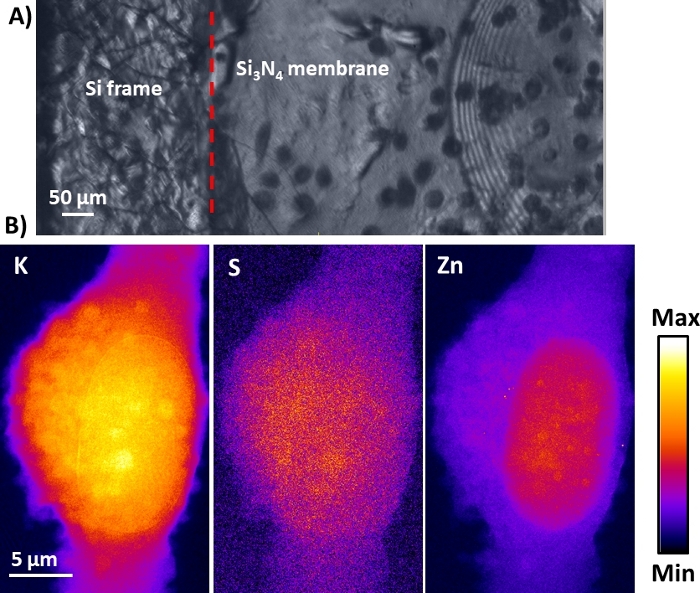
Figure 7: Cryo-X-ray fluorescence images of a frozen hydrated cell using hard X-ray nanoprobe. (A) Typical online view in reflection mode using the dedicated optical video microscope of the ESRF ID16A beamline. After manual blotting, a total ice thickness of about 5−10 µm was achieved that allows a clear view of the frozen hydrated cells. A region with Newton rings indicative of even much thinner ice is noticeable. (B) Representative cryo-X-ray fluorescence cellular distributions of physiological elements potassium (K), sulfur (S), and zinc (Zn). Please click here to view a larger version of this figure.
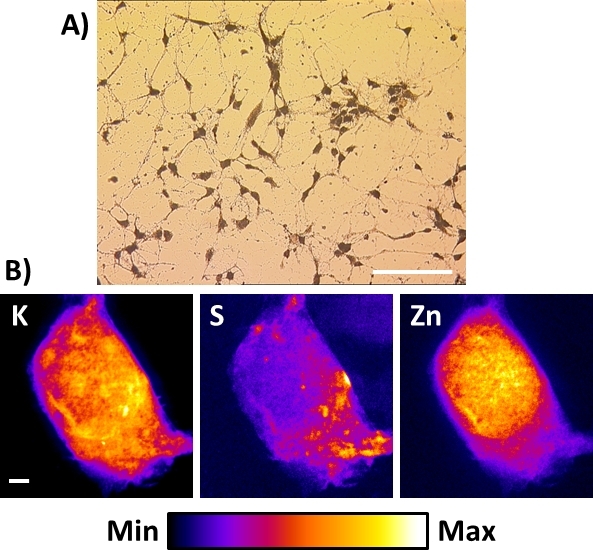
Figure 8: X-ray fluorescence images of a freeze-dried neuronal cell using hard X-ray nanoprobe. (A) Typical bright field microscopy view of resultant freeze-dried primary cortical neuronal cells directly cultured onto the Si3N4 membrane. Scale bar = 200 µm (B) Representative room temperature X-ray fluorescence images of a single freeze-dried hippocampal neuron showing the distributions of physiological elements potassium (K), sulfur (S), and zinc (Zn). Scale bar = 2 µm. Please click here to view a larger version of this figure.
Discussion
Loading...
$$\rightleftharpoonup{xx}$$
$$\longleftharp{xx}$$,
$$\longrightharp{xx}$$,
Cryo-electron microscopy (cryo-EM) won the 2017 Nobel Prize in chemistry and as such the development made by J. Dubochet on vitrification of biological material for the high-resolution structure determination of biomolecules in solution25. As reported by Dubochet in his Nobel lecture "Knowing how to vitrify a droplet of water is one thing, preparing a biological sample for biological observation is another"25. Cryopreparation steps are now considered the standard technique to mitigate radiation dose damage and study cells close to their native state. The preparation remains tedious, however. This is because electron microscopy, due to its unsurpassed spatial resolution, is sensitive to any ultrastructural artifact that occurs during the sample preparation. The synchrotron cryonanoprobes are now approaching similar difficulties going down to spatial resolutions as low as 13 nm in the high energy X-ray range26. Hard X-ray microscopy can analyze entire cells while electron microscopy suffers from the poor penetration depth of electrons enabling only very thin cell slices to be observed.
Monolayers of cells are thin enough so that by plunge-freezing in liquid ethane, the required cooling rates for water vitrification are attained. In theory, cooling rates as high as 108 K/s are possible using high-pressure freezing27 which allows vitrification of specimens too thick for plunge freezing. A cooling rate of 105 K/s, required to allow full vitrification of the sample at ambient pressure28, is reached reproducibly using the automatic plunge-freezing machine and parameters presented here. This allows a researcher to vitrify thin biological specimens (<10 µm) such as a monolayer of cells12,13,14,15,29,30 by plunge-freezing in liquid ethane.
An important challenge with this protocol is to also preserve as much as possible the chemical integrity of the intracellular content to provide reliable elemental distributions within the cell in 2D or 3D. As published elsewhere2,16,17,31, in the case of elemental imaging at the subcellular level, the analysis of frozen hydrated cells should be considered. Otherwise, the combination of plunge-freezing and freeze-drying of cells can be used for room temperature analysis. For the latter, the amorphous ice is removed through the process of sublimation, while the bound water molecules are removed through the process of desorption. This process may be far from ideal compared to frozen hydrated samples due to the possible alteration of the cellular membranes and the morphology of some subcellular structures32. Also, for speciation studies, the water extraction may lead to metal speciation artifacts. Still, it has been successful and the best alternative to frozen hydrated samples for elemental imaging at sub-100 nm levels2,16,17,18,20,33,34,35,36.
As it has been reported37, the quality of cryopreserved cellular preparations can be evaluated through the potassium-to-sodium K/Na ratio. Unfortunately, it cannot yet be determined with the hard X-ray nanoprobe used here, due to the low energy cut-off of the silicon drift detector used to detect the X-ray fluorescence photons of the elements (E ≥ 1.3 keV magnesium). Indeed, a high K/Na ratio (>10) that can be measured using TOF-SIMS, EPMA, or nuclear microprobe PIXE16,37 is indicative of the preserved chemical integrity of the cell compared to the expected K/Na of 25 in a living cell37. This can be supported by a concomitant low Cl/K ratio38. Still, imperfect vitrification, particularly if the speed of sample cooling is too low, can lead to the formation of large ice crystals that can damage cell membranes and organelles, consequently altering the distribution of chemical elements. Although there is no routine procedure to monitor this potential damage and impact on the intracellular distribution, the above elemental ratios and the possibility to image the cell at high resolution using X-ray phase contrast or cryo-soft X-ray microscopy can be the best approaches to support good preservation of intracellular compartments with concomitant preservation of the elemental integrity. The combination of these techniques and the use of newly developed cryocorrelative fluorescence optical microscopes will help assess to what extent this damage occurs and affects the intracellular elemental distribution.
Overall, a detailed and comprehensive protocol to prepare cellular samples for synchrotron X-ray fluorescence nano-analysis is presented. It is a good starting point for the research community, helping to solve the difficult issue of how to prepare appropriate cellular samples for 2D and 3D elemental imaging at (cryo) hard X-ray nanoprobes. These approaches can be merged with optical fluorescence and electron microscopy capabilities for in-depth correlative chemical and structural imaging of cells.
Disclosures
Loading...
$$\rightleftharpoonup{xx}$$
$$\longleftharp{xx}$$,
$$\longrightharp{xx}$$,
The authors have no conflicts of interest.
Acknowledgements
Loading...
$$\rightleftharpoonup{xx}$$
$$\longleftharp{xx}$$,
$$\longrightharp{xx}$$,
The experiments on the nano-imaging beamline ID16A were performed in the frame of ESRF proposals LS2430, LS2303, and LS2765.
Materials
| Name | Company | Catalog Number | Comments |
|---|---|---|---|
| Ammonium Acetate solution, BioUltra, for molecular biology, ~5M in H2O | SIGMA | 09691-250mL | One can prepare the required solution from high-grade ammonium acetate powder and ultrapure water, pH and osmolarity needs to be adjusted anyway. |
| B27 supplement, 50x | Life Technologies, Invitrogen | 17504-044 | for hippocampal neuron culture |
| Dulbecco’s Phosphate Buffered Saline, DPBS, ([-] CaCl2, [-] MgCl2) | GIBCO | 14190-094 | cell culture |
| DMEM with Phenol Red/Glutamax I (Medium ATCC modification) | GIBCO | 21885025 | cell culture |
| Dulbecco’s modified Eagle medium (DMEM) | Life Technologies, Invitrogen | 31966-02 | for hippocampal neuron culture |
| Dumont Tweezers #5, Straight Self-closing, 0.05x0.01mm Tips, Biology | World Precision Instrument | 501202 | |
| Emitech K750X Peltier-Cooled EM Freeze Dryer | Quorum Technology | EK3147 | |
| Ethane N45 | Air Liquid | p0505s05r0a001 | C2H6 > 99,995 % |
| Fetal Bovine Serum, Performance Plus, certified One Shot format, US origin | GIBCO | A31604-02 | cell culture |
| HBSS 10x | Life Technologies, Invitrogen | 14185-052 | for hippocampal neuron culture |
| Leica GP quick-release forceps | Leica | 16706435 | |
| MDA-MB-231 cell line, an epithelial, human adenocarcinoma breast cancer cell | ATCC | ATCC HTB-26 | cell culture |
| Neurobasal medium | Life Technologies, Invitrogen | 21103-049 | for hippocampal neuron culture |
| Nunc 4-Well Plate | Thermo Fisher | 176740 | cell culture |
| Osmo1 Single-Sample Micro-Osmometer | Advanced Instruments | Osmo1 | Alternative can be found at Fisher scientific (Wescor Inc. VAPRO® Vapor Pressure Osmometer) |
| Penicillin-Streptomycin | SIGMA | P4333 | cell culture |
| poly-L-lysine | SIGMA | P4707 | Other type of coating can be used that is dependent of the cell type to be cultured on the membrane, other adhesion factors such as fibronectin, collagen, polyornithine can be tested accordingly. Cell can be cultured directly on silicon nitride membrane, but the latter are slightly hydrophobic and adhesion factors are recommended unless the membrane are processed to be hydrophilic (glow plasma discharged). |
| Plunge freezing robot Leica EM GP main unit | Leica | 16706401 | Alternative for automated plunger are the Vitrobot Mark IV (FEI), CryoPlunge 3 (Gatan), MS-002 Rapid Immersion Freezer (EMS). Manual home-made system can be used but an environment-controlled chamber is an asset for plunge-freezing. |
| Silicon nitride membrane (Si3N4) | Silson Ltd. | SiRN-5.0(o)-200-1.5-500-NoHCl | The proposed silicon nitride membrane type is optimised for analysis at ID16A ESRF X-ray nanoprobe, The 500 nm thickness of the membrane was chosen being more robust for cellular manipulation and cryofixation detailed within this protocol. Membrane with thickness of 200 nm or below can also be used although quite fragile, and other design of silicon nitride membrane can be purchased (for example TEM compatible membrane...) from Sislon or other company such as Norcada, SPI supplies, Ted Pella, EMS, LabTech, Neyco... |
| Trypan blue solution 0.4% | GIBCO | 15250061 | cell culture |
| Trypsin-EDTA, 0.05% | GIBCO | 25300-054 | cell culture |
| Ultratrace Elemental Analysis Grade, Ultrapure Water | Fisher Chemicals | W9-1 | MilliQ water can be used but has to be tested for trace element level of contamination using for example ICP-MS analysis. |
| Whatman No. 1 filter paper with precut hole | Leica | 16706440 | Alternative filter paper may be used and must have an outer diameter of 55 mm, the Punch for filter paper system from Leica (ref.16706443) can be used. |
References
Loading...
$$\rightleftharpoonup{xx}$$
$$\longleftharp{xx}$$,
$$\longrightharp{xx}$$,
- Lewis, D. J., et al. Intracellular synchrotron nanoimaging and DNA damage/genotoxicity screening of novel lanthanide-coated nanovectors. Nanomedicine. 5 (10), 1547-1557 (2010).
- Fus, F., et al. The intracellular localization of osmocenyl-tamoxifen derivatives in hormone-independent breast cancer cells revealed by 2D and 3D nano X-ray fluorescence imaging. Angwendte Chemie. , (2019).
- Janssens, K., Adams, F., Rindby, A. Microscopic X-Ray Fluorescence Analysis. , Wiley. Chichester, UK. (2000).
- Carmona, A., et al. Uranium exposure of human dopaminergic cells results in low cytotoxicity, accumulation within sub-cytoplasmic regions, and down regulation of MAO-B. Neurotoxicology. 68, 177-188 (2018).
- Leapman, R. D., Hunt, J. A., Buchanan, R. A., Andrews, S. B. Measurement of low calcium concentrations in cryosectioned cells by parallel-EELS mapping. Ultramicroscopy. 49 (1-4), 225-234 (1993).
- Saubermann, A. J., Echlin, P., Peters, P. D., Beeuwkes, R. Application of scanning electron microscopy to X-ray analysis of frozen hydrated sections. I. Specimen handling techniques. Journal of Cell Biology. 88 (2), 257-267 (1981).
- Saubermann, A. J., Heyman, R. V. Quantitative digital X-ray imaging using frozen hydrated and frozen dried tissue sections. Journal of Microscopy. 146, Pt2 169-182 (1987).
- Wroblewski, J., Roomans, G. M. X-ray microanalysis of single and cultured cells. Scanning Electron Microscopy. , Pt 4 1875-1882 (1984).
- Wroblewski, J., Müller, R. M., Wroblewski, R., Roomans, G. M. Quantitative X-ray microanalysis of semi-thick cryosections. Histochemistry. 77 (4), 447-463 (1983).
- Zierold, K. Cryopreparation of mammalian tissue for X-ray microanalysis in STEM. Journal of Microscopy. 125, Pt2 149-156 (1982).
- Harkiolaki, M., et al. Cryo-soft X-ray tomography: Using soft X-rays to explore the ultrastructure of whole cells. Emerging Topics in Life Sciences. 2 (1), 81-92 (2018).
- McDermott, G., Le Gros, M. A., Knoechel, C. G., Uchida, M., Larabell, C. A. Soft X-ray tomography and cryogenic light microscopy: the cool combination in cellular imaging. Trends in Cell Biology. 19 (11), 587-595 (2009).
- Schneider, G., et al. Three-dimensional cellular ultrastructure resolved by X-ray microscopy. Nature Methods. 7 (12), 985-987 (2010).
- Sorrentino, A., et al. MISTRAL: a transmission soft X-ray microscopy beamline for cryo nano-tomography of biological samples and magnetic domains imaging. Journal of Synchrotron Radiation. 22 (4), 1112-1117 (2015).
- Carzaniga, R., Domart, M. C., Duke, E., Collinson, L. M. Correlative cryo-fluorescence and cryo-soft X-ray tomography of adherent cells at European synchrotrons. Methods in Cell Biology. 124, Academic Press. 151-175 (2014).
- Perrin, L., Carmona, A., Roudeau, S., Ortega, R. Evaluation of sample preparation methods for single cell quantitative elemental imaging using proton or synchrotron radiation focused beams. Journal of Analytical Atomic Spectrometry. 30 (12), 2525-2532 (2015).
- Jin, Q., et al. Preserving elemental content in adherent mammalian cells for analysis by synchrotron-based x-ray fluorescence microscopy. Journal of Microscopy. 265 (1), 81-93 (2017).
- Daoust, A., et al. Impact of manganese on primary hippocampal neurons from rodents. Hippocampus. 24 (5), 598-610 (2014).
- Daoust, A., et al. Manganese Cytotoxicity Assay on Hippocampal Neuronal Cell Culture. Bio-protocol. 5 (1), 1368(2015).
- Gibon, J., et al. The over-expression of TRPC6 channels in HEK-293 cells favours the intracellular accumulation of zinc. Biochimica et Biophysica Acta (BBA)-Biomembranes. 1808 (12), 2807-2818 (2011).
- Hasna, J., Bohic, S., Lemoine, S., Blugeon, C., Bouron, A. Zinc Uptake and Storage During the Formation of the Cerebral Cortex in Mice. Molecular Neurobiology. , 1-13 (2019).
- Villar, F., et al. Nanopositioning for the ESRF ID16A Nano-Imaging Beamline. Synchrotron Radiation News. 31 (5), 9-14 (2018).
- Kosior, E., et al. Combined use of hard X-ray phase contrast imaging and X-ray fluorescence microscopy for subcellular metal quantification. Journal of Structural Biology. 177 (2), 239-247 (2012).
- Bohic, S., et al. Synchrotron hard X-ray microprobe: fluorescence imaging of single cells. Applied Physics Letters. 78, 3544-3546 (2001).
- Dubochet, J. On the Development of Electron Cryo-Microscopy (Nobel Lecture). Angwendte Chemie. 57 (34), 10842-10846 (2018).
- Da Silva, J. C., et al. Efficient concentration of high-energy X-rays for diffraction-limited imaging resolution. Optica. 4 (5), 492-495 (2017).
- Studer, D., Humbel, B. M., Chiquet, M. Electron microscopy of high-pressure frozen samples: bridging the gap between cellular ultrastructure and atomic resolution. Histochemistry and Cell Biology. 130 (5), 877-889 (2008).
- Moor, H. Theory and pratice of high pressure freezing. Cryotechniques in Biological Electron Microscopy. Steinbrecht, R. A., Zierold, K. , Springer. 175-191 (1987).
- Gilkey, J. C., Staehelin, L. A. Advances in ultrarapid freezing for the preservation of cellular ultrastructure. Journal of Electron Microscopy Techniques. 3 (2), 177-210 (1986).
- Ferreira, J. L., Matthews-Palmer, T. R., Beeby, M. Electron Cryo-Tomography. Cellular Imaging. , Springer, Cham. 61-94 (2018).
- Colvin, R. A., Jin, Q., Lai, B., Kiedrowski, L. Visualizing metal content and intracellular distribution in primary hippocampal neurons with synchrotron X-ray fluorescence. PLoS One. 11 (7), 0159582(2016).
- Vavpetič, P., et al. Elemental distribution and sample integrity comparison of freeze-dried and frozen-hydrated biological tissue samples with nuclear microprobe. Nuclear Instruments and Methods in Physics Research Section B: Beam Interactions with Materials and Atoms. 348, 147-151 (2015).
- Guerquin-Kern, J. L., Bordat, C. Cryo-preparation procedures for elemental imaging by sims and eftem. Handbook of Cryo-Preparation Methods for Electron Microscopy. , CRC Press. 499-536 (2008).
- Gramaccioni, C., et al. Nanoscale quantification of intracellular element concentration by X-ray fluorescence microscopy combined with X-ray phase contrast nanotomography. Applied Physics Letters. 112 (5), 053701(2018).
- Perrin, L., et al. Zinc and Copper Effects on Stability of Tubulin and Actin Networks in Dendrites and Spines of Hippocampal Neurons. ACS Chemical Neurosciences. 8 (7), 1490-1499 (2017).
- Ortega, R., et al. α-synuclein over-expression induces increased iron accumulation and redistribution in iron-exposed neurons. Molecular Neurobiology. 53 (3), 1925-1934 (2016).
- Fartmann, M., et al. Quantitative imaging of atomic and molecular species in cancer cultures with TOF-SIMS and Laser-SNMS. Applied Surface Sciences. 231 (2), 428-431 (2004).
- Pålsgård, E., Lindh, U., Roomans, G. M. Comparative study of freeze-substitution techniques for X-ray microanalysis of biological tissue. Microscopy Research and Techniques. 28 (3), 254-258 (1994).
Reprints and Permissions
Request permission to reuse the text or figures of this JoVE article
Request Permission