Here, we present a protocol to conduct a variety of behavioral tests in cattle that have been designed to evaluate emotions. A battery of behavioral tests (open field test, startle test, bovine zero maze, exit velocity, pen score, and chute score) were conducted to evaluate different components of animal temperament.
Method Article
The Use of Traditional Fear Tests to Evaluate Different Emotional Circuits in Cattle
In This Article
Summary
Abstract
Animal temperament is complex and has implications for productivity and economic profitability. Quantifying an animal's response to differing stimuli may facilitate breeding selections and identify animals that are better suited to specific management strategies. Multiple tests have been developed to evaluate cattle temperament (e.g., exit velocity, chute score, pen score, open field test, startle test, bovine zero maze), but each of these tests evaluates the animal's response to different stimuli (e.g., isolation, novel environment, startle, willingness to enter an enclosed area). Cattle temperament has been observed to be relatively stable over time. However, the evaluation of temperament has the potential to be influenced by current conditions, previous experiences, and observer bias. Many of these temperament tests have been improperly categorized as fear tests and have also been criticized for being subjective. This paper provides a framework for standardizing behavioral tests for cattle and suggests that these different evaluations assess different aspects of the animal's overall temperament.
Introduction
Animal temperament has been linked to behavioral characteristics such as exploratory behavior and boldness1,2 and can exhibit consistencies over time and across contexts3,4. However, temperament is composed of multiple emotional systems working together. Animals experience physical and psychological stressors, and evaluating the emotional response to both types is challenging. Emotional state can influence how animals perceive stimuli (e.g., cognitive bias), and is a critical component of animal welfare5. Understanding how an individual will behave in response to psychological stressors (e.g., commingling, weaning, change in stockperson) will provide animal managers additional selection criteria when identifying animals that have the skills to cope with psychological stressors.
Emotions are controlled by seven core affective systems within the brain (Table 1)6. These systems include four that control positive emotions: 1) SEEKING (exploration), 2) LUST (sexual excitement), 3) CARE (nurturance), and 4) PLAY (social joy). Three systems control negative emotions 1) FEAR (anxiety), 2) RAGE (anger), and 3) PANIC/GRIEF (separation distress). These affective systems may be heritable7, impact profitability, and are a critical component of animal welfare.
A battery of tests has been developed to evaluate cattle temperament (e.g., exit velocity, chute score). However, the evaluation of temperament has the potential to be influenced by current conditions, previous experiences, and observer bias. While many of these behavioral evaluations are commonly referred to as fear tests, they may be quantifying different emotional components of temperament other than FEAR. In addition, the variation in how these tests have been conducted makes comparisons across different evaluations challenging. Thus, there is a need to understand the relationships among these behavioral evaluations as well as have a standardized protocol for these temperament evaluations.
The goal of this article is to visually document the different fear tests used for cattle; present the type of data that were generated from these different tests; evaluate the repeatability, validity, and reliability of these tests; demonstrate how to evaluate the relationships among the behaviors captured from these tests; and suggest which emotional circuit could be evaluated with each test.
Protocol
All methods described here have been approved by the Institutional Animal Care and Use Committee (IACUC) of Texas A&M University (IACUC2016-0356).
1. Animal and housing
- House yearling ¼ Bos indicus x ¾ Bos taurus steers (n = 32) from the same herd in two drylot pens (n = 16 steers/pen) for 7 days prior to test commencement. At the beginning of the study, steers weighed 270.9 ± 14.8 kg and were fed the same standard growing ration throughout the study.
- Visually evaluate steers daily as part of routine husbandry practices. No steers received medical treatment throughout the duration of the study.
2. Description of the tests
- Test 1: Exit velocity
- Place electronic timers in front of a handling chute so that the distance between the starting and stopping points is 1.8 m. These timers are designed to start timing when the animal breaks the first electronic beam and stop when the animal breaks the second electronic beam.
- Move cattle through the handling facility.
- Catch each animal in the headgate of the chute and keep it restrained for 10 s.
- After 10 s, release the animal from the headgate.
- With the electronic timer, record the time it takes for the animal to traverse 1.8 m from the chute.
- Calculate the velocity of the animal as it leaves the chute by dividing 1.8 m by the time it took for the animal to traverse the 1.8 m after release from the headgate and chute.
NOTE: Other publications have used this data collection strategy8,9,10,11.
- Test 2: Chute score
- Move the cattle through the handling facility.
- Catch each animal in the headgate of the chute for 10 s without applying pressure to its body.
- Have someone observe the cattle for the 10 s and assign each animal a score according to the 2019 Beef Improvement Federation Guidelines for Uniform Beef Improvement Programs 9th Edition (Table 2) based upon its behavior while being restrained.
- After 10 s, release animal from the headgate and chute.
NOTE: Other publications have used this data collection strategy12,13,14.
- Test 3: Pen score
- Place a group of five cattle in a pen (7.3 m W x 7.3 m L x 2.4 m H).
- Have a single human observer that is unknown to the cattle enter the pen on foot and close the gate after entering the pen.
- Have the observer take two steps towards the group of cattle.
- Visually observe each animal's behavior in response to the observer.
- Within 30 s of entering the pen, assign each animal a score according to the 2019 Beef Improvement Federation Guidelines for Uniform Beef Improvement Programs 9th Edition (Table 3).
- Clean the testing arena from urine and feces in between groups of animals.
NOTE: Other publications that have used this data collection strategy10,11.
- Test 4: Bovine zero maze
- Construct a Bovine Zero Maze (BZM).
- Use cattle panels to create a circular track 1.6 m wide, with the inner and outer diameters measuring 6.6 m and 8.2 m, respectively (Figure 1).
- Divide the BZM into four quadrants of equal length with two opposing open quadrants and two opposing closed quadrants where the panels are covered with shade cloth and the shade cloth is stretched across the inner and outer rings of the maze to make a roof over the closed portions of the maze.
- If the test is conducted outdoors, to minimize variation due to shadows, orient the BZM such that the closed sections of the maze face north and south and conduct tests at approximately noon each test day.
- Mount a video camera(s) to capture the entire arena. Turn the camera on and begin recording.
- Using low stress handling practices, move a single animal into an open portion of the maze, and allow the animal to explore the arena for 10 min.
- At the end of the 10 min observation period, return the animal to its home pen.
- Clean the testing arena from urine and feces in between animals.
- Decode the video recordings for frequency and latency of steps, escape attempts, kicks, urinations, defecations, vocalizations, standing bouts, duration of time spent standing, duration of time spent walking, latency to enter closed areas, number of times the animal enters closed areas, amount of time in closed/open portions, number of transitions between open/closed arms. Metrics were identified based upon previously published work15.
- Construct a Bovine Zero Maze (BZM).
- Test 5: Individual Startle Test and the Group Startle Test
- Construct an arena (7.3 m W x 7.3 m L x 2.4 m H) that has a solid, uniform ground surface free of vegetation or manure, and two closed umbrellas at opposite ends of the arena (Figure 2). The umbrellas should be designed so that they open suddenly at the push of a button.
- Ensure that the sides of the arena are solid or covered with plywood or shadecloth to ensure that the animal cannot see outside of the arena.
- Cut a hole at approximately cattle head height on opposite sides of the arena for the umbrella to penetrate through.
- Mount a video camera(s) to capture the entire arena. Turn the video camera on and begin recording.
- Using low stress handling practices, move a single animal into the testing arena. For the group startle test introduce a small group of approximately four animals.
- After the animal(s) has been in the arena for 60 s, open the two umbrellas simultaneously.
- Leave the animal(s) in the arena for 4 min after the umbrellas have opened.
- Clean the testing arena from urine and feces in between tests.
- Decode the video recordings for the frequency and latency of steps, escape attempts, touching the umbrellas, kicks, urinations, defecations, vocalizations, standing bouts, duration of time spent standing, steps in the first 60 s of testing, and steps in the 60 s after the umbrellas were opened for each animal. Metrics were identified based upon previously published work16.
- Construct an arena (7.3 m W x 7.3 m L x 2.4 m H) that has a solid, uniform ground surface free of vegetation or manure, and two closed umbrellas at opposite ends of the arena (Figure 2). The umbrellas should be designed so that they open suddenly at the push of a button.
- Test 6: Open field test
- Construct a square arena (7.3 m W x 7.3 m L x 2.4 m H) that has a solid, uniform ground surface free of vegetation or manure. The sides of the arena should be solid or covered with plywood or shadecloth to ensure that the animal cannot see outside of the arena.
- Mount a video camera(s) to capture the entire arena. Turn the video camera(s) on and begin recording.
- Using low stress handling practices, move a single animal to the center of a solid sided open field testing arena.
- Leave the animal in the arena for 10 min.
- After 10 min, return the animal to its home pen.
- Clean the testing arena from urine and feces in between animals.
- Decode the video recordings for the frequency and latency to first step, escape attempts, kicks, urination, defecation, vocalization, standing bouts, duration of time spent standing, duration of walking, number of steps taken, number of steps taken during the first 60 s of testing. Metrics were identified based upon previously published work17,18,19.
3. Statistical analysis
- Evaluate inter- and intra-test repeatability using a Pearson's Correlation (PROC CORR) and reliability calculated using Cronbach's alpha (PROC CORR). Conduct a validity of response variables with relation to average daily gain (ADG) using a regression analysis (PROC REG).
- After standardizing the variables (PROC STANDARD), use a Cluster Analysis (PROC VARCLUS) to identify relationships among variables from within and among different tests. Many of these variables may be regressed against production metrics to identify production-relevant relationships among cattle behavior during these tests and productivity.
Results
The use of these results can help characterize the behavioral responsivity of cattle to different types of stimuli, and this information may influence individual retention and breeding selection decisions. In general, these tests should be conducted when the animals are young to minimize the impact of previous experience on their behavior20. The relationships among these different behavioral tests may be predictive of behaviors in other tests and with the animal's productivity. Repeatability of these tests also varies, as some tests are relatively consistent over time, while other tests are not.
For each test, we will present the repeatability, validity, and reliability for the metrics collected in that specific test. We will outline the pros and cons to each test as we see them and discuss what emotional circuit may be evaluated. We will then present a sample principle component analysis on the number of steps performed across all tests.
Exit Velocity (EV)
EV may decrease slightly as animals age, but will remain relatively stable9,10,21. There was high repeatability (R = 0.72; p < 0.0001) and the validity with relation to ADG depended on the circumstances (R2 = 0.12, p = 0.03). The reliability was unacceptable (ICC = 0.41). The EV test has a short testing time, an objective response variable, is repeatable and valid, but requires equipment investment, can be influenced by the handling facility and the evaluator's previous experience, and has poor reliability.
Emotional circuit: FEAR
Pen Score (PS)
The PS had low repeatability (R = 0.35; p = 0.05) and its validity with relation to ADG depended on the circumstances (R2 = 0.12, p = 0.03). The reliability was unacceptable (ICC = 0.33). The PS test has a short testing time and multiple animals can be evaluated simultaneously. However, it is subjective. It can be influenced by prior negative experiences to being handled by humans. It can be influenced by the appearance and body language of the evaluator and is risky to the evaluator. There is low repeatability and reliability.
Emotional circuit: PANIC
Chute Score (CS)
CS had slight repeatability (R = 0.15, p = 0.42) and its validity with relation to ADG was unlikely to be useful (R2 = -0.03, p = 0.67). The reliability was poor (ICC = 0.60). CS has a short testing time (10 s/animal), but it is a subjective response variable. It can be influenced by equipment/infrastructure and the evaluator's previous experience. If the hydraulics are too tight, it may cause a vocalization and change the amount of headgate pulling. Previous negative experiences with the facility may artificially inflate the scores. As the animals become older or heavier, the scores will decrease.
Emotional circuit: RAGE
Relationships among EV, PS, CS, and ADG
Figure 3 illustrates the relationships among these four variables. As ADG increased, EV (FEAR; R = -0.41; p = 0.02) and PS (PANIC; R = -0.42; p = 0.02) decreased. No relationship was observed between ADG and CS (RAGE). A positive relationship (R = 0.45; p = 0.01) was observed between PS (PANIC) and EV (FEAR). No relationship was observed between CS (RAGE) and EV nor between CS (RAGE) and PS (PANIC).
Bovine Zero Maze (BZM)
Behavioral responses while in the BZM (SEEKING, PANIC) are presented in Table 4. Because this test is not repeatable22, cattle behavior during repeated testing may not be an accurate indicator of cattle responsivity to an immediate stimulus, but it may be more indicative of a core affective state (e.g., anxiety).
A number of steps had high repeatability (R = 0.71, p = 0.005). The number of standing bouts (R = -0.61) and latency to the first standing bout (R = 0.61) were valid metrics for EV during only the initial test. The total time standing during the first test was a valid metric for ADG. Several steps had unacceptable reliability (ICC = 0.42). The BZM has several repeatable steps. The duration of time spent standing is a valid metric for ADG and standing behavior can be a proxy for EV and ADG. A wide range of variables are evaluated. Cattle behavior is observed without human interference. Response metrics are objective. However, it is resource, time, and labor intensive to construct the maze and conduct the test (10 min/animal for testing only), and it requires video decoding.
Emotional circuit: SEEKING, PANIC
Individual Startle Test
Although the startle test is repeatable, cattle will behave differently during the startle test when they are evaluated individually compared to when they are in a group23. During the individual startle test, cattle may experience isolation stress; therefore, the activation of the PANIC and SEEKING systems may override any FEAR system activation. The number of steps (R = 0.62, p = 0.0008) and number of steps within the first 60 s after the umbrella opens (R = 0.60, p = 0.001) had moderate repeatability. The validity with relation to ADG was unlikely to be a useful (R2 = 0.07) indicator of ADG. Several steps (ICC = -0.06) for the entire testing period had unacceptable reliability. However, the number of steps within the first 60 s after the umbrella opens (ICC = 0.70) had acceptable reliability.
The individual startle test has several metrics that are repeatable and reliable, and a wide range of variables are evaluated. Cattle behavior is observed without human interference. Response metrics are objective. However, it is resource, time, and labor intensive to construct the maze and conduct the test (5 min/animal solely for testing). It requires video decoding and may be confounded by isolation stress.
Emotional circuit for individual startle test: PANIC, SEEKING
Emotional circuit for group startle test: FEAR
Open Field Test
The number of steps (R = 0.67, P = 0.0001) had moderate repeatability. Its validity with relation to ADG is compromised because several steps (R2 = 0.03) are unlikely to be useful. A number of steps (ICC = 0.26) had unacceptable reliability. The open field test has a wide range of variables evaluated. Some steps during the test are repeatable. Cattle behavior is observed without human interference. Response metrics are objective. However, it is resource, time, and labor intensive to construct the maze and conduct the test (10 min/animal solely for testing), and it requires video decoding.
Emotional circuit: PANIC, SEEKING
Multivariate analyses
Cluster analyses identified three primary clusters (FEAR, RAGE, and PANIC/SEEKING) in the data (Figure 4). The number of steps in the Group Startle Test (FEAR) clustered with ADG and EV (FEAR). The number of steps in the BZM (PANIC/SEEKING), OFT (PANIC/SEEKING), and Individual startle test (PANIC/SEEKING) clustered together. CS (RAGE) did not cluster with any of the other variables.
| Emotional System | Behavioral test proposed to detect system activation |
| SEEKING | open field test, novel object test, bovine zero maze, pen score |
| LUST | libido evaluation |
| CARE | maternal behavior, distress surrounding weaning |
| PLAY | TBD |
| FEAR | startle test, exit velocity |
| RAGE | chute score, offspring protection |
| PANIC/GRIEF | social isolation test, bovine zero maze, pen score |
Table 1: Behavioral evaluations that may identify the activation of different emotional systems within the brain.
| Score | Label | Description |
| 1 | Docile | Mild disposition. Gentle and easily handled. Stands and moves slowly during processing. Undisturbed, settled, somewhat dull. Does not pull on headgate when in chute. Exits chute calmly |
| 2 | Restless | Quieter than average, but may be stubborn during processing. May try to back out of chute or pull back on headgate. Some flicking of tail. Exits chute promptly. |
| 3 | Nervous | Typical temperament is manageable, but nervous and impatient. A moderate amount of struggling, movement and tail flicking. Repeated pushing and pulling headgate. Exits chute briskly. |
| 4 | Flighty (wild) | Jumpy and out of control, quivers and struggles violently. May bellow and froth at the mouth. Frantically runs fence line and may jump when penned individually. Exhibits long flight distance and exits chute wildly. |
| 5 | Aggressive | May be similar to Score 4, but with added aggressive behavior, fearfulness, extreme agitation, and continuous movement which may include jumping and bellowing while in chute. Exits chute frantically and may exhibit attack behavior when handled alone. |
| 6 | Very aggressive | Extremely aggressive temperament. Thrashes about or attacks wildly when confined in small, tight places. Pronounced attack behavior. |
Table 2: Description of cattle behavior as evaluated for Chute Scores (Beef Improvement Federation).
| Score | Label | Description |
| 1 | Non-aggressive (docile) | Walks slowly, can be approached closely by humans, not excited by humans or facilities |
| 2 | Slightly aggressive | Runs along fences, will stand in corner if humans stay away, may pace fence |
| 3 | Moderately aggressive | Runs along fences, head up and will run if humans move closer, stops before hitting gates and fences, avoids humans |
| 4 | Aggressive | Runs, stays in back of the group, head high and very aware of humans, may run into fences and gates even with some distance, will likely run into fences if alone in pen |
| 5 | Very aggressive | Excited, runs into fences, runs over humans and anything else in path, “crazy” |
Table 3: Description of cattle behavior as evaluated for Pen Score (Beef Improvement Federation).
| Frequency of behavior performance | Mean ± SEM | Max-Min |
| Steps (count) | 244.11 ± 29.19 | 594 - 34 |
| Escape attempts (count) | 9 ± 1.48 | 29 - 0 |
| Kicks (count) | 8.67 ± 1.17 | 25 - 1 |
| Urinations (count) | 0.32 ± 0.13 | 3 - 0 |
| Defecations (count) | 1 ± 0.29 | 6 - 0 |
| Vocalizations (count) | 0.96 ± 0.3 | 6 - 0 |
| Standing bouts (count) | 10.61 ± 1.06 | 25 - 0 |
| Duration of time spent standing (s) | 200.23 ± 22.59 | 456.32 - 0 |
| Steps (count) during first 60 seconds of testing | 32.18 ± 5.31 | 106 - 0 |
| Latency to perform behavior after entering the Bovine Zero Maze | Mean ± SEM | Max-Min |
| Latency to first step (s) | 18.32 ± 8.36 | 228.7 - 0.03 |
| Latency to first escape attempt (s) | 165.67 ± 38.31 | 600 - 1.6 |
| Latnecy to first direction change (s) | 76.05 ± 14.43 | 290.96 - 2.87 |
| Latency to first urination (s) | 520.31 ± 31.64 | 600 - 42.3 |
| Latency to first defecation (s) | 325.63 ± 52.13 | 600 - 0 |
| Latency to first vocalization (s) | 437.03 ± 45.69 | 600 - 1.7 |
| Latency to first standing bout (s) | 68.72 ± 23.6 | 600 - 0.54 |
Table 4: Frequency and latency to perform behaviors observed while cattle are in the Bovine Zero Maze.
| Individual Startle Test | Group Startle Test | |||
| Frequency of behavior during test | Mean ± SEM | Max-Min | Mean ± SEM | Max-Min |
| Time at which umbrellas open | 63.27 ± 0.35 | 68.34 - 60.09 | 61.2 ± 0.08 | 62.16 - 60.33 |
| Steps (count) | 318.5 ± 37.52 | 948 - 65 | 126.72 ± 12.68 | 312 - 25 |
| Escape attempt (count) | 0 ± 0 | 0 - 0 | 0 ± 0 | 0 - 0 |
| Touches umbrella (count) | 2.27 ± 0.53 | 11 - 0 | 0.03 ± 0.03 | 1 - 0 |
| Kicks (count) | 0.16 ± 0.09 | 3 - 0 | 0 ± 0 | 0 - 0 |
| Urinations (count) | 0.19 ± 0.07 | 1 - 0 | 0.13 ± 0.07 | 2 - 0 |
| Defecations (count) | 0.72 ± 0.12 | 3 - 0 | 0.72 ± 0.15 | 3 - 0 |
| Vocalizations (count) | 0.44 ± 0.29 | 10 - 0 | 0.03 ± 0.03 | 1 - 0 |
| Standing bouts (count) | 7.91 ± 0.56 | 15 - 0 | 8.66 ± 0.52 | 14 - 3 |
| Duration standing (sonds) | 140.87 ± 13.77 | 316.25 - 0 | 188.94 ± 9.91 | 299 - 64.74 |
| Steps in the first 60 seconds of testing (count) | 62.44 ± 8.92 | 248 - 6 | 33.84 ± 3.11 | 81 - 6 |
| Steps in the 60 seconds after umbrellas opened (count) | 72.52 ± 10.1 | 295 - 6 | 27.09 ± 3.76 | 92 - 0 |
| Individual Startle Test | Group Startle Test | |||
| Latency to perform behaviors | Mean ± SEM | Max-Min | Mean ± SEM | Max-Min |
| Latency to first step (s) | 4.14 ± 1.46 | 36.98 - 0.11 | 2.61 ± 0.88 | 28.65 - 0.11 |
| Latency to first escape attempt (s) | - | - | - | - |
| Latency to first umbrella touch (s) | 94.79 ± 14.74 | 282.84 - 11.64 | 157.76 ± 157.76 | 157.76 - 157.755 |
| Latency to first kick (s) | 137.29 ± 16.78 | 167.2 - 93.47 | - | - |
| Latency to first urination (s) | 135.47 ± 38.38 | 293.79 - 29.74 | 52.87 ± 9.39 | 69.66 - 37.17 |
| Latency to first defecation (s) | 104.18 ± 23 | 271.98 - 3.35 | 62.44 ± 13.74 | 196.76 - 15.11 |
| Latency to first vocalization (s) | 67.32 ± 41.27 | 226.89 - 3.83 | 68.15 ± 0.00 | 68.15 - 68.15 |
| Latency to first standing bout (s) | 26.52 ± 7.1 | 193.48 - 0.44 | 11.43 ± 1.76 | 45.4 - 1.12 |
| Latency to first step after umbrella opens (s) | 63.2 ± 1.77 | 84.19 - 6.36 | 65.94 ± 5.09 | 167.34 - 6.96 |
| Latency to first escape attempt after umbrella open (s) | - | - | - | - |
| Latency to first touches of the umbrella after the umbrellas open (s) | 110.2 ± 16.38 | 282.84 - 11.64 | - | 157.76 – 0 |
| Latency to first kick after umbrella opens (s) | 137.29 ± 16.78 | 167.2 - 93.47 | - | - |
| Latency to first urination after umbrella opens (s) | 152.34 ± 40.79 | 293.79 - 29.74 | 67.94 ± 1.72 | 69.66 - 66.21 |
| Latency to first defecation after umbrella opens (s) | 160.57 ± 26.49 | 271.98 – 1 | 90.03 ± 21.26 | 196.76 - 17.39 |
| Latency to first vocalization after umbrella opens (s) | 100.91 ± 44.77 | 226.89 - 11.47 | - | 68.15 – 0 |
| Latency to first standing bout after umbrella opens (s) | 85.59 ± 10.32 | 297.33 - 1.27 | 76.91 ± 5.33 | 182.69 - 15.47 |
Table 5: Frequency and latency to perform behaviors observed while cattle are in the Individual Startle Test and the Group Startle Test.
| Frequency of behaviors during test | Mean ± SEM | Max-Min |
| Steps (count) | 464.28 ± 42.65 | 1607 - 91 |
| Escape attempts (count) | 0.06 ± 0.04 | 2 - 0 |
| Kicks (count) | 0.16 ± 0.06 | 2 - 0 |
| Urinations (count) | 0.14 ± 0.04 | 1 - 0 |
| Defecations (count) | 0.44 ± 0.08 | 2 - 0 |
| Vocalizations (count) | 1.91 ± 0.7 | 32 - 0 |
| Standing bouts (count) | 13.75 ± 0.84 | 40 - 4 |
| Duration of time spent standing (s) | 294.94 ± 17.85 | 562.98 - 48.72 |
| Steps (count) during first 60 seconds of testing | 69.36 ± 7.72 | 297 - 0 |
| Latency to perform behavior | Mean ± SEM | Max-Min |
| Latency to first step (s) | 5.9 ± 2.42 | 148.18 - 0.11 |
| Latency to first escape attempt (s) | 357.81 ± 158.26 | 563.23 - 45.56 |
| Latency to first kick (s) | 355.95 ± 53.7 | 584.58 - 66.51 |
| Latency to first defecation (s) | 135.38 ± 31.51 | 486.29 - 1.98 |
| Latency to first vocalization (s) | 162.67 ± 49.87 | 742 - 8.8 |
| Latency to first standing bout (s) | 28.11 ± 6.06 | 255.97 - 0.35 |
Table 6: Frequency and latency to perform behaviors observed while cattle are in the Open Field Test.
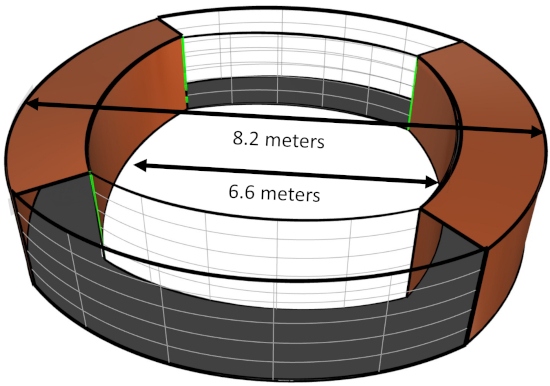
Figure 1: Three-dimensional representation of the Bovine Zero Maze. Please click here to view a larger version of this figure.
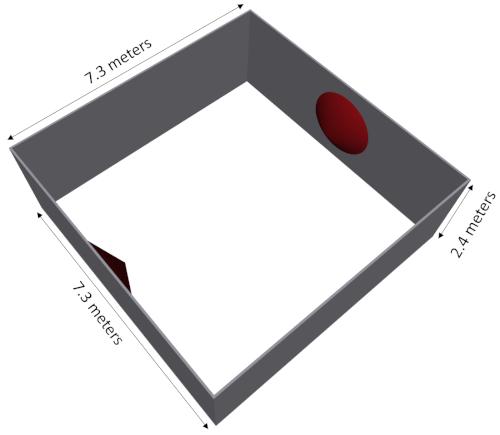
Figure 2: Three-dimensional representation of the arena for Open Field Test, Pen Score, and Startle Test. Maroon circles indicate placement of umbrellas for the Startle Test only. Please click here to view a larger version of this figure.

Figure 3: Relationships among exit velocity, pen score, chute score, and productivity in Bos indicus influenced steers (n = 32). Please click here to view a larger version of this figure.

Figure 4: Representative cluster analysis of behavioral responses of cattle to a variety of fear tests. In this figure, the number of steps performed during the Bovine Zero Maze (BZM), the Individual Startle Test, the Open Field Test (OFT), and the Group Startle Test were evaluated with the Chute Score, Pen Score, Exit Velocity, and Average Daily Gain. Please click here to view a larger version of this figure.
Supplemental Material 1: Animals behaving at the different scores that are described in the manuscript. Please click here to view this file (Right click to download).
Supplemental Material 2: Time-lapse video of constructing the zero maze. Please click here to view this file (Right click to download).
Discussion
Exit Velocity and Chute Score
The EV and the CS are both evaluated while the animal is being processed through a handling chute. Although cattle behavior for both the EV and the CS are quantified during the same scenario, behavioral responses to these two tests are not related24. This suggests that the scenario in which the EV (e.g., escaping from restraint) and the CS (e.g., enduring restraint) are assessed may be perceived differently by cattle, and subsequently evaluate different emotional systems. The EV evaluates the behavior of cattle as they are escaping from restraint and is therefore thought to evaluate the FEAR system while the CS may evaluate RAGE. The CS evaluates the behavior of cattle while being restrained in the handling chute (Table 2), and thus may be a good proxy for the RAGE emotional system.
Substantial research has been conducted on the relationship between EV and production, health, and behavioral traits. While EV can be influenced by an animal's previous experience, this objective metric may be effective in quantifying the FEAR system, as substantial relationships between EV and health, productivity, breeding, and behavior have been identified. Cattle with faster EV have reduced growth rates14, poor carcass quality11,25, reduced immune function20, and higher cortisol levels during handling10. This measurement can provide information about behavior in the home pen, because EV is positively correlated with step counts in the home pen13. From an animal management perspective, cattle with faster EV are more difficult to handle, present greater risk to animal managers, and may influence the behavior of herd-mates. While EV may be a good metric for evaluating FEAR, it does not measure all emotional systems. Therefore, additional tests are required to evaluate all of the emotional systems influencing production and welfare.
Pen Score
The PS subjectively evaluates the cattle's willingness to be approached by a human (Table 3) and may be useful in evaluating the PANIC system. However, the PS has been criticized for lack of objectivity, because different evaluators may have different interpretations of behavior, and several subjective evaluations have suffered from poor inter-rater reliability26.
Startle Test
Anxiety is highly evolved in all prey species. High levels of FEAR help protect the animal from pain and activates the sympatho-adrenal and hypothalamic-pituitary-adrenal axes as part of the fight or flight and stress response to a perceived danger. The startle test evaluates an animal's response to sudden, novel stimuli, and has been identified as an effective measurement in identifying behavioral differences among different genetic strains of pigs27. The startle test may be effective in evaluating the sensitivity and reactivity of the sympatho-adrenal system, which has production-relevant consequences when activated and may provide insight into the FEAR system.
Open Field Test
The OFT is the most commonly used test. The OFT was originally designed to evaluate individual animal boldness, or willingness to enter an open arena, an environment that may be perceived as dangerous and risky to the animal's survival. The OFT has been validated for species that instinctively seek shelter and avoid open spaces, such as rodents, chickens, and turkeys16.
Cattle evolved to live in open fields, thus the OFT may not induce the behavioral and physiological responses associated with FEAR and may be better suited to evaluate social isolation (PANIC/GRIEF) or exploration (SEEKING). Further, the OFT evaluates individual animals, and because cattle are gregarious herd animals, the experience of the OFT may be eliciting an emotional response other than FEAR. The OFT lacks a strong correlation with other FEAR tests and the results are difficult to interpret (i.e., many factors can lead to the same activity). Therefore, the OFT is not recommended as a general FEAR test for cattle16 and may not provide a comprehensive understanding of the FEAR systems in cattle. The OFT may, however, be a useful tool in quantifying either the PANIC or the SEEKING systems in cattle.
The SEEKING system is essential for animals to acquire the resources needed for survival. High SEEKING levels provoke intense, persistent enthusiastic exploration, appetitive and anticipatory excitement, and learning. This system can result in forward locomotion as the animal is motivated to explore its surroundings. SEEKING can play a role in both positive and negative emotions; positive SEEKING may engender a sense of purpose while negative SEEKING may result in behaviors associated with safety28. Cows that spent more time exploring and explored a larger portion of the range (e.g., stronger activation of SEEKING) ate quicker while in confinement, had calves with heavier weaning weights, higher cortisol concentrations during confinement, and shorter postpartum intervals to estrus29. Therefore, the SEEKING system can have production and welfare implications. Identifying animals with high activation of the SEEKING system may be more successful in extensive ranging environments where individual and reproductive fitness is dependent on the animal's capacity to find resources and shelter. However, animals with high activation of the SEEKING system may experience higher levels of stress and frustration during confinement.
Bovine Zero Maze
Commonly used tests in biomedical research that are designed to evaluate the efficacy of anti-anxiety and anti-depressant drug development in rodents are the elevated plus maze (EPM) and the elevated zero maze (EZM)30. These tests exploit the instinctual behavior of the rodent and its natural propensity for dark, closed-in places to quantify their willingness to explore environments that would be inherently fearful or induce anxiety. Metrics from these tests can include the latency to leave the darkened arm of the maze, duration of time in the open and closed arms of the maze, and the number of transitions between the two environments during the testing period as well as the behavior of the animal (e.g., vocalization, urination, defecation, escape attempts) during the test31.
The EPM and the EZM are both well validated tests for quantifying FEAR/ANXIETY in rodents15,31. A modified EPM has been used to quantify the FEAR response in swine32 but has not been utilized in ruminants. However, the EPM has been criticized for its ambiguity of interpretation regarding behavior in the central square of the maze. Therefore, the EZM was designed to evaluate the same metrics as the EPM but allows uninterrupted exploration without ambiguity. When identifying a test to evaluate FEAR/ANXIETY and SEEKING in cattle, the EZM was a logical model. The EZM is conducive to the natural behavior of cattle, as they instinctively move in circular patterns and have a propensity for returning to the areas from which they came.
By applying principles similar to the EZM with an inverse of interpretation, a Bovine Zero Maze33 has been developed to evaluate the FEAR, PANIC/GRIEF, and SEEKING systems in cattle. Cattle evolved to live in open spaces; therefore, cattle with reduced activation of the FEAR and PANIC/GRIEF systems will be more willing to spend time in the open portions of the BZM than the darkened portions of the maze, will be less likely to enter the closed portions of the maze, and will perform more escape attempts.
Quantifying cattle behavior across multiple evaluations may identify complex emotional relationships that can have economic significance, are easily measured, and can be included in breeding selection efforts. The emotional circuits of PLAY, LUST, and CARE were not evaluated in this study.
Disclosures
The authors have nothing to disclose.
Acknowledgements
We are grateful to the students in the Animal Behavior and Welfare Laboratory at Texas A&M University for their assistance in decoding video recordings of cattle behavior and to the personnel at the Animal Science Teaching and Research Center for their assistance with this project. This project was supported by the Texas A&M University Department of Animal Science Graduate Student Research Mini-Grant program.
Materials
| Name | Company | Catalog Number | Comments |
|---|---|---|---|
| Electronic timers | FarmTek, Wylie, TX | ||
| Priefert Cattle Panels | Priefert Rodeo & Ranch Equipment, Mount Pleasant, TX, USA | ||
| Shade Cloth | Windscreen4less, San Bernardino, CA, USA | Heavy Duty Privacy Screen Fence in Color Solid Black | |
| SILENCER Commerical Pro | Silencer Hydraulic Chutes, Stapleton, NE | ||
| Umbrella | WinCraft | Model# A04852, Winona, Minnesota | |
| Video Camera | Canon | Canon VIXIA HF R800 HD, Mellville, NY, USA |
References
- Kurvers, R. H., et al. Personality predicts the use of social information. Ecology Letters. 13 (7), 829-837 (2010).
- Stöwe, M., et al. Novel object exploration in ravens (Corvus corax): effects of social relationships. Behavioural processes. 73 (1), 68-75 (2006).
- Réale, D., Reader, S. M., Sol, D., McDougall, P. T., Dingemanse, N. J. Integrating animal temperament within ecology and evolution. Biological Reviews. 82 (2), 291-318 (2007).
- Sih, A., Bell, A. M., Johnson, J. C., Ziemba, R. E. Behavioral syndromes: an integrative overview. The Quarterly Review of Biology. 79 (3), 241-277 (2004).
- Mendl, M., Burman, O. H., Parker, R. M., Paul, E. S. Cognitive bias as an indicator of animal emotion and welfare: Emerging evidence and underlying mechanisms. Applied Animal Behaviour Science. 118 (3-4), 161-181 (2009).
- Panksepp, J. A critical role for" affective neuroscience" in resolving what is basic about basic emotions. Psychological Review. 99 (3), 554-560 (1992).
- Panksepp, J. Emotional endophenotypes in evolutionary psychiatry. Progress in Neuro-Psychopharmacology and Biological Psychiatry. 30 (5), 774-784 (2006).
- Bruno, K., Vanzant, E., Vanzant, K., McLeod, K. Relationships of a novel objective chute score and exit velocity with growth performance of receiving cattle. Journal of Animal Science. 94 (11), 4819-4831 (2016).
- Burdick, N., et al. Evolution of exit velocity in suckling Brahman calves. Journal of Animal Science. 89 (1), 233-236 (2011).
- Curley, K. Jr, Paschal, J., Welsh, T. Jr, Randel, R. Exit velocity as a measure of cattle temperament is repeatable and associated with serum concentration of cortisol in Brahman bulls. Journal of Animal Science. 84 (11), 3100-3103 (2006).
- King, D., et al. Influence of animal temperament and stress responsiveness on the carcass quality and beef tenderness of feedlot cattle. Meat Science. 74 (3), 546-556 (2006).
- Hall, N. L., et al. Working chute behavior of feedlot cattle can be an indication of cattle temperament and beef carcass composition and quality. Meat Science. 89 (1), 52-57 (2011).
- MacKay, J., Turner, S., Hyslop, J., Deag, J., Haskell, M. Short-term temperament tests in beef cattle relate to long-term measures of behavior recorded in the home pen. Journal of Animal Science. 91 (10), 4917-4924 (2013).
- Voisinet, B., Grandin, T., Tatum, J., O'Connor, S., Struthers, J. Feedlot cattle with calm temperaments have higher average daily gains than cattle with excitable temperaments. Journal of Animal Science. 75 (4), 892-896 (1997).
- Shepherd, J. K., Grewal, S. S., Fletcher, A., Bill, D. J., Dourish, C. T. Behavioural and pharmacological characterisation of the elevated "zero-maze" as an animal model of anxiety. Psychopharmacology. 116 (1), 56-64 (1994).
- Forkman, B., Boissy, A., Meunier-Salaün, M. C., Canali, E., Jones, R. A critical review of fear tests used on cattle, pigs, sheep, poultry and horses. Physiology & Behavior. 92 (3), 340-374 (2007).
- Boivin, X., Le Neindre, P., Chupin, J., Garel, J., Trillat, G. Influence of breed and early management on ease of handling and open-field behaviour of cattle. Applied Animal Behaviour Science. 32 (4), 313-323 (1992).
- Kilgour, R. J., Melville, G. J., Greenwood, P. L. Individual differences in the reaction of beef cattle to situations involving social isolation, close proximity of humans, restraint and novelty. Applied Animal Behaviour Science. 99 (1-2), 21-40 (2006).
- Redbo, I. Relations between oral stereotypies, open-field behavior, and pituitary-adrenal system in growing dairy cattle. Physiology & Behavior. 64 (3), 273-278 (1998).
- Burdick, N., Randel, R., Carroll, J., Welsh, T. Interactions between temperament, stress, and immune function in cattle. International Journal of Zoology. 2011, (2011).
- Gibbons, J. M., Lawrence, A. B., Haskell, M. J. Consistency of flight speed and response to restraint in a crush in dairy cattle. Applied Animal Behaviour Science. 131 (1-2), 15-20 (2011).
- Mathias, A., Forehand, L., Carstens, G., Daigle, C. Quantifying Stress and Anxiety: Development and Validation of a Novel Fear Test for Cattle. Journal of Animal Science. 96, 19(2018).
- Mathias, A., Daigle, C. L. Safety in numbers: Social isolation increases behavioral responses of cattle during startle tests. Journal of Animal Science. 97, 18(2019).
- Lee, C., et al. Anxiety influences attention bias but not flight speed and crush score in beef cattle. Applied Animal Behaviour Science. 205, 210-215 (2018).
- Voisinet, B., Grandin, T., O'Connor, S., Tatum, J., Deesing, M. Bos indicus-cross feedlot cattle with excitable temperaments have tougher meat and a higher incidence of borderline dark cutters. Meat science. 46 (4), 367-377 (1997).
- Czycholl, I., et al. Test-retest reliability of the Welfare Quality animal welfare assessment protocol for growing pigs. Animal Welfare. 25 (4), 447-459 (2016).
- Lawrence, A., Terlouw, E., Illius, A. Individual differences in behavioural responses of pigs exposed to non-social and social challenges. Applied Animal Behaviour Science. 30 (1-2), 73-86 (1991).
- Panksepp, J., Biven, L. The archaeology of mind: Neuroevolutionary origins of human emotions. , WW Norton & Company. (2012).
- Goodman, L. E., et al. Temperament affects rangeland use patterns and reproductive performance of beef cows. Rangelands. 38 (5), 292-296 (2016).
- Walf, A. A., Frye, C. A. The use of the elevated plus maze as an assay of anxiety-related behavior in rodents. Nature Protocols. 2 (2), 322(2007).
- Hogg, S. A review of the validity and variability of the elevated plus-maze as an animal model of anxiety. Pharmacology Biochemistry and Behavior. 54 (1), 21-30 (1996).
- Janczak, A. M., Andersen, I. L., Bøe, K. E., Færevik, G., Bakken, M. Factor analysis of behaviour in the porcine and murine elevated plus-maze models of anxiety. Applied Animal Behaviour Science. 77 (2), 155-166 (2002).
- Hubbard, A. J., Carstens, G. C., Forehand, L., Daigle, C. L. The Bovine Zero Maze: Development of a novel fear test for cattle. Applied Animal Behaviour Science. , 104865(2019).
Reprints and Permissions
Request permission to reuse the text or figures of this JoVE article
Request Permission