Summary
This article reports fabrication, structure and pressure measurement of compressed hosiery by employing direct and indirect methods.
Abstract
This article reports the pressure characteristic measurement of compressed hosiery via direct and indirect methods. In the direct method, an interface sensor is used to measure the pressure value exerted on the lower limbs. In the indirect method, the necessary parameters mentioned by the cone and cylinder model are tested to calculate the pressure value. The necessary parameters involve course density, wales density, circumference, length, thickness, tension, and deformation of the compressed hosiery. Compared with the results of the direct method, the cone model in the indirect method is more suitable for calculating the pressure value because the cone model considers the change in radius of the lower limb from the knee to the ankle. Based on this measurement, the relationship among fabrication, structure, and pressure is further investigated in this study. We find that graduation is the main influence that can change the wales density. On the other hand, elastic motors directly affect the course density and the circumference of the stockings. Our reported work provides the fabrication-structure-pressure relationship and a design guide for gradually compressed hosiery.
Introduction
Compressed hosiery (CH) provides pressure on the lower limb. It can press the skin and further change the vein radius. Thus, the venous blood flow velocity is raised when the patient is dressed in compressed hosiery. CH and other compressed garments could improve venous circulation in the lower limbs1,2,3,4. The therapeutic performance was dependent on the pressure characteristics of the CH5. It was widely believed that raw material and CH structure have a great influence on CH pressure characteristics. Elastane yarn in CH was primarily responsible for the pressure characteristics according to some published research6. For example, Chattopadhyay7 reported the pressure characteristics of knitted circular stretch fabrics by adjusting the feed tension of elastane yarn. In addition, Ozbayraktar8 also determined that the density of elastane yarn increased while the extensibility of CH decreased. Additionally, loop length9, knitted pattern9, and linear density of the yarns7,10 also exhibited the effects on the pressure characteristics.
A numerical model was presented to inspect the generation mechanism of the pressure characteristics of the CH. Laplace’s Law was used for predicting the pressure values. Thomas11 introduced Laplace’s Law into pressure prediction by combining pressure, tension, and body limb size. Similar work also was reported by Maklewska12. To precisely predict the pressure values exerted by the fabric, they presented a semi-empirical equation that was composed of the fitted stress-strain equation and Laplace’s Law. Additionally, Young’s modulus was presented by Leung13 to describe elongation of the CH.
The above-mentioned numerical studies showed deviated experimental results due to ignorance of the CH thickness14. In addition, some researchers believed that the hypothetical cylinder involved in Laplace’s Law was inappropriate to describe the body limbs because the radius of the lower limbs from the thigh to the ankle is not constant but gradually decreases. By combining the thick cylinder theory and Laplace’s Law, Dale14 and Al Khaburi15,16 respectively proposed numerical models to investigate the pressure exerted by the CH with multiple layers. Sikka17 presented a new cone model with a gradually decreased radius from the thigh to the ankle.
The pressure characteristics intrinsic to CH were difficult to quantitatively study because most of the experimental CHs in previous studies were usually purchased commercially. The influences such as pattern, yarn, raw material were uncontrollable. Therefore, in this study, the experimental CHs were controllably fabricated in house. Moreover, this study aims to provide two methods involving direct method and indirect method to measure the pressure characteristics. In the direct method, an interface sensor (Table of Materials) is placed between the skin and textiles to directly measure the pressure value. On the other hand, in the indirect method, the tension and some structure parameters of the CH sample dressing on the artificial lower limb are firstly measured. Then, the results are substituted into the cone model and the cylinder model to calculate the pressure value. The pressure values obtained as a result of the two methods are contrasted and analyzed to find a more appropriate model. The presented methods provide a guideline to the experimental measurement of pressure exerted by the compressed garment.
Subscription Required. Please recommend JoVE to your librarian.
Protocol
1. Fabrication of CH
- Programming
- Open the STAT-Ds 615 MP stocking software and select Plain fabric to create a new sock construction.
- Select the following contents in order: Double welt 1 feed, Transfer without pattern, Plain medical leg from double welt 1 feed, Begin heel from plain medical leg, End of heel and plain medical foot, Begin toe from plain foot 1f, Plain toe with rosso and clip, Sock release without turning device, and End of sock. Press OK button to complete the sock design.
- Select 200 for the Needle and export the program file onto a USB flash disk.
- Switch to Quasar to change the fabrication parameters and click any blue button in the GRADUATION row to open a new window. For fabricating the CH with different structure, enter 500 in the Cylinder S and E columns and click OK to complete the setup.
- Click any one of blue buttons in the ELASTIC MOTORS row to open a new window and enter 800 in the WELT rows and the Cylinder S and E columns. In the Medical leg row, enter 800 in the S column and 650 in column E. Then enter 650 in the ANKLE row and the S and E column and click OK to complete the setup.
- Repeat steps 1.1.4 and 1.1.5. Respectively enter 350 and 650 when adjusting GRADUATION. Respectively enter 1000 and 1200 in the WELT row, and keep the ANKLE row as 650 when adjusting ELASTIC MOTORS.
NOTE: The elastic motors could control the tension of the elastane yarn. Fabricated CH should ensure that the tightness gradually increased from knee to ankle. Here, the elastic motor number in the ANKLE is fixed (650), while the elastic motor number in the WELT is changed (800, 1000, 1200) to fabricate CH samples with different tightness. The graduation could control the loop size of the whole CH sample. Larger loops usually result in looser CH, while smaller loops always generate a tight CH sample. Thus, we respectively input 350, 500, and 650 as the graduation. Finally, program files with altered elastic motors and graduation are generated.
- Knitting
- Prepare the ground yarn and elastane yarn on the CH fabrication machine.
- Turn on the machine, insert the USB flash disk, and select the program file obtained from step 1.1.3. The machine will automatically fabricates the CH sample. Alphabetically number these samples from A to I.
NOTE: Table 1 displays the fabrication parameters of these CH samples.
2. Direct measurement
NOTE: All of the CH samples should be conditioned for 24 h in standard atmospheric environment (23 °C, 65% relative humidity [RH]) prior to measurement. The CH samples are dressed on the artificial lower limb to test the pressure value. All measurements should be performed three times to calculate the average value and decrease the error.
- Mark the lines on the CH sample.
- Place a sample onto an artificial lower limb.
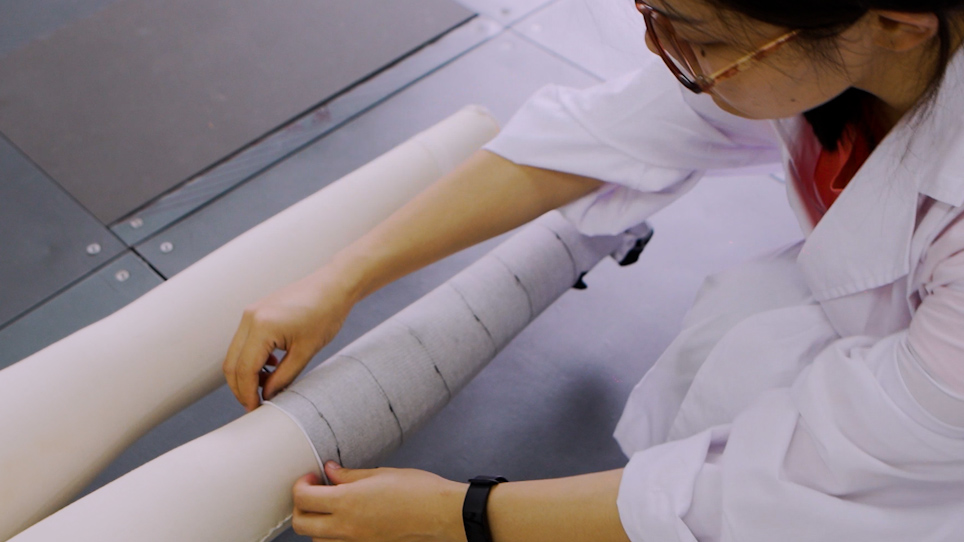
- Mark six, evenly spaced, circle lines on the compressed hosiery sample dressings from the knee to the ankle. Number these lines as line 6, 5, 4.... These lines divide the CH sample into five parts, as shown in Figure 1a.
- Pressure measurement
- To perform a pressure measurement, place the interface pressure sensors under part 1 of the compressed hosiery sample in the anterior, posterior, medial, and lateral directions.
- In the measurement software, select the appropriate serial port COM and set the minimum threshold value as 0.
- Click Start Measurement. Real-time channel 1~4 will display the pressure data
- When the pressure is stable, click Stop Measurement. The software will automatically export the pressure data.
- Place the interface press sensors under other parts of CH sample and repeat steps 2.2.1−2.2.4.
- After pressure measurement of the whole CH sample, remove the CH sample and then dress another CH sample on the artificial lower limb to prepare for the next measurement.
3. Indirect measurement
NOTE: The experiments here measure the necessary parameters of the cone and cylinder model. These parameters contain the deformation and structure parameters of the dressing and undressed CH samples, thickness, tension. All the CH samples should be conditioned for 24 h in standard atmospheric environment (23 °C, 65% RH) prior to measurement. All measurements should be performed three times to calculate the average value and decrease the error.
- Structure parameter measurement of CH samples
- Place a CH sample on the artificial lower limb.
- Use a measuring tape to measure the total length (L) of the sample.
- Use a pick glass to measure the course density and the Wales density of each divided part.
- Measure the circumference (c) of each circle line with measuring tape. Then, calculate the circumference (w) of each divided part of the CH sample by averaging the circumferences (c) of the neighboring circle lines.
- When all of the structure parameter measurements have been acquired, remove the sample from the limb. And then dress another sample on the artificial lower limb to prepare for next measurement.
- Measure the circumference (c’) of each circle line of an undressed CH sample. Then, calculate the circumference (w’) of each divided part of CH sample by averaging the circumferences of the neighboring circle lines.
- Measure the course density and the wales density of the same divided part of the undressed CH sample.
- Thickness measurement
- Smooth a compressed hosiery sample onto the steel round table of the thickness gauge.
- Turn on the thickness gauge to let another steel round slowly fall down to press onto the sample piece. The screen will display the thickness data (t).
- Move the sample and repeat steps 3.2.1 and 3.2.2 to test the thickness of other parts.
- Tensile experiment
- Cut all the CH samples along the marked circle lines.
- Clamp one piece of sample into the tensile testing instrument.
- Open the software for tensile experiment, input 5 N as the initial tension, 60 mm/,min as the tensile speed, and 200 mm as the initial tensile length. Keep the default setup for the other fields.
- When all of the measurement parameters have been set, click START to run tensile experiment automatically. The computer will export real-time stress and strain on the screen. The tensile experiment will automatically stop when the CH piece is broken.
- Then replace the broken piece of sample with a new sample piece for the next round of testing and repeat steps 3.3.3−3.3.4.
4. Theoretical calculation
NOTE: The cylinder model and cone model are employed in the indirect measurement to calculate the exerted pressure. Each CH sample is separated into five parts from the knee to the ankle. In the cylinder model, human limbs are described as a cylinder with a constant radius while the radius of the limb is variable in the cone model. The schematic diagrams are illustrated in Figure 1b and Figure 1c. All calculation steps are performed in Matlab 2018a and the calculation program can be found in the Supplemental Coding File.
- Cylinder model
- According to the measured results obtained from step 3.1.3−3.1.5, calculate the circumference difference (D) between the dressed CH and the undressed CH using the following equation:

where i is the number of CH piece that is separated by marked circle lines. It is numbered according to the circle line number. - Fit the stress-strain curve obtained in step 3.3.4 using an appropriate linear equation. The slope of the linear equation is the tensile modulus E.
- Calculate the tension in the dressing CH (T) by employing the equation:

NOTE: Supplemental Table 1 displays the obtained original tensile modulus E and tension T. - Based on the cylinder model and the thin wall assumption15, express the exerted pressure of CH piece i as:
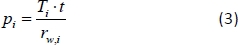
where r is the radius of divided part and equals to , t is the thickness of CH sample, and T is the tension calculated from step 4.1.3.
 - Calculate all the exerted pressure of CH pieces following steps 4.1.1−4.1.4.
- According to the measured results obtained from step 3.1.3−3.1.5, calculate the circumference difference (D) between the dressed CH and the undressed CH using the following equation:
- Cone model
- Calculate the exerted pressure of the CH piece i by the following equation14:
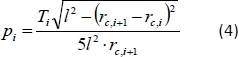
where rc is the radius of circle line and equals to , T is the tension calculated from step 4.1.3, l is the length of each divided piece and can be calculated by l = L/5 (herein, L is measured following step 3.1.2).
- Calculate the exerted pressure of the CH piece i by the following equation14:


 , t is the thickness of CH sample, and T is the tension calculated from step 4.1.3.
 , T is the tension calculated from step 4.1.3, l is the length of each divided piece and can be calculated by l = L/5 (herein, L is measured following step 3.1.2).
Subscription Required. Please recommend JoVE to your librarian.
Representative Results
Course density gradually increases from the knee to the ankle in Figure 2a. This is explained by the influence of the elastic motor. From the knee to the ankle, the increased elastic motor gradually generates increasing tension from part 5 to part 1 in the CH fabrication process. Thus, the CH sample is gradually frapped and the loop number per cm is increased in the course direction. The experimental lines in Figure 2b can be divided into three groups: ABC, DEF, GHI. Group ABC is fabricated with the smallest graduation value and obtains the highest wales density, while group GHI is produced by the largest graduation value and gets the lowest wales density. In the fabrication process, graduation affects the sinking depth of the needle. Larger sinking depth will generate longer loops, and the loop number per cm along the length direction will decrease. Thus, the CH samples fabricated with the highest graduation value demonstrate the lowest wales density and vice versa. Figure 2c and Figure 2d exhibit the circumference of the divided parts on the undressed and the dressed CH sample.
In order to investigate the influence of fabrication on the structure, ANOVA is employed to analyze the data and the results are listed in Table 2. The sig. in Table 2 represents the significance level that describes the influence. The data exhibited that the use of an elastic motor has a significant effect on the circumference and the course density of the divided parts. While, exerts a significant effect on the wales density. The details of structure parameters can be found in Supplemental Table 2.
Here representative pressure data obtained from direct and indirect measurement can be observed in Figure 3. From part 1 to part 5 (from the ankle to the knee), the exerted pressure magnitude of all CH samples gradually declines. It is clear that the cylinder model measurements slightly deviated from the direct measurements, indicating that the predicted pressure data from the cylinder model is inconsistent with the measured pressure. While, comparing with measured pressure, the cone model demonstrates good agreement. To further quantitatively study the differences between the cone and cylinder models, the Spearman correlation method is used to analyze all the data (Figure 4). The correlation coefficient between the cone model and the measured pressure is 0.9914, which is higher than 0.9221 that represents the correlation coefficient between the cylinder model and the measured pressure. Therefore, the cone model is a better model for predicting the pressure characteristic than the cylinder model. All the measured and predicted pressures could be found in Supplemental Table 3 and Supplemental Table 4.

Figure 1: The numerical model of lower limb. (a) The separated five parts divided by six circle lines on the lower limb, (b) the lower limb model described by the cylinder model, and (c) the lower limb model described by the cone model. This figure has been modified from Zhang et al.18. Please click here to view a larger version of this figure.

Figure 2: Structure measurement of CH. (a) Course density, (b) wales density, (c) circumference of divided parts on the original CH, and (d) circumference of divided parts on the wearing CH. The error bar represents the standard deviation of data. This figure has been modified from Zhang et al.18. Please click here to view a larger version of this figure.

Figure 3: Measured and calculated pressure values. ○ = measured results, Δ = cylinder model, and * = cone model. This figure has been modified from Zhang et al.18. Please click here to view a larger version of this figure.

Figure 4: Correlation between the measured and calculated pressure values. This figure has been modified from Zhang et al.18. Please click here to view a larger version of this figure.
| CH samples | Graduation | Elastic motors (from circle 6 to circle 1) | Elastane yarn fineness (tex) |
| A | 350 | 650−800 | 190 |
| B | 350 | 650−1,000 | 155 |
| C | 350 | 650−1,200 | 130 |
| D | 500 | 650−800 | 155 |
| E | 500 | 650−1,000 | 130 |
| F | 500 | 650−1,200 | 190 |
| G | 650 | 650−800 | 130 |
| H | 650 | 650−1,000 | 190 |
| I | 650 | 650−1,200 | 155 |
Table 1: Fabrication parameters of CH samples.
| Graduation | Elastic motors | Elastane yarn fineness | |
| Sig. Cross density | 0.0459 | 0.0302 | 0.2238 |
| Sig. Wales density | 0.0025 | 0.1435 | 0.2652 |
| Sig. Circumference | 0.0529 | 0.0466 | 0.1071 |
Table 2: ANOVA results to display the effects of fabrication parameters on the CH structure.
Supplemental Table 1: The obtained parameters tension (N) and tensile modulus (kPa). Please click here to download this table.
Supplemental Table 2: The measured data of structure parameters. Please click here to download this table.
Supplemental Table 3: Measured pressure characteristics (kPa). Please click here to download this table.
Supplemental Table 4: Predicted pressure results from cylinder model and cone model (kPa). Please click here to download this table.
Supplemental Coding File. Please click here to download this file.
Subscription Required. Please recommend JoVE to your librarian.
Discussion
In this study, we provide two methods to measure the exerted pressure of CH samples and these methods can be used to measure the exerted pressure of other garment dressing on the skin. In the direct method, the CH sample is dressed on the artificial lower limb and the interface sensor is placed under the CH sample. The pressure value can be displayed on the screen using data collection software. To compare with the direct method, we also supply an indirect method. Two theories involving the cylinder model and the cone model are employed to calculate the pressure. In order to obtain the pressure distribution, the CH sample is separated into five parts by marking six evenly spaced circle lines (Figure 1a). The necessary structure parameters including course density, wales density, length, circumference, and thickness are measured on each CH part dressed on the artificial lower limb, as well as on each undressed CH part. To obtain tensile modulus distribution, the CH sample is cut into five pieces along the circle lines and each piece is stretched on the tensile experiment until it is broken. Combined with tensile modulus and structure parameters, the pressure values calculated by cone model and cylinder model are provided.
We also demonstrate the correlation analysis between the direct method and the indirect method (Figure 4). The correlation analysis confirms that the cone model is a better model to predict the pressure characteristics than the cylinder model because of the change in limb radius in the cone model. Thus, the cone model can be employed to effectively predict the pressure distribution of a compressed garment. The methods mentioned in this article also supply experimental ideas and a guide to the pressure measurement of compressed garment.
Additionally, we fabricate the CH samples instead of purchasing commercially. Thus, we can further explore the relationship between the CH structure and its fabrication. In the software of stocking fabrication machine, we adjust Graduation and Elastic Motors to change the structure of the final CH. Graduation is set as 350, 500, and 650; Elastic Motors is set as 650-800, 650-1,000, and 650-1,200 (welt-ankle). Elastane yarns with 130, 155, 190 tex are used in the knitting process. The fabrication parameters are listed in the Table 1. Through the ANOVA method, the influence of fabrication parameters on the structure is investigated. Due to the limit of the experimental condition, other values of Graduation and Elastic Motors are not employed and the yarns with other fineness are also not applied. We will further study the details of each fabrication parameter in the future. The method and corresponding results presented in this work have experimental significances in the knitting field.
Subscription Required. Please recommend JoVE to your librarian.
Disclosures
The authors have nothing to disclose.
Acknowledgments
The authors disclose receipt of the following financial support for the research, authorship, and/or publication of this article: National Key R&D Program of China, Grants No. 2018YFC2000900, National Natural Science Foundation of China, Grants No. 11802171, Program for Professor of Special Appointment (Eastern Scholar) at Shanghai Institutions of Higher Learning, and the Talent Program of Shanghai University of Engineering Science.
Materials
| Name | Company | Catalog Number | Comments |
| Artificial lower limb | Dayuan, Laizhou Electron Instrument Co., Ltd. | YG065C | Used for measuring the strength of stockings. The employing test standard is ISO 13934-1-2013, metioned this in section 3.3 |
| CH fabrication machine | Hongda, Co., Ltd. | YG14N | Used for measuring the thickness of stockings, the test standard is ISO 5084:1996, metioned this in section 3.2 |
| Elastane yarn | MathWorks, Co., Ltd. | 2018a | Used for calculating the pressure, mentioned this in section 4. |
| FlexiForce interface pressure sensors | Qile, Co., Ltd. | Y115B | It is composed of magnifying glass with a fixed ruler. Used for counting the loops number per cm in the fabricated CH, metioned this in the sction 3.1.3 and 3.1.7. |
| FlexiForce measurement software | Santoni, Co., Ltd. | GOAL 615MP | Used for fabricating stockings, metioned this in section 1.2 |
| Ground yarn | Santoni, Co., Ltd. | It is a kind of coverd yarn which is composed of 80% rubber and 20% viscose, metioned this in section 1.2.1 | |
| Matlab software | Santoni, Co., Ltd. | It is a kind of coverd yarn which is composed of 30% polyamide and 70% cotton, metioned this in section 1.2.1 | |
| Mechanical testing instrument and software | Santoni, Co., Ltd. | GOAL 615MP | Used for programing the fabrication parameters, metioned this in section.1.1 |
| Pick glass | Shenmei, Inc. | F002 | A standard artificial femal with 160 cm height. The size was consited with Chinese Standard GB 10000-1988. The artificial femal was made by glass-reinforced plywood and covered by fabric. Mentioned this in section 2.1. |
| STAT-Ds 615 MP stocking software | Tekscan, Inc. | A201 | Used for measuring the pressure on the skin, metioned this in section 2.2.1 |
| Thickness gauge | Weike, Co., Ltd. | 1lbs | Used for recording the pressure, metioned this in section 2.2.2-2.2.4. |
References
- Partsch, H. The static stiffness index: a simple method to assess the elastic property of vcompression material in vivo. Dermatologic Surgery. 31 (6), 625-630 (2010).
- Dissemond, J., et al. Compression therapy in patients with venous leg ulcers. Journal der Deutschen Dermatologischen Gesellschaft. 14 (11), 1072-1087 (2016).
- Mosti, G., Picerni, P., Partsch, H. Compression stockings with moderate pressure are able to reduce chronic leg oedema. Phlebology. 27 (6), 289-296 (2012).
- Rabe, E., Partsch, H., Hafner, J. Therapy with compression stockings in Germany-Results from the Bonn Vein Studies. Journal der Deutschen Dermatologischen Gesellschaft. 11 (3), 257-261 (2013).
- Liu, R., Lao, T. T., Kwok, Y. L., Li, Y., Ying, M. T. Effects of graduated compression stockings with different pressure profiles on lower-limb venous structures and haemodynamics. Advances in Therapy. 25 (5), 465 (2008).
- Bera, M., Chattopadhyay, R., Gupta, D. Influence of linear density of elastic inlay yarn on pressure generation on human body. Journal of Industrial Textiles. 46 (4), 1053-1066 (2016).
- Chattopadhyay, R., Gupta, D., Bera, M. Effect of input tension of inlay yarn on the characteristics of knitted circular stretch fabrics and pressure generation. Journal of Textiles Institute. 103 (6), 636-642 (2012).
- Ozbayraktar, N., Kavusturan, Y. The effects of inlay yarn amount and yarn count on extensibility and bursting strength of compression stockings. Tekstil ve Konfeksiyon. 19 (2), 102-107 (2009).
- Maleki, H., Aghajani, M., Sadeghi, A. H. On the pressure behavior of tubular weft knitted fabrics constructed from textured polyester yarns. Journal of Engineered Fibers & Fabrics. 6 (2), 30-39 (2011).
- Bera, M., Chattopadhyay, R., Gupta, D. Effect of linear density of inlay yarns on structural characteristics of knitted fabric tube and pressure generation on cylinder. Journal of Textiles Institute. 106 (1), 39-46 (2015).
- Thomas, S. The use of the Laplace equation in the calculation of sub-bandage pressure. World Wide Wounds. 3 (1), 21-23 (1980).
- Maklewska, E., Nawrocki, A., Ledwoń, J. Modelling and designing of knitted products used in compressive therapy. Fibres & Textiles in Eastern Europe. 14 (5), 111-113 (2006).
- Leung, W. Y., Yuen, D. W., Shi, S. Q. Pressure prediction model for compression garment design. Journal of Burn Care Research. 31 (5), 716-727 (2010).
- Dale, J. J., et al. Multilayer compression: comparison of four different four-layer bandage systems applied to the leg. European Journal of Vascular & Endovascular Surgery. 27 (1), 94-99 (2004).
- Al-Khaburi, J., Nelson, E. A., Hutchinson, J., Dehghani-Sanij, A. A. Impact of multilayered compression bandages on sub-bandage pressure: a model. Phlebology. 26 (1), 75-83 (2011).
- Al-Khaburi, J., Dehghani-Sanij, A. A., Nelson, E. A., Hutchinson, J. Effect of bandage thickness on interface pressure applied by compression bandages. Medical Engineering & Physics. 34 (3), 378-385 (2012).
- Sikka, M. P., Ghosh, S., Mukhopadhyay, A. Mathematical modeling to predict the sub-bandage pressure on a cone limb for multi-layer bandaging. Medical Engineering & Physics. 38 (9), 917-921 (2016).
- Zhang, L. L., et al. The structure and pressure characteristics of graduated compression stockings: experimental and numerical study. Textile Research Journal. 89 (23-24), 5218-5225 (2019).