The Flypub assay measures the behaviors that the fruit fly Drosophila melanogaster displays under the influence of ethanol. The assay can be readily mastered by experimenters at all levels and applied to various vaporized stimuli, facilitating substance abuse and addiction studies.
Method Article
Flypub To Study Ethanol Induced Behavioral Disinhibition and Sensitization
* These authors contributed equally
In This Article
Summary
Abstract
Alcohol use disorder (AUD) remains a serious problem in our society. To develop effective interventions for addiction, it is important to understand the underlying neurobiological mechanisms, for which diverse experimental approaches and model systems are needed. The main ingredient of alcoholic beverages is ethanol, which causes adaptive changes in the central nervous system and behavior upon chronic intake. Behavioral sensitization (i.e., escalated responses) in particular represents a key adaptive change underlying addiction. Most ethanol-induced behavioral sensitization studies in animal models have been conducted on the locomotor activating effect of ethanol. A prominent effect of ethanol is behavioral disinhibition. Behavioral sensitization to the disinhibition effect of ethanol, however, is underrepresented. To address this issue, we developed the Flypub assay that allows measuring the escalated increase in disinhibited courtship activities upon recurring ethanol exposure in Drosophila melanogaster. Here, we report the step-by-step Flypub assay including assembly of ethanol exposure chambers, setup of the assay station, criteria for fly care and collection, ethanol delivery, quantification of disinhibited courtship activities, data processing and statistical analysis. Also provided are how to troubleshoot critical steps, overcome limitations and expand its utility to assess additional ethanol-induced behaviors. The Flypub assay in combination with powerful genetic tools in Drosophila melanogaster will facilitate the task of discovering the mechanism underlying ethanol-induced behavioral sensitization.
Introduction
Alcohol is one of the most readily available and widely consumed drugs in the world. It has high potential for misuse and addiction; however, the mechanism underlying this process remains incompletely understood. Ethanol induces disinhibition, euphoria, cognitive impairment, hyperactivity, loss of motor control and sedation in worms1, fruit flies1,2,3, mice4, rats5 and humans6, indicating common neurobiological components mediating ethanol’s effects from invertebrates to mammals including humans. Chronic ethanol intake causes neural adaptations and behavioral modifications that underlie AUD. One of the adaptations is behavioral sensitization defined as the augmented response with repeated experiences of ethanol7,8,9 or other addictive substances10,11,12.
Over the decades, the studies on ethanol-induced behavioral sensitization (EIBS) have focused on the locomotor-stimulating effect, which is used as a proxy for a euphoric response7,8,9,13. For example, rats or mice upon repeated (every 24, 48 or 72 h) ethanol administration display the augmented locomotor activity as measured by walking speed8,14,15,16,17,18,19,20,21. Similarly, the fruit flies subjected to the second exposure to ethanol vapor 4 h after the first exposure exhibit the enhanced locomotor response as measured by walking speed as well22. While no information is available on the mechanism underlying EIBS to the locomotor-stimulating effect in fruit flies, the studies in rats and mice have uncovered the molecular and signaling components (for example, the dopamine, glutamate and GABA systems) as well as neural substrates and circuit (for example, the ventral tegmental area, nucleus accumbens, amygdala and prefrontal cortex) that play major roles for EIBS6,9,23.
Disinhibition is a major effect of ethanol and leads to manifestation of behaviors that are typically restricted. The disinhibiting effect is exerted on motor, emotional, social, sexual and cognitive functions, which may lead to inappropriate sexual behavior, verbal or physical aggression and impulsive acts in humans and animal models24,25,26,27,28,29. Ethanol-induced disinhibition has been investigated in animal models for mechanistic studies and they include motor impulsivity and aggression in rodents and monkeys as well as foraging disinhibition in worms6,9,24,28,29,30. We have demonstrated that fruit flies show disinhibited sexual behavior under the influence of ethanol31. Specifically, wild-type males flies rarely court other males without ethanol31 and when they do, courtees actively reject courting males. Under the influence of ethanol, however, male flies show more courtship toward other males and courtees exhibit less rejection, resulting in overall enhanced intermale courtship. Notably, flies develop behavioral sensitization to the disinhibition effect upon recurring ethanol exposure, which serves as a unique system to study EIBS31,32.
In this report, we describe how to set up, perform, troubleshoot and analyze the Flypub assay and data to study ethanol-induced disinhibition and sensitization in the fruit fly Drosophila melanogaster. To provide its utility and effectiveness, we tested the wild-type Canton-S (CS; control fly strain) along with the flies deficient in tyramine β hydroxylase (tβh) that synthesizes octopamine (OA). OA is a major neuromodulator in invertebrates33,34 and plays a key role in the development of ethanol tolerance in flies22. We report here for the first time that OA is important for EIBS.
Protocol
NOTE: The protocol section details the preparatory, Flypub assay and analysis steps that include (1) assembly of the chamber, (2) fly care and collection, (3) assay station setup, (4) ethanol exposure, (5) courtship scoring and data analysis, and (6) statistical analysis. The key steps for conducting the Flypub assay and analysis is depicted in a workflow (Figure 1).
1. Assembly of the chamber (Figure 2)
- Cut off the bottom portion of the round Drosophila bottle at the 25 mL mark using a razor blade.
- Make a hole, 5 mm in diameter, at the 50 mL mark of the bottle using a hot soldering iron.
NOTE: This is the access point where the flies will be transferred into the chamber. - Cut a mesh sheet into a circle, 54 mm in diameter, to fit in the Drosophila bottle at the 75 mL mark.
- Secure the mesh at the 75 mL mark of the bottle using hot glue.
- Cut the polycarbonate plastic sheet into a circle, 70 mm in diameter.
- Attach the polycarbonate plastic sheet to the bottle at the 25 mL mark (bottom open area made in step 1.1) using hot glue.
- Pressure down using weights to ensure that the polycarbonate round is firmly attached to the bottom.
- Wash the pubs with ethanol to remove any odors and profusely rinse them multiple times under running distilled water. Shake the pubs vigorously to remove excess water.
- Dry the pubs by laying them down horizontally on paper towels at room temperature.
2. Fly care and collection
- Maintain the flies on a standard cornmeal/agar/sugar/yeast food medium (https://bdsc.indiana.edu/information/recipes/harvardfood.html).
- Collect one- to two-days old male flies into a group of 33, which represent one data point, under carbon dioxide (CO2) anesthesia. Make sure to select the flies with intact morphology and put them in a food vial to recover.
NOTE: Two more or three less flies per group are tolerable. Behaviors can be sensitive to experimental settings thus a total fly number per pub may need to be adjusted with a control fly line.
NOTE: Make sure that the food vial is laid down on the side so the anesthetized flies do not get stuck to the food. - Keep the flies in the 25 °C incubator with at least 50% relative humidity and a 12 h light / 12 h dark cycle for 2 days prior to ethanol exposure.
NOTE: CO2 clearance is critical to eliminate any CO2-induced physiological or behavioral effects that may alter ethanol-induced responses. - Use codes to blind fly genotypes or treatment conditions to the experimenters conducting ethanol exposure and scoring courtship behaviors.
NOTE: Blind tests help eliminate experimental bias.
3. Assay station set up (Figure 3A)
- Set up a copy stand with an attached center arm on a bench top in a well-ventilated room.
NOTE: The copy stand is not mandatory. Any staging device that provides a level platform is sufficient. - Clamp the two lateral arms to the stand, with each arm approximately 18 cm out from the center of the stand.
- Place a fluorescent light on each arm of the stand and one in the middle.
- Attach the video recorder to the center arm, approximately 38 cm above the center of the base. This will record the pubs from a top view.
- Cover the base of the stand with white paper, which helps visualize dark-colored flies to create contrast.
- During the day of exposure, turn on the fluorescent lights and the computer connected to the video camera that is attached to the copy stand (Figure 3A).
NOTE: The light intensity 2100-2200 lux provides good quality of recorded behaviors for scoring. However, ambient lighting conditions in the laboratory are sufficient to observe ethanol-induced courtship activities. - Prepare the items to be used for ethanol exposure depicted in Figure 3B.
- Gather six clean, assembled pubs for a set of experiments and label them with the code 1 through 6.
NOTE: Make sure to place the randomized codes on fly genotypes or treatment conditions.
4. Ethanol exposure (Figure 3)
- Gently transfer a group of 33 males into a Flypub chamber through the hole at the 50 mL mark using a small funnel.
NOTE: To minimize mechanical stress to the flies, place a mouse pad or any cushioning material under the pub during transfer. - Cover the hole with a tape.
NOTE: The tape is used to close the hole, preventing flies from escaping out of the pub. - Align the pubs on the stage from 1 to 6.
- Acclimate the flies to the chamber for 10 min (Figure 3D).
- Adjust the camera settings including the focus, zoom and brightness, and record the last 5 min of acclimation to measure a basal courtship level.
NOTE: To eliminate glare generated by light reflection from a pub, place lab wipes (typically 4 layers or less than 1 mm thickness) at the bottom of the pub to adjust the angle. - Prepare cotton pads for ethanol delivery by cutting a pad into four equal quadrants with clean scissors and then trim the corners to make it fit into a Petri dish during acclimation (Figure 3C).
NOTE: Do not use bare hands to handle the cotton pads. Use forceps to handle the cotton pads to avoid any potential transfer of odors. - Add a cotton pad into each Petri dish.
- Add 1 mL of 95% ethanol to each cotton pad, make sure for ethanol solution to be evenly distributed on the entire area of the pad.
- Cover with double-layered lab wipes to avoid fast ethanol evaporation.
- Place the small Petri dish containing the ethanol-soaked cotton pad and the double-layered lab wipes through the bottom opening of the pub after acclimation.
- Align the pubs on the stage, begin recording and simultaneously start a timer.
- Record the pubs containing flies during ethanol exposure until the flies stop courting or moving due to sedation.
- Remove the Petri dish containing ethanol from each pub with a spatula when over 90% of the flies are sedated.
- Gently transfer flies back to their assigned vials through the hole at the 50 mL mark in the pub.
NOTE: Place a funnel on top of food vials to aid in transfer. Make sure to place sedated flies on the side of the food vials to prevent them from getting stuck in the food. - Clean the pubs with ethanol to remove any odors and profusely rinse them multiple times under running distilled water. Shake the pubs vigorously to remove excess water.
- Dry the pubs by laying them down horizontally on paper towels at room temperature.
- Keep the flies in the 25 °C incubator with at least 50% relative humidity and a 12 h light / 12 h dark cycle.
- Repeat the steps 4.1-4.17 every 24 h for six consecutive days and make sure to conduct the ethanol exposure at the same time of the day to avoid any circadian effects.
NOTE: Change food vials every 2 – 3 days to maintain healthy flies.
5. Courtship scoring and data analysis (Figure 4-6)
- Open the recorded videos using a media player (e.g., VLC) and zoom in the video to clearly observe flies to score (Figure 4A).
- Attach the time code to the video (Figure 4B).
- Count the number of males engaged in courtship activities including following, unilateral wing extension, courtship chain, courtship circle, abdominal bending and mounting for every 10 s time block31 (Figure 5).
- Enter the number of males displaying courtship for every 10 s time block into a worksheet (Figure 6A).
- Use the maximal number of courting males in the three consecutive 10 s time blocks as a representative data point (Figure 6B).
- Calculate the average of 10 consecutive data points having the highest value (Figure 6C) and this represents the percentage of intermale courtship per pub (Figure 6A).
6. Statistical analysis (Supplemental Figure 1)
- Open statistical analysis software (e.g., Minitab 17) and add courtship data in the worksheet.
NOTE: Any statistical analysis software can be used. - To determine the distribution of the data (either normal or non-normal distribution), go to the Stat tab, select Basic Statistics, and click on the Normality Test option (Supplemental Figure 1Ai).
- In Variable, select individual columns (each column representing a data set of a genotype or treatment under study), choose the Anderson-Darling test, and click OK (Supplemental Figure 1Aii).
NOTE: The Normality Probability Plot will show the calculated P-Value: if the P-Value is greater than 0.05, then the data are normally distributed. If the P-Value is less than 0.05, the data are non-normally distributed (Supplemental Figure 1Aiii). - For comparison of multiple groups, stack the columns to compare by clicking the Data tab, select Stack, and then Columns (Supplemental Figure 1Bi).
- In the Stack Columns window, select the data columns to be stacked, select the stacking done either in New worksheet or Column of current worksheet with the next column designated for denoting subscript (e.g., data group identity; Supplemental Figure 1Bii-1Biii).
- Click the Stat tab, select the ANOVA test, select the General Linear Model and then click the Fit General Linear Model (Supplemental Figure 1Ci).
- In the General Linear Model window, select the columns to be compared in the Responses box, select the column with subscript in the Factors box and click OK, which leads to the statistical analysis results (Supplemental Figure 1Cii-1Ciii).
- For comparison of two groups with normally distributed data, click the Stat tab, select the Basic Statistics, and select the 2-Sample t-test (Supplemental Figure 1Di).
- In the 2-Sample t for the Mean window, select Each sample is in its own column, from a dropdown box, select the two groups to compare in the Sample 1 and Sample 2 boxes and then click OK, which leads to the statistical analysis results (Supplemental Figure 1Dii-1Diii).
- For comparison of two groups with non-normally distributed data, go to the Stat tab, select Nonparametrics and click Mann-Whitney (Supplemental Figure 1Ei)
- In the Mann-Whitney window, select the two groups to compare in the First Sample and Second Sample boxes and then click OK, which leads to the statistical analysis results (Supplemental Figure 1Eii-1Eiii).
- For comparison of three or more groups of non-normally distributed data, go to the Stat tab, select Nonparametrics, and then click the Kruskal-Wallis test (Supplemental Figure 1Fi).
- In the Kruskal-Wallis window, select the columns to be compared in the Response box, select the column with subscript in the Factor box and click OK, which leads to the statistical analysis results (Supplemental Figure 1Fii-1Fiii).
Results
This section demonstrates the results of a representative Flypub experiment. Drosophila males rarely court other males35,36. During the first ethanol exposure, the wild type Canton-S (CS) males exhibited a small but insignificant increase in the disinhibited intermale courtship31 (Figure 7A). However, CS males showed the escalated increases in the disinhibited courtship activity in subsequent ethanol exposures (ANOVA GLM, CS: R2=0.83, F(5,66) =65.21, p < 0.0001; n = 12; Figure 7A), which indicates behavioral sensitization to the disinhibition effect of ethanol. We have previously shown that this type of EIBS requires dopamine and the dopamine receptor DopEcR in the mushroom neurons31,32.
To identify whether additional neuromodulators are involved in EIBS, we investigated the role of OA by testing the flies (tβh; nM18 null allele)37,38 lacking tyramine β hydroxylase, the rate-limiting enzyme in the OA biosynthesis, thus deficient in OA. The tβh males in the CS genetic background (a kind gift from Dr. Andreas Thum, University of Leipzig , Germany) displayed the sensitized disinhibited courtship response upon daily ethanol exposures (ANOVA GLM, tβh: R2=0.67, F(5,66) =27.60, p < 0.0001; n = 12; Figure 7B) but at the reduced level compared to CS (ANOVA GLM, interaction effect: F =2.50, p <0.034). Upon post hoc analysis, tβh males exhibited lower levels of intermale courtship at each exposure that is most evident during the fourth through sixth ethanol exposures when compared to CS (Two-sample t-test: p < 0.002 in EXP4, p < 0.004 in EXP5, p < 0.021 in EXP6; n = 12; Figure 7C). Together, these results indicate that OA may play a role in EIBS to the disinhibition effect of ethanol. More importantly, these data sets clearly demonstrate the utility and effectiveness of the Flypub assay in studying ethanol-induced disinhibition and sensitization.
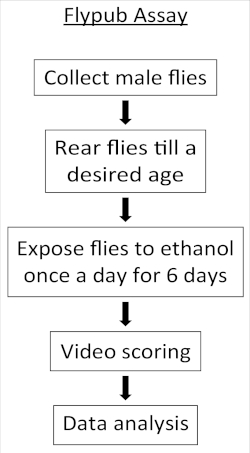
Figure 1: Flypub assay workflow. A workflow diagram highlighting the key steps for conducting the Flypub assay. Please click here to view a larger version of this figure.
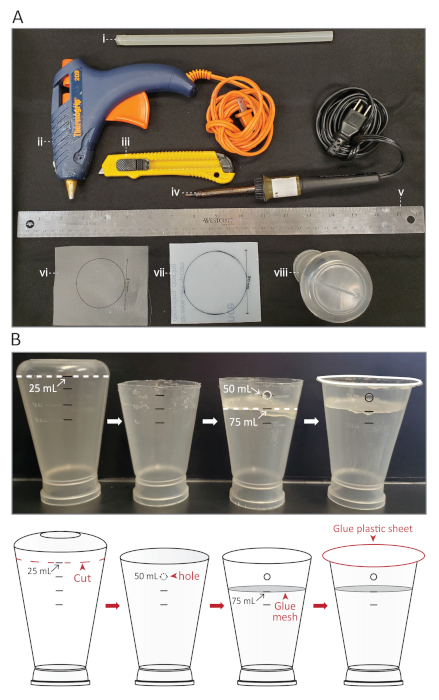
Figure 2: Flypub chamber materials and assembly. (A) Materials required to build a Flypub chamber include (i) hot glue gun glue stick, (ii) hot glue gun, (iii) razor blade, (iv) soldering iron, (v) ruler, (vi) mesh, (vii) polycarbonate plastic sheet, and (viii) round-bottom Drosophila bottle. (B) Schematic representation of the Flypub chamber assembly. Please click here to view a larger version of this figure.
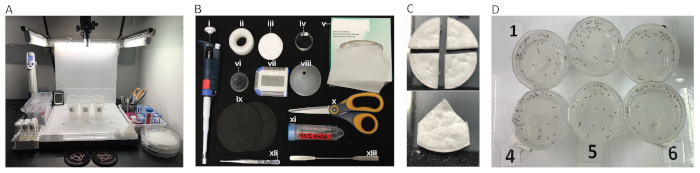
Figure 3: Ethanol exposure. (A) A fully assembled Flypub station. (B) Materials required for ethanol exposure include (i) P1000 micropipette, (ii) tape, (iii) cotton pad, (iv) Petri dish, (v) lab wipes, (vi) small funnel, (vii) timer, (viii) mid-size funnel, (ix) mouse pad, (x) scissors, (xi) 95% ethanol, (xii) forceps and (xiii) spatula. (C) Steps on how to cut cotton pads. (D) Top view image of the pubs aligned on the stage. Please click here to view a larger version of this figure.
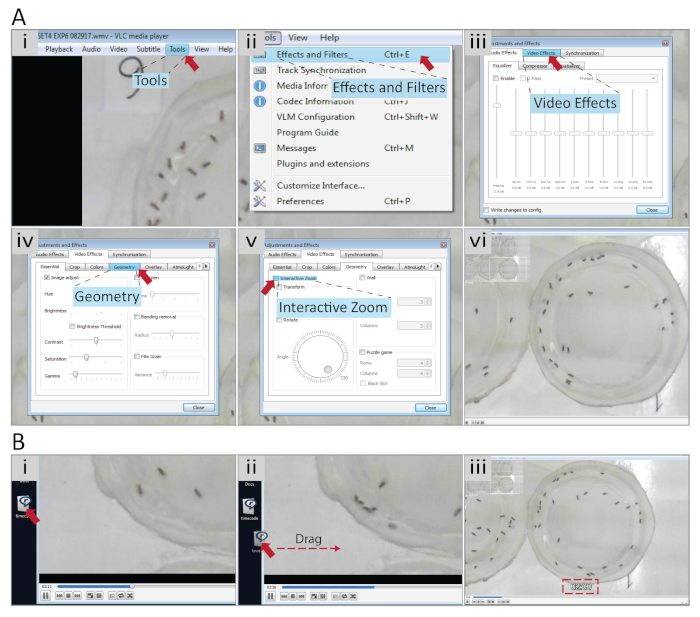
Figure 4: Video setup for behavioral scoring. Shown is the step-by-step guide on (A) how to zoom in on the video and (B) how to insert the timecode file into the VLC media player for behavioral scoring. Please click here to view a larger version of this figure.
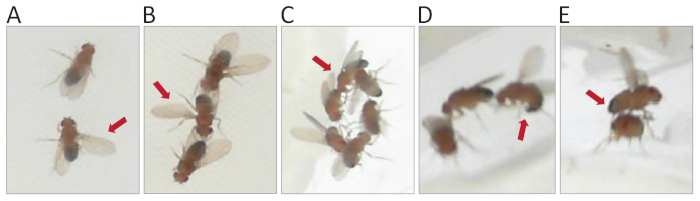
Figure 5: Male courtship behaviors. Representative images illustrate the Drosophila male courtship behaviors including following and unilateral wing extension for (A) courtship song, (B) courtship chain, (C) courtship circle (D) abdominal bending and (E) mounting that are used for behavioral scoring. Please click here to view a larger version of this figure.
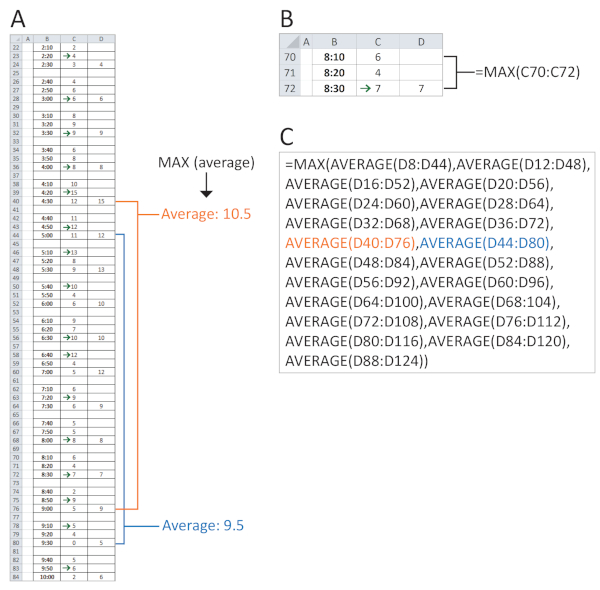
Figure 6: Data input and analysis. (A) The number of males engaged in courtship in every 10 s time block is transcribed into a worksheet. The highest number of courting males of three consecutive 10 s time blocks (green arrow) is used as a representative data point. The average of 10 consecutive data points (blue or orange bracket) having the maximal value represent the percentage of inter-male courtship per pub [orange bracket; MAX (average), black arrow]. (B,C) The worksheet formulas used to calculate the maximal representative data point and the maximal average of 10 consecutive representative data points per pub. Please click here to view a larger version of this figure.
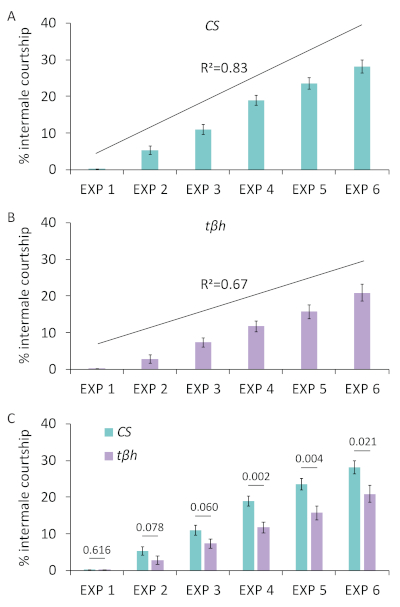
Figure 7: Ethanol induced behavioral disinhibition and sensitization in CS and tβh. (A,B) The CS and tβh males displayed sensitized courtship disinhibition with repeated ethanol exposures (ANOVA GLM, CS: R2=0.83, F(5,66)=65.21, p < 0.0001; tβh: R2=0.67, F(5,66)=27.60, p < 0.0001; n = 12). (C) The tβh males showed less disinhibited courtship compared to CS (n=12). The p values of the post hoc analyses are shown above the line. The intermale courtship activity was analyzed from the videos generated for each ethanol exposure. All data are reported as means ± standard error of the mean. Please click here to view a larger version of this figure.
Supplemental Figure 1: Statistical analysis. The steps in the Minitab 17 software on how to perform the (A) Normality test, (B) stacking the data, (C) General linear model ANOVA test, (D) Two-sample t-test, (E) Mann-Whitney test and (F) Kruskal-Wallis test. Please click here to download this file.
Discussion
In this report, we have described the setup and detailed protocol of the Flypub assay; a novel method to measure how recurring ethanol exposure triggers disinhibited courtship and behavioral sensitization. Although the Flypub assay is relatively straightforward, several steps require care and attention to ensure reliable results. Firstly, the flies for testing must be fully pigmented (i.e., fully developed adult flies), healthy and intact. Deformities or damage especially in their wings or legs can affect the male’s ability to court. Secondly, the fly age is important and must be matched among control and experimental groups (optimal age: 3-5 days old at ethanol exposure 1). Two weeks and older wild-type male flies tend to display the elevated levels of disinhibited courtship31. Thus, proper age-matching of flies under study is essential to avoid variable results. Thirdly, the fly number per pub is vital (optimal: 33 per pub). The lower or higher fly numbers per pub can greatly skew courtship scores (data not shown). Fourthly, the Flypub chambers need to have identical volumes as illustrated in Figure 2B. This ensures that flies receive ethanol vapor synchronously and the elicited behaviors are consistent. Fifthly, clear video recording and precise courtship scoring are essential. This protocol heavily depends on behavioral observations, so meticulous observance to the standardized courtship scoring protocol is fundamental to minimize inconsistent results. Lastly, it is highly recommended that both ethanol exposure and the courtship scoring steps be performed blindly, where an experimenter is unaware of fly genotypes or experimental treatments, thereby preventing experimental bias.
The Flypub assay has multiple advantages. Firstly, multiple groups of flies can be tested and compared simultaneously. Secondly, it is inexpensive, simple to setup and easy to learn, making it highly amenable to experimenters at all levels including elementary through high school, undergraduate and graduate students, postdocs and faculty as well as teaching laboratories with limited space and budgets. Thirdly, it can be utilized to measure additional behaviors such as disinhibited courtship of female flies and the sedative effect of ethanol or other sedatives to assess initial sensitivity and tolerance development and maintenance31,32. Together, the Flypub is a versatile method to study diverse features of AUD.
The major limitation of the Flypub assay is the rigorous and laborious courtship scoring regimen. The courtship behavior under the influence of ethanol is highly dynamic in a manner that the courtship duration ranges from less than one second to many minutes and the flies engaged in courtship are rather frequently changing. The scoring regime presented here was developed to incorporate this dynamic nature and to provide consistent scores on individual ethanol exposures for a given genotype31,32. As noted in the protocol, the courtship activity is manually scored, which is time consuming. Several automated scoring programs have been developed to facilitate unbiased high-throughput behavioral screening and all of which rely on individual flies’ movements and locations39,40,41,42,43,44,45. We also attempted to develop a computer software to automatically count the courtship activity but was unable to obtain consistent and reliable outcomes. This could be due to the fact that behavioral scoring includes multiple courtship steps (i.e., following, unilateral wing extension, abdominal bending and mounting)35,36,46 of multiple flies at once. Even with this limitation, an experimenter with adequate training should be able to quantify the ethanol-induced courtship behaviors with consistency and accuracy. Nonetheless, it would be of great help and importance to adopt machine learning or other advanced algorithms as a follow-up.
Similar to rodent models, the studies on ethanol in the fly model have largely focused on the ethanol’s locomotor stimulating and sedative effects. The Flypub assay however, measures disinhibited courtship, a type of cognitive disinhibition which is novel31,32. Therefore, the Flypub can aid to elucidate the molecular players, cellular pathways and neural circuits as well as the risk factors (e.g., age, sleep, diet or social environment) critical for behavioral disinhibition and sensitization. We have previously demonstrated that dopamine signaling is required for EIBS, which is in line with the findings in rodent models and human subjects6,9,31. Also as a proof of concept, we examined the tβh mutant lacking OA (the invertebrate counterpart of norepinephrine) and found that OA is also important for behavioral sensitization to the ethanol’s disinhibition effect although its contribution is relatively small compared to that of dopamine31. This finding is in contrast to the observation by Scholz47 that the tβh mutant flies exhibit no obvious impairments in sensitization to the ethanol’s locomotor activating effect47. This suggests distinct molecular, cellular and neural pathways mediating behavioral sensitization to the disinhibition versus locomotor activation. Follow-up studies should further collaborate this tantalizing notion.
In summary, the Flypub is a low-cost, multifaceted and effective method to investigate the behavioral responses to ethanol, particularly disinhibition and behavioral sensitization, that may help advance our understanding of AUD and provide insight into effective interventions for this chronic disorder.
Disclosures
The authors have nothing to disclose.
Acknowledgements
This work was supported by the NIAAA 1R15AA020996, NIMH R21MH109953, Brain & Behavior Research Foundation NARSAD, and NIMHD 2G12MD007592 NMD Cluster grants. We are also grateful to the NIH-funded RISE program (NIGMS 5R25GM069621) for supporting NMD and CMS, the UTEP COURI-SURPASS program for supporting NMD, the NIH-funded MARC program (NIGMS 2T34GM008048-31) for supporting AA, and the Dr. Keelung Hong Graduate Fellowship for supporting EBS. We greatly appreciate the UTEP communications department: Darlene Barajas, Christian Rivera, Karina Moreno, Jose Loya Fernandez and the Music department: Stephen A. Haddad for their help in the video and voice-over production. Lastly, we are very thankful to Dr. Andreas Thum for sharing the tβh mutant in the Canton-S background along with the control Canton-S flies; and Jessica Burciaga for her valuable contribution to the initial studies on octopamine and the Han lab members for discussion and support.
Materials
| Name | Company | Catalog Number | Comments |
|---|---|---|---|
| 95 % Ethanol | VWR Chemicals | BDH1158-4LP | |
| Canton-S | - | - | wild-type strain used as a control |
| Copy stand with arms | Kaiser | 205411 | model RS 2-XA, with one central arm and two lateral arms; to set up a flypub station |
| Cotton rounds | Swisspers | COT-027 | to deliver ethanol |
| Excel | Microsoft | - | to analyze data; any worksheet or spreadsheet software can be used |
| Fluorescent light bulb | Lights of America | 7108N | maximum (120 V-70 W Max.); to illuminate the flypub station |
| Microsoft LifeCam software | Microsoft | - | version 3.60; to videotape flypubs |
| Microsoft LifeCam Studio | Microsoft | Q2F-00013 | 1080P HD sensor; to videotape flypubs |
| Minitab 17 | Minitab | - | version 17; to conduct statistical analysis; any statistical analysis software can be used |
| Nylon mesh sheet | Sefar Nitex | - | model B0043D1TVY, opaque white, 200 microns mesh; to make a flypub |
| Petri dishes | Falcon | 08-757-100A | 35 x 10 mm; to deliever ethanol |
| Plastic funnel - mid size | Fisher scientific | 10-348A | 65 mm diameter and 67 mm height; to transfer sedated flies from a flypub into a food vial |
| Plastic funnel - small | Fisher scientific | 07-202-121 | 4 mm diameter and 46 mm height; to transfer flies from a vial into a flypub |
| Polycarbonate sheet | Lexan | - | 0.762 mm thickness, clear, 610 x 1220 mm Nominal; to make a flypub |
| Round-bottom bottle | Fisher scientific | AS115 | polypropylene, 103 mm height, 60 mm diameter and 177 ml capacity; to make a flypub |
| Soldering iron | Weller | WES51 | to make a hole in a flypub |
| Time code | - | - | .smi file, a subtitle ticking timecode created in Han lab; to monitor time during courtship scoring; any time subtitles may be used |
| Tyramine β hydroxylase (tβh) | - | - | mutant fly strain (nM18 null allele)deficient in tβh in the wild-type Canton-S background ; obtained from Dr. Andreas Thum (University of Leipzig, Leipzeig, Germany) |
| VLC media player | VideoLAN | - | version 3.0.8; any media player can be used to score courtship |
References
- Scholz, H. Unraveling the Mechanisms of Behaviors Associated With AUDs Using Flies and Worms. Alcoholism: Clinical and Experimental Research. 43 (11), 2274-2284 (2010).
- Devineni, A. V., Heberlein, U. The evolution of Drosophila melanogaster as a model for alcohol research. Annual Review of Neuroscience. 36, 121-138 (2013).
- Park, A., Ghezzi, A., Wijesekera, T. P., Atkinson, N. S. Genetics and genomics of alcohol responses in Drosophila. Neuropharmacology. 122, 22-35 (2017).
- Kippin, T. E. Adaptations underlying the development of excessive alcohol intake in selectively bred mice. Alcoholism: Clinical Experimental Research. 38 (1), 36-39 (2014).
- Bell, R. L., et al. Rat animal models for screening medications to treat alcohol use disorders. Neuropharmacology. 122, 201-243 (2017).
- Nona, C. N., Hendershot, C. S., Le, A. D. Behavioural sensitization to alcohol: Bridging the gap between preclinical research and human models. Pharmacology Biochemistry and Behavior. 173, 15-26 (2018).
- Robinson, T. E., Berridge, K. C. The neural basis of drug craving: an incentive-sensitization theory of addiction. Brain Research Reviews. 18 (3), 247-291 (1993).
- Masur, J., Boerngen, R. The excitatory component of ethanol in mice: a chronic study. Pharmacology Biochemistry and Behavior. 13 (6), 777-780 (1980).
- Camarini, R., Pautassi, R. M. Behavioral sensitization to ethanol: Neural basis and factors that influence its acquisition and expression. Brain Research Bulletin. 125, 53-78 (2016).
- Shuster, L., Yu, G., Bates, A. Sensitization to cocaine stimulation in mice. Psychopharmacology (Berl). 52 (2), 185-191 (1977).
- Short, P. H., Shuster, L. Changes in brain norepinephrine associated with sensitization to d-amphetamine. Psychopharmacology (Berl). 48 (1), 59-67 (1976).
- Vanderschuren, L. J., Pierce, R. C. Sensitization processes in drug addiction. Current Topics in Behavioral Neurosciences. 3, 179-195 (2010).
- Kong, E. C., et al. A pair of dopamine neurons target the D1-like dopamine receptor DopR in the central complex to promote ethanol-stimulated locomotion in Drosophila. Plos One. 5 (4), 9954(2010).
- Broadbent, J., Harless, W. E. Differential effects of GABA(A) and GABA(B) agonists on sensitization to the locomotor stimulant effects of ethanol in DBA/2 J mice. Psychopharmacology (Berl). 141 (2), 197-205 (1999).
- Camarini, R., Andreatini, R., Monteiro, M. G. Prolonged treatment with carbamazepine increases the stimulatory effects of ethanol in mice. Alcohol. 12 (4), 305-308 (1995).
- Camarini, R., Hodge, C. W. Ethanol preexposure increases ethanol self-administration in C57BL/6J and DBA/2J mice. Pharmacology Biochemistry and Behavior. 79 (4), 623-632 (2004).
- Hoshaw, B. A., Lewis, M. J. Behavioral sensitization to ethanol in rats: evidence from the Sprague-Dawley strain. Pharmacology Biochemistry and Behavior. 68 (4), 685-690 (2001).
- Kawakami, S. E., Quadros, I. M., Takahashi, S., Suchecki, D. Long maternal separation accelerates behavioural sensitization to ethanol in female, but not in male mice. Behavioural Brain Research. 184 (2), 109-116 (2007).
- Lessov, C. N., Phillips, T. J. Duration of sensitization to the locomotor stimulant effects of ethanol in mice. Psychopharmacology (Berl). 135 (4), 374-382 (1998).
- Melon, L. C., Boehm, S. L. Role of genotype in the development of locomotor sensitization to alcohol in adult and adolescent mice: comparison of the DBA/2J and C57BL/6J inbred mouse strains. Alcoholism: Clinical and Experimental Research. 35 (7), 1351-1360 (2011).
- Pastor, R., Aragon, C. M. The role of opioid receptor subtypes in the development of behavioral sensitization to ethanol. Neuropsychopharmacology. 31 (7), 1489-1499 (2006).
- Scholz, H., Ramond, J., Singh, C. M., Heberlein, U. Functional ethanol tolerance in Drosophila. Neuron. 28 (1), 261-271 (2000).
- Cofresi, R. U., Bartholow, B. D., Piasecki, T. M. Evidence for incentive salience sensitization as a pathway to alcohol use disorder. Neuroscience & Biobehavrioal Reviews. 107, 897-926 (2019).
- Topper, S. M., Aguilar, S. C., Topper, V. Y., Elbel, E., Pierce-Shimomura, J. T. Alcohol disinhibition of behaviors in C. elegans. Plos One. (93), 92965(2014).
- Stoner, S. A., George, W. H., Peters, L. M., Norris, J. Liquid courage: alcohol fosters risky sexual decision-making in individuals with sexual fears. AIDS and Behavior. 11 (2), 227-237 (2007).
- Marinkovic, K., Halgren, E., Klopp, J., Maltzman, I. Alcohol effects on movement-related potentials: a measure of impulsivity. Journal of Studies on Alcohol and Drugs. 61 (1), 24-31 (2000).
- Prause, N., Staley, C., Finn, P. The effects of acute ethanol consumption on sexual response and sexual risk-taking intent. Archives of Sexual Behavior. 40 (2), 373-384 (2011).
- Miczek, K. A., DeBold, J. F., Hwa, L. S., Newman, E. L., de Almeida, R. M. Alcohol and violence: neuropeptidergic modulation of monoamine systems. Annals of the New York Academy of Sciences. 1349, 96-118 (2015).
- Heinz, A. J., Beck, A., Meyer-Lindenberg, A., Sterzer, P., Heinz, A. Cognitive and neurobiological mechanisms of alcohol-related aggression. Nature Reviews Neuroscience. 12 (7), 400-413 (2011).
- Schwandt, M. L., Higley, J. D., Suomi, S. J., Heilig, M., Barr, C. S. Rapid tolerance and locomotor sensitization in ethanol-naive adolescent rhesus macaques. Alcoholism: Clinical and Experimental Research. 32 (7), 1217-1228 (2008).
- Lee, H. G., Kim, Y. C., Dunning, J. S., Han, K. A. Recurring ethanol exposure induces disinhibited courtship in Drosophila. Plos One. 3 (1), 1391(2008).
- Aranda, G. P., Hinojos, S. J., Sabandal, P. R., Evans, P. D., Han, K. A. Behavioral Sensitization to the Disinhibition Effect of Ethanol Requires the Dopamine/Ecdysone Receptor in Drosophila. Frontiers in Systems Neuroscience. 11, 56(2017).
- Roeder, T. Octopamine in invertebrates. Progress in Neurobiology. 59 (5), 533-561 (1999).
- Gallo, V. P., Accordi, F., Chimenti, C., Civinini, A., Crivellato, E. Catecholaminergic System of Invertebrates: Comparative and Evolutionary Aspects in Comparison With the Octopaminergic System. International Review of Cell Molecular Biology. 322, 363-394 (2016).
- Curcillo, P. G., Tompkins, L. The ontogeny of sex appeal in Drosophila melanogaster males. Behavior Genetics. 17 (1), 81-86 (1987).
- Spieth, H. T. Courtship behavior in Drosophila. Annual Review of Entomology. 19, 385-405 (1974).
- Monastirioti, M., Linn, C. E., White, K. Characterization of Drosophila tyramine beta-hydroxylase gene and isolation of mutant flies lacking octopamine. Journal of Neuroscience. 16 (12), 3900-3911 (1996).
- Certel, S. J., Savella, M. G., Schlegel, D. C., Kravitz, E. A. Modulation of Drosophila male behavioral choice. Proceedings of the National Academy Sciences of the United States of America. 104 (11), 4706-4711 (2007).
- Kido, A., Ito, K. Mushroom bodies are not required for courtship behavior by normal and sexually mosaic Drosophila. Journal of Neurobiology. 52 (4), 302-311 (2002).
- Winbush, A., et al. Identification of gene expression changes associated with long-term memory of courtship rejection in Drosophila males. G3: Genes, Genomes, Genetics (Bethesda). 2 (11), 1437-1445 (2012).
- Keleman, K., Kruttner, S., Alenius, M., Dickson, B. J. Function of the Drosophila CPEB protein Orb2 in long-term courtship memory. Nature Neuroscience. 10 (12), 1587-1593 (2007).
- Dankert, H., Wang, L., Hoopfer, E. D., Anderson, D. J., Perona, P. Automated monitoring and analysis of social behavior in Drosophila. Nature Methods. 6 (4), 297-303 (2009).
- Branson, K., Robie, A. A., Bender, J., Perona, P., Dickinson, M. H. High-throughput ethomics in large groups of Drosophila. Nature Methods. 6 (6), 451-457 (2009).
- Reza, M. A., et al. Automated analysis of courtship suppression learning and memory in Drosophila melanogaster. Fly (Austin). 7 (2), 105-111 (2013).
- Schneider, J., Levine, J. D. Automated identification of social interaction criteria in Drosophila melanogaster. Biology Letters. 10 (10), 20140749(2014).
- Greenspan, R. J., Ferveur, J. F. Courtship in Drosophila. Annual Reviews of Genetics. 34, 205-232 (2000).
- Scholz, H. Influence of the biogenic amine tyramine on ethanol-induced behaviors in Drosophila. Journal of Neurobiology. 63 (3), 199-214 (2005).
Reprints and Permissions
