Fast photochemical oxidation of proteins is an emerging technique for the structural characterization of proteins. Different solvent additives and ligands have varied hydroxyl radical scavenging properties. To compare the protein structure in different conditions, real-time compensation of hydroxyl radicals generated in the reaction is required to normalize reaction conditions.
Method Article
Enabling Real-Time Compensation in Fast Photochemical Oxidations of Proteins for the Determination of Protein Topography Changes
In This Article
Summary
Abstract
Fast photochemical oxidation of proteins (FPOP) is a mass spectrometry-based structural biology technique that probes the solvent-accessible surface area of proteins. This technique relies on the reaction of amino acid side chains with hydroxyl radicals freely diffusing in solution. FPOP generates these radicals in situ by laser photolysis of hydrogen peroxide, creating a burst of hydroxyl radicals that is depleted on the order of a microsecond. When these hydroxyl radicals react with a solvent-accessible amino acid side chain, the reaction products exhibit a mass shift that can be measured and quantified by mass spectrometry. Since the rate of reaction of an amino acid depends in part on the average solvent accessible surface of that amino acid, measured changes in the amount of oxidation of a given region of a protein can be directly correlated to changes in the solvent accessibility of that region between different conformations (e.g., ligand-bound versus ligand-free, monomer vs. aggregate, etc.) FPOP has been applied in a number of problems in biology, including protein-protein interactions, protein conformational changes, and protein-ligand binding. As the available concentration of hydroxyl radicals varies based on many experimental conditions in the FPOP experiment, it is important to monitor the effective radical dose to which the protein analyte is exposed. This monitoring is efficiently achieved by incorporating an inline dosimeter to measure the signal from the FPOP reaction, with laser fluence adjusted in real-time to achieve the desired amount of oxidation. With this compensation, changes in protein topography reflecting conformational changes, ligand-binding surfaces, and/or protein-protein interaction interfaces can be determined in heterogeneous samples using relatively low sample amounts.
Introduction
Fast photochemical oxidation of proteins (FPOP) is an emerging technique for the determination of protein topographical changes by ultra-fast covalent modification of the solvent-exposed surface area of proteins followed by detection by LC-MS1. FPOP generates a high concentration of hydroxyl radicals in situ by UV laser flash photolysis of hydrogen peroxide. These hydroxyl radicals are very reactive and short lived, consumed on roughly a microsecond timescale under FPOP conditions2. These hydroxyl radicals diffuse through water and oxidize various organic components in solution at kinetic rates generally ranging from fast (~106 M-1 s-1) to diffusion-controlled3. When the hydroxyl radical encounters a protein surface, the radical will oxidize the amino acid side chains on the protein surface, resulting in a mass shift of that amino acid (most commonly the net addition of one oxygen atom)4. The rate of the oxidation reaction at any amino acid depends on two factors: the inherent reactivity of that amino acid (which depends on the side chain and the sequence context)4,5 and the accessibility of that side chain to the diffusing hydroxyl radical, which closely correlates to the average solvent accessible surface area6,7. All of the standard amino acids except glycine have been observed as labeled by these highly reactive hydroxyl radicals in FPOP experiments, albeit at widely differing yields; in practice, Ser, Thr, Asn, and Ala are rarely seen as oxidized in most samples except under high radical doses and identified by careful and sensitive targeted ETD fragmentation8,9. After oxidation, samples are quenched to remove hydrogen peroxide and secondary oxidants (superoxide, singlet oxygen, peptidyl hydroperoxides, etc.) The quenched samples are then proteolytically digested to generate mixtures of oxidized peptides, where the structural information is frozen as a chemical “snapshot” in the patterns of oxidation products of the various peptides (Figure 1). Liquid chromatography coupled to mass spectrometry (LC-MS) is used to measure the amount of oxidation of amino acids in a given proteolytic peptide based on the relative intensities of the oxidized and unoxidized versions of that peptide. By comparing this oxidative footprint of the same protein obtained under different conformational conditions (e.g., ligand-bound versus ligand-free), differences in the amount of oxidation of a given region of the protein can be directly correlated with differences in the solvent-accessible surface area of that region6,7. The ability to provide protein topographical information makes FPOP an attractive technology for the higher-order structure determination of proteins, including in protein therapeutic discovery and development10,11.
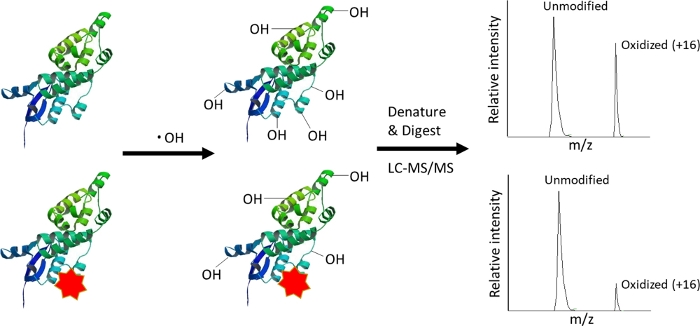
Figure 1: Overview of FPOP. The surface of the protein is covalently modified by highly reactive hydroxyl radicals. The hydroxyl radicals will react with amino acid side chains of the protein at a rate that is strongly influenced by the solvent accessibility of the side chain. Topographical changes (for example, due to the binding of a ligand as shown above) will protect amino acids in the region of interaction from reacting with hydroxyl radicals, resulting in a decrease in the intensity of modified peptide in the LC-MS signal. Please click here to view a larger version of this figure.
Different constituents present in the FPOP solution (e.g., ligands, excipients, buffers) have different scavenging activity towards the hydroxyl radicals generated upon the laser photolysis of hydrogen peroxide3. Similarly, a small change in peroxide concentration, laser fluence, and buffer composition may change the effective radical dose, making the reproduction of FPOP data challenging across the samples and between different labs. Therefore, it is important to be able to compare the hydroxyl radical dose available to react with protein in each sample using one of several available hydroxyl radical dosimeters12,13,14,15,16. Hydroxyl radical dosimeters act by competing with the analyte (and with all scavengers in solution) for the pool of hydroxyl radicals; the effective dose of hydroxyl radicals is measured by measuring the amount of oxidation of the dosimeter. Note that “effective hydroxyl radical dose” is a function of both the initial concentration of hydroxyl radical generated and the half-life of the radical. These two parameters are partially dependent on one another, making the theoretical kinetic modeling somewhat complex (Figure 2). Two samples could have wildly different initial radical half-lives while still maintaining the same effective radical dose by changing the initial concentration of hydroxyl radical formed; they will still generate identical footprints17. Adenine13 and Tris12 are convenient hydroxyl radical dosimeters because their level of oxidation can be measured by UV spectroscopy in real-time, allowing for researchers to quickly identify when there is a problem with effective hydroxyl radical dose and to troubleshoot their problem. To solve this issue, an inline dosimeter located in the flow system directly after the site of irradiation that can monitor the signal from adenine absorbance changes in real-time is important. This helps in carrying out FPOP experiments in buffers or any other excipient with widely differing levels of hydroxyl radical scavenging capacity17. This radical dosage compensation can be performed in real-time, yielding statistically indistinguishable results for the same conformer by adjusting the effective radical dose.
In this protocol, we have detailed procedures for performing a typical FPOP experiment with radical dosage compensation using adenine as an internal optical radical dosimeter. This method allows investigators to compare footprints across FPOP conditions that have different scavenging capacity by performing compensation in real-time.
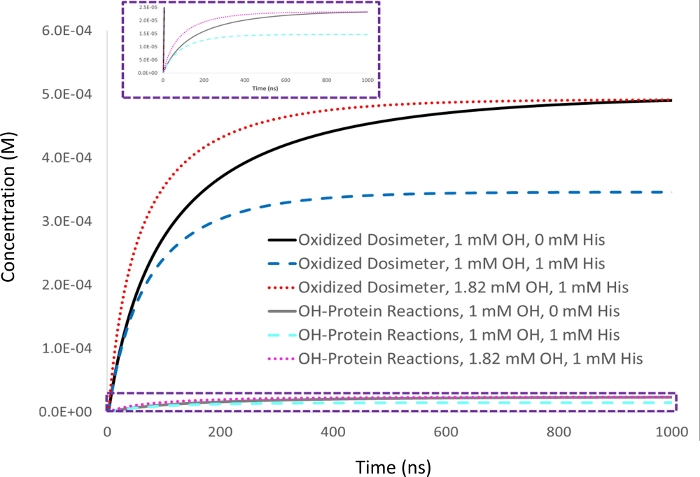
Figure 2: Kinetic simulation of dosimetry-based compensation. 1 mM adenine dosimeter response is measured in 5 µM lysozyme analyte with a 1 mM initial hydroxyl radical concentration (▪OH t1/2=53 ns), and set as a target dosimeter response (black). Upon the addition of 1 mM of the scavenger excipient histidine, the dosimeter response (blue) decreases along with the amount of protein oxidation in a proportional manner (cyan). The half-life of the hydroxyl radical also decreases (▪OH t1/2=39 ns). When the amount of hydroxyl radical generated is increased to give an equivalent yield of oxidized dosimeter in the sample with 1 mM histidine scavenger as achieved with 1 mM hydroxyl radical in the absence of scavenger (red), the amount of protein oxidation that occurs similarly becomes identical (magenta), while the hydroxyl radical half-life decreases even further (▪OH t1/2=29 ns). Adapted with permission from Sharp J.S., Am Pharmaceut Rev 22, 50-55, 2019. Please click here to view a larger version of this figure.
Access restricted. Please log in or start a trial to view this content.
Protocol
1. Prepare the Optical Bench and the Capillary for FPOP
CAUTION: KrF excimer lasers are extreme eye hazards, and direct or reflected light can cause permanent eye damage. Always wear appropriate eye protection, avoid the presence of any reflective objects near the beam path when possible, and use engineering controls to prevent unauthorized access to an active laser and to restrain any stray reflections.
- Prepare the FPOP optical bench.
- Turn on the laser to warm up. Set the laser to External Trigger, Constant Energy, No Gas Replacement. Set the laser energy per pulse (typically between 80-120 mJ/pulse).
- Set up the optical bench with the plano-convex lens (30 mm Dia. x 120 mm FL uncoated) directly in the path of the laser beam and a non-reflective backstop to absorb the light as shown in Figure 3A.
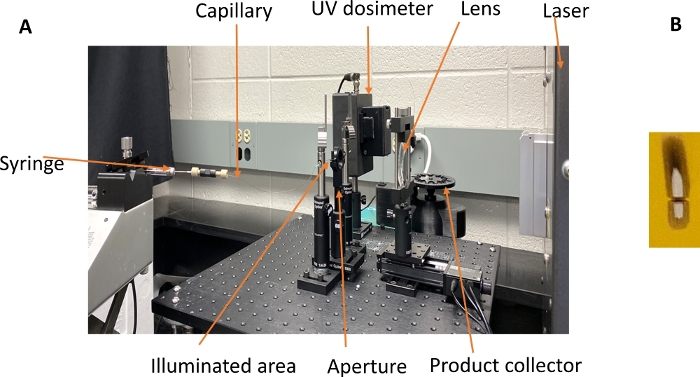
Figure 3: Optical bench for the FPOP experiment. (A) The sample is mixed with H2O2, adenine radical dosimeter, and glutamine scavenger and loaded into the syringe. The sample is pushed through the fused silica capillary through the focused beam path of a KrF excimer UV laser. The UV light photolyzes H2O2 into hydroxyl radicals, which oxidizes the protein and adenine dosimeter. The syringe flow pushes the illuminated sample out of the path of the laser before the next laser pulse, with an unilluminated exclusion volume between illuminated regions. Immediately after oxidation, the sample is passed through an inline UV spectrophotometer, which measures the UV absorbance of adenine at 265 nm. The sample is then deposited into a quench buffer to eliminate the remaining H2O2 and secondary oxidants. (B) The spot size is measured after irradiating a colored sticky note affixed behind the capillary with the laser at 248 nm. The width of the spot is used for calculating the sample flow rate, and the silhouette of the capillary in the center of the spot is used to align the optical bench. Please click here to view a larger version of this figure.
- Cut an appropriate length of the fused silica capillary (360 µm outer diameter and 100 µm inner diameter) and using a sleeve, connect to the gas-tight syringe using a low dead volume connector.
- Gently burn the polyimide coating of the capillary with a butane torch at the place where the inline dosimeter reads the absorbance signal at 265 nm after laser exposure of the samples. Wipe the debris on the capillary gently using methanol on a lint-free wipe. The polyimide coating at the site of laser incidence can either be similarly burned off with the butane torch or burned off with the excimer laser firing at low power.
NOTE: Wait for the capillary to cool as it is a fire hazard to use the methanol on the hot capillary. - Place this capillary through the beam path of the laser and into the inline dosimeter.
- Press the lever on the top of the inline dosimeter to open the hinge. Remove the magnetic holders. Place the capillary in the machined groove of the inline dosimeter, using the magnetic holders to keep the capillary in place. Close the dosimeter hinge over the capillary, pressing it until the lever locks in place.
- Using the dosimetry software, click on the Start Flash button to begin firing the excimer laser. Set the preset laser power between 50-100 mJ/pulse on the laser control software itself, and set the preset repetition rate between 10-20 Hz in the Settings tab of the dosimetry software.
- Focus the laser beam using a plano convex lens mounted on a linear motorized stage. Measure the width and the height of the laser spot at the position of the capillary on a sticky note precisely using a caliper to calculate incident fluence (mJ/mm2) as shown in Figure 3B.
- Place an opaque aperture near the capillary to ensure consistent illuminated width of the capillary regardless of changes in the beam size due to movement of the lens or changing the energy per pulse of the laser18.
- With the laser firing, move the motorized stage through its range of motion. Ensure that the beam stays centered on the aperture and the silhouette of the capillary can be observed throughout. The diameter of the aperture must be smaller than the width of the impinging focused beam at every point in the range of the motorized stage.
- Run water through the capillary at 20 µL/min for at least one minute to wash the capillary.
- Click the Start Data + AutoZero button on the dosimeter software to zero the dosimeter to water and begin data collection.
NOTE: If the buffer system for FPOP has significant UV absorbance at 265 nm, the FPOP system should be zeroed on the buffer, not water.
- Click the Start Data + AutoZero button on the dosimeter software to zero the dosimeter to water and begin data collection.
- Set the calculated flow rate on the syringe pump.
- The flow rate of the protein sample depends on the irradiated volume per shot (VIrr), the number of laser shots per second (R), and the desired unirradiated exclusion volume fraction (FEx) to correct for laminar flow effects and sample diffusion (0.15-0.30 recommended)2,19,20. Calculate the VIrr (in µL) based on the inner diameter of the capillary in mm (d) and the width of the laser spot impinging upon the capillary (i.e., the width of the aperture) in mm (w) using the following equation:
VIrr = π(d/2)2w - Calculate the desired flow rate (in µL/min) based on the following equation:
Flow = 60R[VIrr (1 + FEx)]
- The flow rate of the protein sample depends on the irradiated volume per shot (VIrr), the number of laser shots per second (R), and the desired unirradiated exclusion volume fraction (FEx) to correct for laminar flow effects and sample diffusion (0.15-0.30 recommended)2,19,20. Calculate the VIrr (in µL) based on the inner diameter of the capillary in mm (d) and the width of the laser spot impinging upon the capillary (i.e., the width of the aperture) in mm (w) using the following equation:
2. Preparation of the protein solution for FPOP
- Prepare the protein in the two or more different conditions to be compared (e.g., ligand-bound and ligand-free; aggregate and monomer; alone and with a protein-protein binding partner; etc.) for detecting the conformation changes.
- Set the total volume used for FPOP to fit the needs of the experiment. The minimum limit usually depends on the volume of the irradiation capillary and the material required for robust detection and relative quantification, and will vary depending largely on the LC-MS/MS system used and the post-labeling sample processing method. The total volume for FPOP solutions commonly used in our group is 20 µL after the addition of hydrogen peroxide. The final concentration of the protein is commonly 1-10 µM, with 17 mM glutamine (to limit the lifetime of the hydroxyl radical), 1 mM adenine (to act as a radical dosimeter)13,17 and 10 mM phosphate buffer (a buffer that is a poor scavenger of hydroxyl radicals). Samples are generally prepared with multiple replicates to allow for statistical modeling of results.
- For most general purposes, prepare samples in triplicate in both states, plus at least one sample to use as a no-laser control to measure background oxidation. Prepare 18 µL of this FPOP solution mix.
NOTE: Many buffers and additives commonly used in biochemistry are hydroxyl radical scavengers. These additives and buffers can be used; however, reductions in oxidation due to hydroxyl radical scavenging of the buffer can occur. In general, keep all additives to the minimum required by the biological system to maximize protein oxidation yield. Dimethyl sulfoxide should be avoided due to the propensity to generate secondary radicals; dimethylformamide has been a useful alternative in our hands. When using buffers that are strong hydroxyl radical scavengers, glutamine can often be excluded from the FPOP solution mix.
- For most general purposes, prepare samples in triplicate in both states, plus at least one sample to use as a no-laser control to measure background oxidation. Prepare 18 µL of this FPOP solution mix.
- Prepare 1 M hydrogen peroxide immediately before the FPOP experiment.
NOTE: 30% hydrogen peroxide as commonly sold by vendors includes a stabilizer, which increases the shelf life. Once diluted, hydrogen peroxide should be used quickly, definitely within the same day. Hydrogen peroxide should also be regularly tested for decomposition by FPOP using a hydroxyl radical dosimeter. - Prepare microcentrifuge tubes containing 25 µL of quench solution of 0.5 µg/µL of methionine amide and 0.5 µg/µL catalase. If a sample volume greater than 20 µL is used for FPOP, increase the quench solution volume proportionally.
3. Perform the FPOP experiment
- Add 2 µL of hydrogen peroxide in the 18 µL of the FPOP solution mix. Mix the contents gently with a pipette and quickly spin down the solution to the bottom of the microcentrifuge tubes. Immediately collect with a gastight syringe and load into the syringe pump.
- Start the flow on the syringe pump with the flow rate as determined in step 1.8.1 (typically between 8-16 µL/min) by clicking the Start Pump button on the dosimeter software.
- Monitor the real-time adenine reading using the inline dosimeter (see Table of Materials) and collect the sample in waste. Wait for the Abs265 signal to stabilize.
- Click on the Start Flash button in the dosimeter software to start firing the laser at the preset repetition rate and energy.
- Monitor the real-time adenine reading using an inline dosimeter (see Table of Materials); the difference in Abs265 with the laser off and the laser on is the ΔAbs265 reading.
NOTE: The appearance of highly unstable Abs265 readings upon firing the laser in the presence of hydrogen peroxide is due to the generation of bubbles in solution. Reduce the fluence of the laser and/or the concentration of hydrogen peroxide to eliminate the bubbles.
4. Perform Compensation
NOTE: Different ligands, buffers, etc. may have different scavenging capacity towards hydroxyl radicals. It is important to ensure that comparable effective hydroxyl radical doses are available to react with protein across different samples. This is accomplished by ensuring equal hydroxyl radical dosimeter response between samples. Using adenine dosimetry, the change in UV absorbance at 265 nm (ΔAbs265) reflects the effective hydroxyl radical dose; the larger the ΔAbs265, the higher the effective hydroxyl radical dose.
- Compare the ΔAbs265 reading obtained with the inline dosimeter with the desired ΔAbs265 reading obtained by prior experiments or controls. A ΔAbs265 reading lower than the desired reading indicates an insufficient effective dose of hydroxyl radicals; a ΔAbs265 reading indicates an effective radical dose that is too high. If the ΔAbs265 reading is at the desired level, collect the sample immediately after laser irradiation in the quench buffer17.
- Compensate the effective radical dose to equalize the ΔAbs265. This compensation can be performed in three ways: change hydrogen peroxide concentration, increase laser fluence by changing the laser energy per pulse, or increase laser fluence by changing the focal plane of the focusing lens.
- To make a large change (>10 mAU) in ΔAbs265 reading, remake the sample with more or less hydrogen peroxide and rerun the sample as per Section 3.
- To make a small change in ΔAbs265 reading in real-time, adjust the focal plane of the incident beam by adjusting the position of the focusing lens using the 50 mm Motorized Stage. Bringing the focal plane closer to the position of the capillary will increase the ΔAbs265 reading; bringing the focal plane farther from the position of the capillary will decrease the ΔAbs265 reading.
- Monitor the adenine ΔAbs265 to measure the effective amount of hydroxyl radical present in the sample after laser irradiation13. Real-time monitoring with an inline UV capillary detector allows for real-time compensation as described in 4.2.2; adjust the lens position using the motorized stage until the ΔAbs265 reading is equal to the desired reading. Post-experimental absorbance measurements with a UV spectrophotometer are also accurate, but require new samples to be used for each effective radical dose.
5. Digest the protein samples
NOTE: Trypsin is most commonly used to digest protein samples for FPOP, and is the protease used in this protocol. It is a reliable protease that generates peptides with basic sites both at the N- and C-terminus, promoting multiply charged peptide ions in MS. Moreover, it cleaves after lysine and arginine, two amino acids that are only moderately reactive to hydroxyl radicals; therefore, changes in the digestion pattern due to analyte oxidation is rare. Other proteases have been successfully used with FPOP21, but care should be taken to ensure digestion patterns are comparable between unoxidized and oxidized samples.
- Measure the final volume of quenched FPOP sample. Add 500 mM Tris, pH 8.0 with 10 mM CaCl2 containing 50 mM dithiothreitol (DTT) to the protein solution after quenching to a final concentration of 50 mM Tris, 1 mM CaCl2 and 5 mM DTT.
- Heat the protein sample at 95 °C for 15 minutes.
- Immediately cool the sample on ice for 2 min.
- Add the 1:20 trypsin/protein weight ratio to the samples.
- Digest the protein overnight at 37 °C with mixing.
- Stop the digestion reaction by the addition of 0.1% formic acid and/or heating the sample to 95 °C for 10 min.
- Add 2 mM DTT to the samples and heat at 60 °C for 15 min immediately before LC-MS/MS.
NOTE: While other groups have reported alkylation of thiols in FPOP experiments, in our hands we have noted side products upon alkylation of oxidized proteins (possibly due to reaction with nucleophilic carbonyls formed as a minor oxidation product). Therefore, we choose to avoid alkylation of thiols when possible.
6. Perform liquid chromatography-tandem mass spectrometry (LC-MS/MS)
- Prepare the mobile phase A consisting of water containing 0.1% formic acid and mobile phase B consisting of acetonitrile with 0.1% formic acid.
- Load the sample first onto a C18 trap column (300 µm I.D. x 5 mm 100 Å pore size, 5 µm particle size) trapping cartridge and wash with 2% solvent B for 3 minutes at a flow rate of 5.0 µL/min to remove salts and hydrophilic small molecules.
- Then separate the peptides on C18 nanocolumn (0.75 mm x 150 mm, 2 µm particle size, 100 Å pore size) at a flow rate of 300 nL/min. The gradient consists of a linear increase from 2 to 35% solvent B over 22 min, ramped to 95% solvent B over 5 min and held for 3 min to wash the column, and then returned to 2% B over 3 min and held for 9 min to re-equilibrate the column.
NOTE: This gradient is sufficient for LC-MS/MS of most one- and two-protein FPOP mixtures seeking to do peptide-level quantification. The percent of solvent B may need to be altered to increase peptide resolution in rare cases where peptides interfere with one another due to similar retention times and m/z values. Proteome-scale FPOP22 or experimental designs seeking to separate peptide oxidation product isomers1,23,24,25 may require longer LC gradients and are beyond the scope of this report. - Elute the peptides directly into the nanospray source of a high-resolution mass spectrometer using a conductive nanospray emitter.
- Acquire the data in positive ion mode. Set the spray voltage to 2400 V, and the temperature of the ion transfer tube to 300 °C.
- Acquire the full MS scans from m/z 250 to 2000 at a nominal resolution at m/z 200 of 60,000 followed by eight subsequent data-dependent linear ion trap MS/MS scans on the top eight most abundant peptide ions using collision-induced dissociation at 35% normalized energy to identify the peptides. Fragment the peptides up to five times within 30 s and then transfer to an exclusion list for 60 s.
7. Data processing and calculation of average oxidation of peptides
- Determine the sequence coverage of the protein, m/z values, and retention times of unoxidized peptides using the MS/MS proteomics search engine.
- Set the precursor mass tolerance to 10 ppm and allow up to two missed cleavage sites for the trypsin digested samples, using standard trypsin cleavage specificity.
- Set the peptide mass fragment mass tolerance to 0.4 Daltons.
- Based on the m/z ratio of the unmodified peptides detected and the known mass shifts of the major oxidation products, calculate the m/z of the various theoretical oxidation products of each peptide4,26,27,28,29.
- Identify the extracted ion chromatogram of these m/z values using software to view the mass spectrometric run (Figure 4). Identify the peptide oxidation products based on their m/z, their charge state, and the similarity in elution time to the unmodified peptide. In our hands, peptide oxidation products elute between 240 seconds before to 180 seconds after the unmodified peptide using the LC gradient above. As oxidation will often result in multiple isomeric oxidation products, it is common to observe multiple partially resolved peaks in the extracted ion chromatograms of peptide oxidation products, as shown in Figure 4. Peptide oxidation products are quantified based on the area of the peak(s) in the extracted ion chromatograms.
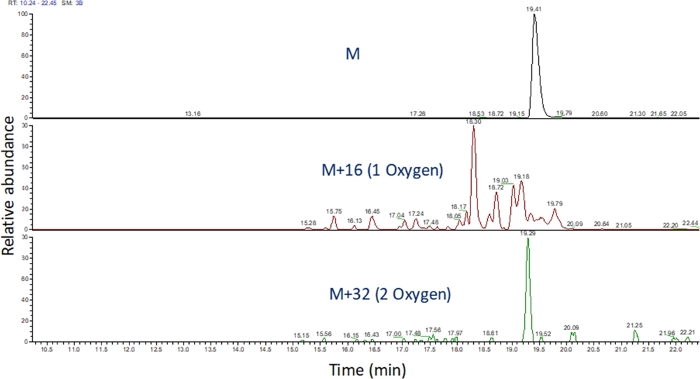
Figure 4: Extracted ion chromatogram of a peptide and its oxidation products after FPOP. The m/z of the peptide oxidation products are calculated based on the m/z of the unoxidized peptide and the known oxidation products; and the areas of these peptide products are determined. The area of the peptide products is then used for the calculation of the average oxidation events per peptide. Please click here to view a larger version of this figure.
- Calculate the average oxidation of the peptides using the following equation.

where P denotes the average number of oxidation events per peptide molecule, and I represents the peak area of the unoxidized peptide (Iunoxidized) and the peptide with n oxidation events. Note that I(singly oxidized) would include not only additions of a single oxygen atom but also other less-common single oxidation events that the investigator may choose to measure (e.g., oxidative decarboxylation, carbonyl formation, etc.)4,26,27,28,29.
Access restricted. Please log in or start a trial to view this content.
Results
Comparison of the heavy chain peptide footprint of the adalimumab biosimilar in phosphate buffer and when heated at 55 °C for 1 h show interesting results. Student’s t-test is used for the identification of peptides that are significantly changed in these two conditions (p ≤ 0.05). The peptides 20-38, 99-125, 215-222, 223-252, 260-278, 376-413, and 414-420 show significant protection from solvent when the protein is heated to form aggregates (Figure 5)30. This experim...
Access restricted. Please log in or start a trial to view this content.
Discussion
Mass spectrometry-based structural techniques, including hydrogen-deuterium exchange, chemical cross-linking, covalent labeling, and native spray mass spectrometry and ion mobility have been rapidly growing in popularity due to their flexibility, sensitivity, and ability to handle complex mixtures. FPOP boasts several advantages that has boosted its popularity in the area of mass spectrometry-based structural techniques. Like most covalent labeling strategies, it provides a stable chemical snapshot of protein topography ...
Access restricted. Please log in or start a trial to view this content.
Disclosures
Joshua S. Sharp discloses a significant financial interest in GenNext Technologies, Inc., a small company seeking to commercialize technologies for protein higher order structure analysis including hydroxyl radical protein footprinting.
Acknowledgements
We acknowledge research funding from the National Institute of General Medical Sciences grant R43GM125420-01to support commercial development of a benchtop FPOP device and R01GM127267 for the development of standardization and dosimetry protocols for high-energy FPOP.
Access restricted. Please log in or start a trial to view this content.
Materials
| Name | Company | Catalog Number | Comments |
|---|---|---|---|
| Adenine | Acros Organics | 147440250 | Soluble in water upto 3.5 mM |
| Aperture | Edmund Optics | 39-905 | 1000 μm Aperture Diameter, Gold-Plated Copper Aperture |
| Aperture holder | Edmund Optics | 53-287 | 25.8mm Outer Diameter, Precision Pinhole Mount |
| Catalse | Sigma Aldrich | C-40 | Catalase from bovine liver, lyophilized powder, ≥10,000 units/mg protein |
| COMPex Pro laser | Coherent | 1113836 | COMPexPRO 102, F-Vversion, KrF laser, No XeCl |
| Dithiotheitol (DTT) | Promega | V3151 | DTT, Molecular Grade (DL-Dithiothreitol) |
| Fraction collector | GenNext Technologies, Inc. | N/A | Automated fraction collector |
| Fused silica capillay | Molex | 1068150023 | Polymicro Flexible Fused Silica Capillary Tubing, Inner Diameter 100 µm, Outer Diameter 375 µm, TSP100375 |
| Glutamine | Acros Organics | 119951000 | L(+)-Glutamine, 99% |
| Holder for lens | Edmund Optics | 03-668 | 53 mm Outer Diameter, Three-Screw Adjustable Ring Mount |
| Hydrogen peroxide | Fisher Scientific | H325-100 | Hydrogen Peroxide, 30% (Certified ACS), Fisher Chemical |
| LC-MS/MS system | Thermo Scientific | IQLAAEGAAPFADBMBCX | Dionex Ultimate 3000 coupled to Orbitap Fusion Tribrid mass spectrometer |
| Mas spec grade Acetonitrile | Fisher Scientific | A955-1 | Acetonitrile, Optima LC/MS Grade, Fisher Chemical |
| Mass spec grade formic acid | Fisher Scientific | A117-50 | Formic Acid, 99.0+%, Optima™ LC/MS Grade, Fisher Chemical |
| Mass spec grade water | Fisher Scientific | W6-4 | Water, Optima LC/MS Grade, Fisher Chemical |
| MES buffer | Sigma Aldrich | M0164 | MES hemisodium salt |
| Methionine amide | Bachem | 4000594.0005 | H-met-NH2.HCl |
| Micro V clamp | Thor Labs | VK250 | Micro V-clamp with stainless steel blades |
| Motorized stage | Edmund Optics | 68-638 | 50mm Travel Motorized Stage System with Manual Control |
| Nano C18 colum | Thermo Scientific | 164534 | Acclaim PepMap 100 C18 HPLC Columns |
| Optical bench | Edmund Optics | 56-935 | 18" x 18" breadboard |
| Pioneer FPOP Module System | GenNext Technologies, Inc. | N/A | Inline FPOP Radical Dosimetry System |
| Post holder | Edmund Optics | 58-979 | 3" Length, ¼-20 Thread, Post Holder |
| Sodium phosphate dibasic | Fisher Scientific | BP331-500 | Sodium Phosphate Dibasic Heptahydrate (Colorless-to-White Crystals), Fisher BioReagents |
| Sodium phosphate monobasic | Fisher Scientific | BP330-500 | Sodium Phosphate Monobasic Monohydrate (Colorless-to-white Crystals), Fisher BioReagents |
| Syringe | Hamilton | 81065 | 100 µL, Model 1710 RN SYR, Small Removable NDL, 22s ga, 2 in, point style 3 |
| Syringe pump | KD Scientific | 788101 | Legato 101 syringe pump |
| Trap C18 column | Thermo Scientific | 160454 | Thermo Scientific Acclaim PepMap 100 C18 HPLC Columns |
| Tris | Sigma Aldrich | 252859 | Tris(hydroxymethyl)aminomethane |
| Trypsin | Promega | V5111 | Sequencing Grade Modified Trypsin |
| UV plano convex lens | Edmund Optics | 84-285 | 30 mm Dia. x 120 mm FL Uncoated, UV Plano-Convex Lens |
References
- Kaur, P., Kiselar, J., Yang, S., Chance, M. R. Quantitative protein topography analysis and high-resolution structure prediction using hydroxyl radical labeling and tandem-ion mass spectrometry (MS). Molecular & Cellular Proteomics. 14 (4), 1159-1168 (2015).
- Hambly, D. M., Gross, M. L. Laser flash photolysis of hydrogen peroxide to oxidize protein solvent-accessible residues on the microsecond timescale. Journal of the American Society for Mass Spectrometry. 16 (12), 2057-2063 (2005).
- Buxton, G. V., Greenstock, C. L., Helman, W. P., Ross, A. B. Critical review of rate constants for reactions of hydrated electrons, hydrogen atoms and hydroxyl radicals (·OH/·O- in Aqueous Solution. Journal of Physical and Chemical Reference Data. 17 (2), 513(1988).
- Xu, G., Chance, M. R. Radiolytic modification and reactivity of amino acid residues serving as structural probes for protein footprinting. Analytical Chemistry. 77 (14), 4549-4555 (2005).
- Sharp, J. S., Tomer, K. B. Effects of anion proximity in peptide primary sequence on the rate and mechanism of leucine oxidation. Analytical Chemistry. 78 (14), 4885-4893 (2006).
- Huang, W., Ravikumar, K. M., Chance, M. R., Yang, S. Quantitative mapping of protein structure by hydroxyl radical footprinting-mediated structural mass spectrometry: a protection factor analysis. Biophysical Journal. 108 (1), 107-115 (2015).
- Xie, B., Sood, A., Woods, R. J., Sharp, J. S. Quantitative protein topography measurements by high resolution hydroxyl radical protein footprinting enable accurate molecular model selection. Scientific Reports. 7 (1), 4552(2017).
- Li, Z., et al. High structural resolution hydroxyl radical protein footprinting reveals an extended Robo1-heparin binding interface. Journal of Biological Chemistry. 290 (17), 10729-10740 (2015).
- Li, X., et al. Structural analysis of the glycosylated intact HIV-1 gp120-b12 antibody complex using hydroxyl radical protein footprinting. Biochemistry. 56 (7), 957-970 (2017).
- Li, K. S., Shi, L., Gross, M. L. Mass spectrometry-based fast photochemical oxidation of proteins (FPOP) for higher order structure characterization. Accounts of Chemical Research. 51 (3), 736-744 (2018).
- Li, J., Chen, G. The use of fast photochemical oxidation of proteins coupled with mass spectrometry in protein therapeutics discovery and development. Drug Discovery Today. 24 (3), 829-834 (2019).
- Roush, A. E., Riaz, M., Misra, S. K., Weinberger, S. R., Sharp, J. S. Intrinsic buffer hydroxyl radical dosimetry using Tris(hydroxymethyl)aminomethane. Journal of the American Society for Mass Spectrometry. 31 (2), 169-172 (2020).
- Xie, B., Sharp, J. S. Hydroxyl radical dosimetry for high flux hydroxyl radical protein footprinting applications using a simple optical detection method. Analytical Chemistry. 87 (21), 10719-10723 (2015).
- Niu, B., Zhang, H., Giblin, D., Rempel, D. L., Gross, M. L. Dosimetry determines the initial OH radical concentration in fast photochemical oxidation of proteins (FPOP). Journal of the American Society for Mass Spectrometry. 26 (5), 843-846 (2015).
- Niu, B., et al. Incorporation of a reporter peptide in FPOP compensates for adventitious scavengers and permits time-dependent measurements. Journal of the American Society for Mass Spectrometry. 28 (2), 389-392 (2017).
- Garcia, N. K., Sreedhara, A., Deperalta, G., Wecksler, A. T. Optimizing hydroxyl radical footprinting analysis of biotherapeutics using internal standard dosimetry. Journal of the American Society for Mass Spectrometry. 31 (7), 1563-1571 (2020).
- Sharp, J. S., Misra, S. K., Persoff, J. J., Egan, R. W., Weinberger, S. R. Real time normalization of fast photochemical oxidation of proteins experiments by inline adenine radical dosimetry. Analytical Chemistry. 90 (21), 12625-12630 (2018).
- Zhang, B., Cheng, M., Rempel, D., Gross, M. L. Implementing fast photochemical oxidation of proteins (FPOP) as a footprinting approach to solve diverse problems in structural biology. Methods. 144, 94-103 (2018).
- Konermann, L., Stocks, B. B., Czarny, T. Laminar flow effects during laser-induced oxidative labeling for protein structural studies by mass spectrometry. Analytical Chemistry. 82 (15), 6667-6674 (2010).
- Gau, B. C., Sharp, J. S., Rempel, D. L., Gross, M. L. Fast photochemical oxidation of protein footprints faster than protein unfolding. Analytical Chemistry. 81 (16), 6563-6571 (2009).
- Li, K. S., et al. Hydrogen-Deuterium exchange and hydroxyl radical footprinting for mapping hydrophobic interactions of human bromodomain with a small molecule Inhibitor. Journal of the American Society for Mass Spectrometry. 30 (12), 2795-2804 (2019).
- Espino, J. A., Jones, L. M. Illuminating biological interactions with in vivo protein footprinting. Analytical Chemistry. 91 (10), 6577-6584 (2019).
- Charvatova, O., et al. Quantifying protein interface footprinting by hydroxyl radical oxidation and molecular dynamics simulation: application to galectin-1. Journal of the American Society for Mass Spectrometry. 19 (11), 1692-1705 (2008).
- Gau, B., Garai, K., Frieden, C., Gross, M. L. Mass spectrometry-based protein footprinting characterizes the structures of oligomeric apolipoprotein E2, E3, and E4. Biochemistry. 50 (38), 8117-8126 (2011).
- Gau, B. C., Chen, J., Gross, M. L. Fast photochemical oxidation of proteins for comparing solvent-accessibility changes accompanying protein folding: Data processing and application to barstar. Biochimica et Biophysica Acta. 1834 (6), 1230-1238 (2013).
- Garrison, W. M. Reaction mechanisms in the radiolysis of peptides, polypeptides, and proteins. Chemical Reviews. 87 (2), 381-398 (1987).
- Xu, G., Chance, M. R. Radiolytic modification of sulfur-containing amino acid residues in model peptides: fundamental studies for protein footprinting. Analytical Chemistry. 77 (8), 2437-2449 (2005).
- Xu, G., Chance, M. R. Radiolytic modification of acidic amino acid residues in peptides: probes for examining protein-protein interactions. Analytical Chemistry. 76 (5), 1213-1221 (2004).
- Xu, G., Takamoto, K., Chance, M. R. Radiolytic modification of basic amino acid residues in peptides: probes for examining protein-protein interactions. Analytical Chemistry. 75 (24), 6995-7007 (2003).
- Misra, S. K., Orlando, R., Weinberger, S. R., Sharp, J. S. Compensated hydroxyl radical protein footprinting measures buffer and excipient effects on conformation and aggregation in an adalimumab biosimilar. AAPS Journal. 21 (5), 87(2019).
- Simmons, D. A., Konermann, L. Characterization of transient protein folding intermediates during myoglobin reconstitution by time-resolved electrospray mass spectrometry with on-line isotopic pulse labeling. Biochemistry. 41 (6), 1906-1914 (2002).
- Vahidi, S., Konermann, L. Probing the time scale of FPOP (fast photochemical oxidation of proteins): radical reactions extend over tens of milliseconds. Journal of the American Society for Mass Spectrometry. 27 (7), 1156-1164 (2016).
- Chance, M. R. Unfolding of apomyoglobin examined by synchrotron footprinting. Biochemical and Biophysical Research Communications. 287 (3), 614-621 (2001).
- Xu, G., Chance, M. R. Hydroxyl radical-mediated modification of proteins as probes for structural proteomics. Chemical Reviews. 107 (8), 3514-3543 (2007).
- Zhang, Y., Rempel, D. L., Zhang, H., Gross, M. L. An improved fast photochemical oxidation of proteins (FPOP) platform for protein therapeutics. Journal of the American Society for Mass Spectrometry. 26 (3), 526-529 (2015).
- Cornwell, O., Radford, S. E., Ashcroft, A. E., Ault, J. R. Comparing hydrogen deuterium exchange and fast photochemical oxidation of proteins: a structural characterisation of wild-type and ΔN6 β(2)-microglobulin. Journal of the American Society for Mass Spectrometry. 29 (2), 2413-2426 (2018).
- Xie, B., Sharp, J. S. Relative Quantification of sites of peptide and protein modification using size exclusion chromatography coupled with electron transfer dissociation. Journal of the American Society for Mass Spectrometry. 27 (8), 1322-1327 (2016).
- Srikanth, R., Wilson, J., Vachet, R. W. Correct identification of oxidized histidine residues using electron-transfer dissociation. Journal of Mass Spectrometry. 44 (5), 755-762 (2009).
- Li, X., Li, Z., Xie, B., Sharp, J. S. Improved identification and relative quantification of sites of peptide and protein oxidation for hydroxyl radical footprinting. Journal of the American Society for Mass Spectrometry. 24 (11), 1767-1776 (2013).
- Li, X., Li, Z., Xie, B., Sharp, J. S. Supercharging by m-NBA Improves ETD-Based Quantification of Hydroxyl Radical Protein Footprinting. Journal of the American Society for Mass Spectrometry. 26 (8), 1424-1427 (2015).
- Khaje, N. A., Sharp, J. S. Rapid quantification of peptide oxidation isomers from complex mixtures. Analytical Chemistry. 92 (5), 3834-3843 (2020).
Access restricted. Please log in or start a trial to view this content.
Reprints and Permissions
Request permission to reuse the text or figures of this JoVE article
Request Permission