Segmentation and linear measurements quantify skeletal muscle mass and adipose tissues using Computed Tomography and/or Magnetic Resonance Imaging images. Here, we outline the use of Slice-O-Matic software and Horos image viewer for rapid and accurate analysis of body composition. These methods can provide important information for prognosis and risk stratification.
Method Article
Segmentation and Linear Measurement for Body Composition Analysis using Slice-O-Matic and Horos
In This Article
Summary
Abstract
Body composition is associated with risk of disease progression and treatment complications in a variety of conditions. Therefore, quantification of skeletal muscle mass and adipose tissues on Computed Tomography (CT) and/or Magnetic Resonance Imaging (MRI) may inform surgery risk evaluation and disease prognosis. This article describes two quantification methods originally described by Mourtzakis et al. and Avrutin et al.: tissue segmentation and linear measurement of skeletal muscle. Patients' cross-sectional image at the midpoint of the third lumbar vertebra was obtained for both measurements. For segmentation, the images were imported into Slice-O-Matic and colored for skeletal muscle, intramuscular adipose tissue, visceral adipose tissue, and subcutaneous adipose tissue. Then, surface areas of each tissue type were calculated using the tag surface area function. For linear measurements, the height and width of bilateral psoas and paraspinal muscles at the level of the third lumbar vertebra are measured and the calculation using these four values yield the estimated skeletal muscle mass. Segmentation analysis provides quantitative, comprehensive information about the patients' body composition, which can then be correlated with disease progression. However, the process is more time-consuming and requires specialized training. Linear measurements are an efficient and clinic-friendly tool for quick preoperative evaluation. However, linear measurements do not provide information on adipose tissue composition. Nonetheless, these methods have wide applications in a variety of diseases to predict surgical outcomes, risk of disease progression and inform treatment options for patients.
Introduction
Assessment of sarcopenia and body composition is currently of great clinical interest. Though specific definitions of sarcopenia vary depending on the setting and context, all definitions include significant loss of skeletal muscle mass or muscle strength, which are closely correlated1,2,3. Body composition analysis incorporates measurements of skeletal muscle mass and adipose tissue distribution, providing more comprehensive information about the general fitness of patients1,3,4. Similarly, disproportionally distributed adipose tissue, especially visceral adipose tissue, has been found to be related to various diseases, including cardiac disease, type II diabetes, and cancer5.
Clinically, sarcopenia and its assessment by linear measurements have been repeatedly shown to be a strong prognostic factor for cancer-specific survival across malignancies and oncologic outcomes following surgery, radiotherapy, and chemotherapy1,2,4,6,7,8. In particular, previous research demonstrates that patients with sarcopenia have decreased cancer-specific survival and overall survival1,2,9,10. Therefore, accurate and rapid clinical assessment of sarcopenia progression is important in determining treatment election. Conventional whole-body composition profiling requires analysis at a three-dimensional (3D) level using imaging techniques, including Computed Tomography (CT), Magnetic Resonance Imaging (MRI), Bone Densitometry (DEXA), and Bioelectrical Impedance Analysis (BIA), which are time-consuming, costly, and require extensive training5,11. Another drawback is a lack of information on adipose distribution, especially for the air displacement plethysmography (ADP) and DEXA12. Therefore, assessment and determination of sarcopenia and body composition with the use of conventional cross-sectional imaging modalities such as CT or MRI, which are used as part of standard-of-care clinical practice, has great clinical value5.
One commonly used segmentation software in the clinical research setting is the Slice-O-Matic program developed by TomoVision. Using the Mourtzakis et al.13 segmentation procedure, the program allows for researchers or clinicians to semi-automatically tag various tissue types such as skeletal muscle (SM), intramuscular adipose tissue (IMAT), visceral adipose tissue (VAT), and subcutaneous adipose tissue (SAT) using density-based thresholds, permitting measurement of the overall cross-sectional areas of each tissue. These measurements are then used to estimate total body skeletal muscle mass and adiposity, often after normalization by a patient's height squared, to identify sarcopenia and sarcopenic obesity by population-based thresholds.
A recent developed method by Avrutin et al.14 using linear measurements of skeletal muscle developed has shown the potential to be equally reliable in estimating total muscle mass using MRI and CT images of the L3 cross section14,15. The psoas and paraspinal muscle groups comprise much of the muscle surface area of the L3 region and have high functionality, suggesting they may be high-fidelity predictors of overall muscle strength, and thus the chief candidates of linear measurement14,15. To calculate the muscular surface area, horizontal and vertical measurements of the psoas and paraspinal muscle groups are obtained using a ruler tool to draw 90° intersecting straight lines. The horizontal and vertical measurements of each muscle group are multiplied to estimate the surface area of each muscle group, which is then used to calculate a linear muscle index when divided by the patient's height. With minimal training, this entire process can take less than 1 min.
Given the potential implications of body composition measurements on patient care, there is an urgent need for creating accessible training materials. In this article, we provide a detailed description of two methods developed by Avrutin et al.14 and Mourtzakis et al.13 to quantify skeletal muscle mass and body composition, respectively, for providers and clinical researchers.
Protocol
The following study and protocols were reviewed and approved by the Institutional Review Board of Emory University.
1. L3 CT Segmentation
- Obtain the axial CT Digital Imaging and Communications in Medicine (DICOM) image.
- In the image viewer, identify the L3 vertebra.
- If possible, select two horizontal window views, and select coronal or sagittal view on the left for reference, and axial view on the right.
- Click on Cross Link to link the left and right windows.
- Scroll down the images from cranial to caudal direction. Identify L1 vertebra, which is the first vertebra without a rib attachment.
- Count from L1 to L3 and use the coronal or sagittal view to identify the slice of the middle of L3. This is identified as the point at which both transverse processes are able to be maximally and equally visualized.
- Select the L3 slice. From the Exam tab, select Send Exam and save the image as a DICOM file.
NOTE: Step 1 is a pre-processing step and is listed here to demonstrate how to obtain an L3 image. If the researcher already has an L3 image, they can go to step 2. If the image viewer does not enable cross-referencing, the researcher can skip 1.1.1 to 1.1.2. If the imaging does not include thoracic region, identify L5, which is anterior to the sacrum, and count from L5 to L3, keeping in mind that the presence of a sixth lumbar vertebra is a normal variant.
- In the image viewer, identify the L3 vertebra.
- Open the DICOM image with Slice-O-Matic Software.
- Drag the DICOM file to anywhere on the Slice-O-Matic window.
- Select Modes | Region Growing to begin segmentation.
- If the version of Slice-O-Matic has Alberta Protocol options at the top of the Modes list of options, then one can also select Step 3: Segmentation to begin segmentation. If using Step 3: Segmentation, complete step 5, and then proceed to step 11.
- Select Tools | Tag Lock. This will enable the user to "lock" tagged colors to ensure they are not accidently colored over or erased later on.
- Skeletal Muscle Identification: Click on 1 (Red) under the Region Growing area on the left side of the screen.
- Click on the Off button by Lower Limit to turn it to On. Click on the arrows by Mouse Wheel to set Disabled to Lower Limit. Drag the slider on Lower Limit to set Hounsfield Unit (HU) threshold as close to -29 as possible, then use the mouse wheel to set HU threshold exactly to -2913.
- Click on the Off button by Upper Limit to turn it to On. Click on the arrows by Mouse Wheel to set Lower Limit to Upper Limit. Drag the slider on Upper Limit to set HU threshold as close to 150 as possible, then use the mouse wheel to set HU threshold exactly to 15013.
- Intramuscular Adipose Tissue (IMAT) Identification: Click on 2 (Green) under the Region Growing area on the left side of the screen.
- Click on the Off button by Lower Limit to turn it to On. Click on the arrows by Mouse Wheel to set Disabled to Lower Limit. Drag the slider on Lower Limit to set HU threshold as close to -190 as possible, then use the mouse wheel to set HU threshold exactly to -19013.
- Click on the Off button by Upper Limit to turn it to On. Click on the arrows by Mouse Wheel to set Lower Limit to Upper Limit. Drag the slider on Upper Limit to set HU threshold as close to -30 as possible, then use the mouse wheel to set HU threshold exactly to -3013.
- Visceral Adipose Tissue (VAT) Identification: Click on 5 (Yellow) under the Region Growing area on the left side of the screen.
- Click on the Off button by Lower Limit to turn it to On. Click on the arrows by Mouse Wheel to set Disabled to Lower Limit. Drag the slider on Lower Limit to set HU threshold as close to -150 as possible, then use the mouse wheel to set HU threshold exactly to -15013.
- Click on the Off button by Upper Limit to turn it to On. Click on the arrows by Mouse Wheel to set Lower Limit to Upper Limit. Drag the slider on Upper Limit to set HU threshold as close to -50 as possible, then use the mouse wheel to set HU threshold exactly to -5013.
- Subcutaneous Adipose Tissue (SAT) Identification: Click on 7 (Cyan) under the Region Growing area on the left side of the screen.
- Click on the Off button by Lower Limit to turn it to On. Click on the arrows by Mouse Wheel to set Disabled to Lower Limit. Drag the slider on Lower Limit to set HU threshold as close to -190 as possible, then use the mouse wheel to set HU threshold exactly to -19013.
- Click on the Off button by Upper Limit to turn it to On. Click on the arrows by Mouse Wheel to set Lower Limit to Upper Limit. Drag the slider on Upper Limit to set HU threshold as close to -30 as possible, then use the mouse wheel to set HU threshold exactly to -3013.
- Use the + and - keys on the keyboard to zoom in and out of the CT image. Adjust the zoom as necessary throughout segmentation to clearly and accurately tag tissues.
- Begin segmenting by selecting 1 for Skeletal Muscle tissue (SM).
- Set the brush option to Paint.
- Use the brush tools found directly under Region Growing to adjust to the desired size of the brush and begin painting over the Psoas, Paraspinal Muscle groups, oblique, and rectus muscle groups.
NOTE: If fluids or organs outside the muscle fascia is tagged in red as muscle, be sure to clear the tagging using the None color selection.
- Once all the muscles are tagged, select 1 in the TAG Lock menu at the bottom left of the screen. This will ensure no muscle is accidently re-tagged or erased as segmentation proceeds.
- Select 2 under Region Growing and paint over all fat tissues (IMAT) within the muscle fascia. Be sure to use the None color selection if any fat or structures outside the muscle fascia are mistakenly tagged as IMAT.
NOTE: The edges of the muscle fascia usually appear lighter than the visceral or subcutaneous fat surrounding it. Be sure to tag all the fat within the lighter edges of the muscle fascia as IMAT and not VAT or SAT. If the linea alba is not tagged as muscle, the entirety of the linea alba should be analyzed as IMAT. - Once all IMAT is tagged, select 2 from the TAG Lock menu at the bottom left of the screen.
- Select 5 from the Region Growing menu to tag the VAT tissue.
- When tagging VAT, depending on the image, it may be easier to use Grow 2D instead of Paint.
- If using Grow 2D, use the smallest Paint Brush option. If using Grow 2D be sure to look back over all tagged VAT and make sure no intralumenal tissue inside intestines or organs is mistakenly tagged, since that fat is usually from either digesting food or other structures which are not VAT.
- If using Paint be sure to not paint inside the lumen of organs or the intestines.
- Once all VAT is tagged, select 5 from the TAG Lock menu at the bottom left of the screen.
- Select 7 from the Region Growing menu to tag SAT tissue.
- When tagging SAT, depending on the image, it is usually easier to use Grow 2D instead of Paint.
- If using Grow 2D, use the smallest Paint Brush option.
- If using Grow 2D be sure to go back over the edges of the image with the None tool selected to be sure no tissue within the muscle fascia is tagged as SAT and to be sure no skin is tagged as SAT.
NOTE: Skin is usually lighter in appearance than SAT and is usually around 2-3 pixels thick, but be aware that skin's appearance and thickness may vary from image to image. - If using Paint, be sure to take care around the edges, particularly around the skin to ensure no tissue is incorrectly tagged.
- When finished tagging tissues, go to Tools | Tag Surface/Volume. This will display the Surface area and volume of each of the tissues tagged, typically the interest is in the surface area.
- Click on Display in Window to fully open the Tag Surface/Volume window. This will also display HU values.
- Record the surface area and HU threshold values.
NOTE: If the Tag Surface/Volume window does not appear in the bottom left of the screen, it may be because there is not enough room to display it. In this case, be sure the Slice-O-Matic window is maximized and then select Tools | Tag Lock to remove the Tag Lock window. This should make enough space to display the Tag Surface/Volume window.
- When complete, go to File | Save TAG Files. This will save a TAG file where the DICOM file is located.
2. L3 MRI Segmentation
- Obtain the axial MRI (T2-weighted sequences) DICOM image
- In the image viewer, identify the L3 vertebra.
- If possible, select two horizontal window views, and select coronal or sagittal view on the left for reference, and axial view on the right.
- Click on Cross Link to link the left and right windows.
- Scroll down the images from cranial to caudal direction. Identify L1 vertebra, which is the first vertebra without a rib attachment.
- Count from L1 to L3 and use the coronal or sagittal view to identify the slice of the middle of L3. This is identified as the point at which both transverse processes are able to be maximally and equally visualized.
- Select the L3 slice. From the Exam tab, select Send Exam and save the image as a DICOM file.
NOTE: Step 1 is a pre-processing step and is listed here to demonstrate how to obtain an L3 image. If the researcher already has an L3 image, they can go to step 2. If the image viewer does not enable cross-referencing, the researcher can skip 1.1.1 to 1.1.2. If the imaging does not include the thoracic region, identify L5, which is anterior to the sacrum, and count from L5 to L3, keeping in mind that the presence of a sixth lumbar vertebra is a normal variant.
- In the image viewer, identify the L3 vertebra.
- Open the DICOM image with Slice-O-Matic software.
- Drag DICOM file to anywhere on the Slice-O-Matic window.
- Select Modes | Region Growing to begin segmentation.
NOTE: Due to poor differentiation of adipose tissues in MRI images, only SM is segmented.- Paraspinal muscles Segmentation: Click on 1 (Red) under the Region Growing area on the left side of the screen.
- In the Preview Mode, histograms of the image would show multiple peaks, with the first peak representing air, and the subsequent second, third, and fourth peaks representing muscle, bone, and fat, respectively.
- Click on the Off button by Lower Limit to turn it to On.
- Click on the arrows by Mouse Wheel to set Disabled to Lower Limit.
- Drag the slider on Lower Limit to set Hounsfield Unit (HU) threshold to 0.
- Click on the Off button by Upper Limit to turn it to On.
- Click on the arrows by Mouse Wheel to set Lower Limit to Upper Limit.
- Drag the slider on Upper Limit to set HU to include the paraspinal muscle.
- Begin Segmenting Paraspinal Muscle by selecting 1 for Skeletal Muscle tissue (SM). Set the brush option to Paint. Use the brush tools found directly under Region Growing to adjust to the desired size of the brush and begin painting over the Paraspinal Muscle groups.
NOTE: If anything is tagged in red as muscle on fluids or organs outside the muscle fascia, be sure to clear the tagging using the None color selection.
- Segmentation of remaining muscle groups: Move the mouse anteriorly to linea alba. In the preview mode, adjust the Upper Limit to include linea alba. This upper limit of the intensity is then adopted for all remaining muscle groups.
- Begin segmenting by selecting 1 for Skeletal Muscle tissue (SM). Set the brush option to Paint. Use the brush tools found directly under Region Growing to adjust to the desired size of the brush and begin painting over the Paraspinal Muscle groups.
NOTE: If anything is tagged in red as muscle on fluids or organs outside the muscle fascia, be sure to clear the tagging using the None color selection.
- Begin segmenting by selecting 1 for Skeletal Muscle tissue (SM). Set the brush option to Paint. Use the brush tools found directly under Region Growing to adjust to the desired size of the brush and begin painting over the Paraspinal Muscle groups.
- Paraspinal muscles Segmentation: Click on 1 (Red) under the Region Growing area on the left side of the screen.
- When finished tagging tissues, go to Tools | Tag Surface/Volume. This will display the surface area and volume of each of the tissues tagged, typically the interest is in the surface area.
- Click on Display in Window to fully open the Tag Surface/Volume window. This will also display HU values.
- Record the surface area and HU threshold values.
NOTE: If the Tag Surface/Volume window does not appear in the bottom left of the screen, it may be because there is not enough room to display it. In this case, be sure the Slice-O-Matic window is maximized and then select Tools | Tag Lock to remove the Tag Lock window. This should make enough space to display the Tag Surface/Volume window. - When complete, go to File | Save TAG Files. This will save a TAG file where the DICOM file is located.
3. Linear Measurement for CT and MRI
- Obtain the axial CT or MRI DICOM image.
- In the image viewer, identify the L3 vertebra.
- If possible, select two horizontal window views, and select coronal or sagittal view on the left for reference, and axial view on the right.
- Click on Cross Link to link the left and right windows.
- Scroll down the images from cranial to caudal direction. Identify L1 vertebra, which is the first vertebra without a rib attachment.
- Count from L1 to L3 and use the coronal or sagittal view to identify the slice of the middle of L3, as identified by the point at which both transverse processes are equally identified.
NOTE: Step 1 is a pre-processing step and is listed here to demonstrate how to obtain an L3 image. If the researcher already has an L3 image, they can go to step 2. If the image viewer does not enable cross-referencing, the researcher can skip 1.1.1 to 1.1.2. If the imaging does not include the thoracic region, identify L5, which is anterior to sacrum, and count from L5 to L3.
- In the image viewer, identify the L3 vertebra.
- Import the image into a medical imaging viewer and open it.
- For Horos: open the app and click on Import.
- Navigate to where the DICOM image is located, select it and click on Open. The file and image should appear under the Patient Name list.
- Double click on Patient Name, then double click on the image to begin linear segmentation.
- Identify the psoas muscles and the paraspinal muscles.
- Select the ruler tool and measure the horizontal (180°) and vertical (90°) diameters of the four muscles mentioned above.
NOTE: The lines must be horizontal and vertical to the image, not diagonal. The horizontal and vertical lines drawn should create a rectangular box that encompasses the entirety of each muscle. Do not simply measure the longest distance of the muscle. If using an image viewer that allows for a box drawing tool, that tool can be used instead of the simple ruler tool. This is provided that the box drawing tool displays at least the height and length of the box. - Record all eight measurements (Right Psoas Width, Right Psoas Length, Left Psoas Width, Left Psoas Length, Right Paraspinal Width, Right Paraspinal Length, Left Paraspinal Width, Left Paraspinal Length) for further analysis.
- Calculate the individual muscle surface area by multiplying the horizontal and vertical value of that muscle.
- Obtain the total muscle surface area psoas muscles and paraspinal muscles by adding the left muscle to the right muscle, respectively.
- Calculate the linear muscle index by dividing the combined surface area (mm2) by patient height squared (m2).
Results
The L3 segmentation procedure results in a tagged CT or MRI image with skeletal muscle (SM) tissue tagged in red, IMAT in green, VAT in yellow, and SAT in cyan (Figure 1). The remaining untagged tissues will remain in their original white, grey, and back hues that correspond to each pixel's respective Hounsfield unit (HU) values. The majority of the untagged tissues that remain in white will be bone, the majority of tissues that remain in greys will be non-skeletal muscle, organ tissue, and adipose tissues within the lumens of intestines, and the majority of the image that remains in black will be air. A properly segmented image will have no red or green tagging outside the skeletal muscle fascia, and no yellow or cyan tagging within the skeletal muscle fascia. Additionally, yellow tagging should not invade lumens of intestines or organs such as the kidney or liver, and cyan tagging should not be present along the lighter outer edges that correspond to skin. Once image segmentation is completed, the surface areas and average tissue HU values should be recorded, alongside the patient's height (Table 1). From this data, one can calculate the skeletal muscle index and proceed with any other analysis relevant to the specific research or clinical questions. Note that for most MRI images, only skeletal muscle can be properly tagged and subsequently analyzed (Table 2). In linear measurements, an index is calculated by dividing the surface area over the square of the height (Table 3).
Common issues researchers may encounter during the segmentation procedure include images that have omission of key information. For example, images may have sizable portions cut or cropped off (Figure 2). Specifically, images that have SAT and/or skeletal muscle tissue cut out of frame will drastically lower the accuracy of surface area calculations of affected tissues. Whether this renders an image unsuitable for analysis will depend on the clinical or research context and must be decided by the research team on a case-by-case basis. Another pitfall is that researchers may inadvertently include spinal cord and bone marrow in skeletal muscle. To avoid this issue, researchers should be well-trained and remain cautious during segmentation. Other common artifacts in CT or MRI images include technical issues caused by patient placement or motion in the scanner, fat stranding and scar tissues around the skeletal muscle fascia, and other oddly shaped artifacts (Figure 3). Technical issues caused by patient motion or improper placement will usually appear lighter, with higher HU values than surrounding tissue. These kind of technical issues usually appear in SAT and can also lower the accuracy of surface area calculation. The clinical or research context will determine the level of tolerance for such issues. Fat stranding and scar tissue artifacts usually do not result in high amounts of error in tissue surface area calculations. However, they can lead to misidentification of the fascial line. Skeletal muscle and IMAT surface areas can be vastly inaccurate in cases where fat strands or scar tissue are mistaken as the muscle fascia line. Other small blemishes and artifacts in CT and MRI images usually do not affect overall image quality except in rare cases. Depending on the clinical or research context, these artifacts may need to be assessed by a radiology expert to verify image quality. The last common issue in CT and MRI images are deformities in the muscle fascia line (Figure 4). These breaks usually will not affect image quality, but images containing large breaks or other deformities in muscle fascia should be assessed by a radiologist to determine if the deformity origin will affect the clinical or research context's analysis.
The L3 linear measurement procedure developed by Avruvin et al. has fewer common errors than the L3 segmentation procedure14,15. The main issues encountered in linear measures revolve around identifying the muscle groups of interest, the two psoas and paraspinal muscle groups (Figure 5). In most cases the psoas edges will be distinct from nearby organs, but in the event that the edge is difficult to discern, changing the HU filters or brightness usually will solve the majority of the issues. Additionally, the edges of the paraspinal muscle groups will often be distinct from other nearby tissues, but one should note that if no clear muscle reaches the bottom-most fascia line, the line should not be included in determining the lower edge of the paraspinal muscle group. Finally, the quadratus lumborum should be excluded when determining the edge of the psoas or paraspinal muscle groups (Figure 5E).

Figure 1: Proper L3 segmentation in Slice-O-Matic. (A) The unaltered axial CT image at L3 vertebrae. (B) The fully tagged axial CT with red corresponding to skeletal muscle (SM), green to Intramuscular Adipose Tissue (IMAT), yellow to Vesical Adipose Tissue (VAT), and cyan to Subcutaneous Adipose Tissue (SAT). Please click here to view a larger version of this figure.
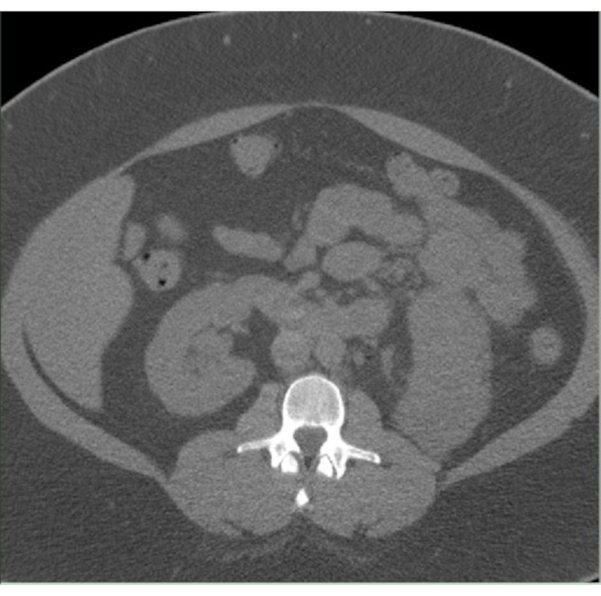
Figure 2: Cut off L3 CT image. An untagged CT image in Slice-O-Matic with substantial amounts of SAT as well as significant amounts of skeletal muscle tissue cut off. Please click here to view a larger version of this figure.
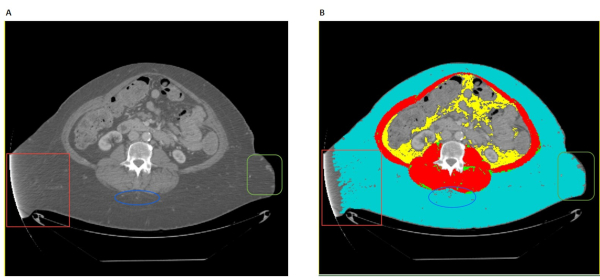
Figure 3: Common artifacts. (A) The untagged CT image has various artifacts highlighted in the red box, blue oval, and green box, respectively. The red box shows technical issues with a CT scan, potentially from malalignment or motion during the scan. The blue oval highlights a common artifact likely stemming from scar tissues. The green square highlights blemishes that may have multiple potential causes. (B) The tagged CT scan with appearances of the same respective artifacts highlighted in the red box, blue oval, and green box. Please click here to view a larger version of this figure.

Figure 4: Large break in muscle fascia. (A) The untagged L3 CT image highlights a large break in the skeletal muscle fascia in the purple box. (B) The tagged L3 CT image highlights the tagged appearance of the large break in the skeletal muscle fascia in the purple box. Please click here to view a larger version of this figure.
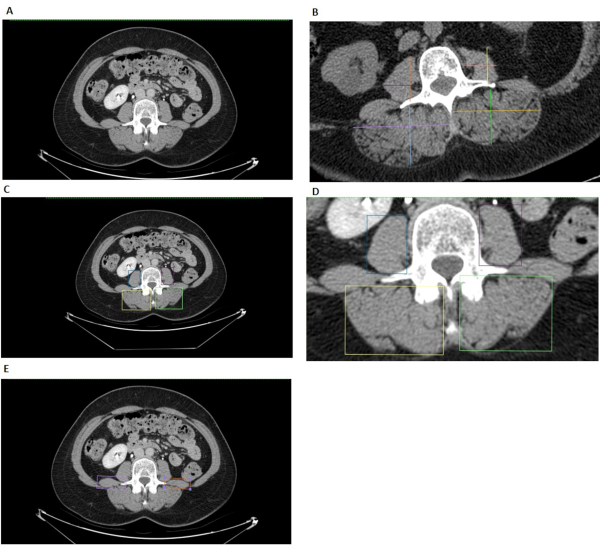
Figure 5: L3 linear measurements. (A) The original L3 CT image prior to analysis in the Horos image viewer. (B) The traditional linear measurement method includes one vertical line and one horizontal line drawn for each muscle. These lines are measured with a ruler tool and multiplied to find each muscle group's surface area. Note the traditional linear measures method should always have lines intersecting at 90˚. This image of the traditional linear measures method is visual demonstration only since it was created in Horos and is not guaranteed to have 90˚ intersections. (C) (D) (E) The Box method for L3 linear measurements. (C) (D) The blue and purple box encompass the right and left psoas, respectively, and the yellow and green box encompass the right and left paraspinal muscle, respectively. (E) The light purple and orange boxes highlight the quadratus lumborum, which should not be considered when determining edges of the Psoas and paraspinal muscle groups. Please click here to view a larger version of this figure.

Figure 6: Comparison of linear measures and L3 cross-sectional skeletal muscle area, n = 65. The combined psoas and paraspinal areas are in accordance with the total skeletal muscle in the L3 cross-section. Please click here to view a larger version of this figure.
| CT SEGMENTATION | ||||
| Muscle | Intramuscular Adipose Tissue | Visceral Adipose Tissue | Subcutaneous Adipose Tissue | |
| Suface Area (cm2) | 134.4 | 8.402 | 72.43 | 271 |
| Hounsfield Unit (mean) | 33.61 | 2.1 | 18.11 | 67.76 |
| Patient Height Squared (m2) | 2.69 | Skeletal Muscle index (Muscle area/Height2, cm2/ m2) | 49.97 |
Table 1: CT Segmentation
| MRI SEGMENATION | |
| Muscle | |
| Suface Area (cm2) | 241.8 |
| Hounsfield Unit (mean) | 35.85 |
| Patient Height (m2) | 3.39 |
| Skeletal Muscle index | 71.42 |
| (Muscle area/Height2, cm2/m2) |
Table 2: MRI Segmentation
| LINEAR MEASURES | |||||||
| Right Psoas Height (cm) | Right Psoas Width (cm) | Left Psoas Height (cm) | Left Psoas Width (cm) | Right Paraspinal Height (cm) | Right Paraspinal Width (cm) | Left Paraspinal Height (cm) | Left Paraspinal Width (cm) |
| 3.934 | 2.927 | 3.743 | 2.788 | 4.916 | 6.264 | 4.403 | 7.045 |
| Total Psoas Area (cm2) | 21.950 | Total Paraspinal Area (cm2) | 61.813 | ||||
| Total Muscle Area (cm2) | 83.76 | ||||||
| Patient Height Squared (m2) | 2.496 | Linear Measure Index (cm2/m2) | 33.55 | ||||
Table 3: Linear Measures
Discussion
The psoas muscle, paraspinal muscle groups, and oblique muscles closely correlate with the overall muscle mass5. In particular, the surface area within a CT or MRI cross section of these muscle groups at the midpoint of the third lumbar vertebra (L3) is highly correlated with overall muscle mass, making this image an ideal one for researchers or clinicians to use when assessing sarcopenia1,2,13. Segmentation and linear measurements have demonstrated great value in assessing body composition and identifying poor prognostic conditions such as sarcopenia and sarcopenic obesity in patients16,17. Research has shown that muscle mass measurements are associated with survival and risks of major complications following major surgeries or treatment plans such as chemotherapy and chemotherapeutic toxicity16,17,18. Therefore, we would posit it may be beneficial for clinicians to have body composition data before counseling patients regarding treatment options.
Currently, there are several methods of assessing body composition. Several methods, such as densitometry12 and air displacement plethysmography (ADP)19, utilize air weight and displacement, respectively to estimate percentage body fat and body density. While these methods can be useful, they are unable to determine adipose tissue distribution5,19. Other body composition analytic techniques, such as BIA, base their analysis upon the differing electric characteristics of fat mass and fat-free mass12. However, once again this technique fails to adequately assess fat distributions, and it also requires more information such as ethnicity, age, and sex for more accurate measurements19. Conversely, assessments such as DEXA have been shown to be useful in body composition assessment, but have a tendency to overestimate muscle mass with increasing adiposity12. Several protocols have also used the Region-of-Interest (ROI) method to obtain muscle mass and adipose tissue data within the DICOM-viewing software, which has been shown to have good correlation with BIA body composition analysis for sarcopenia assessment and nutritional assessment20,21.
The segmentation procedure developed by Mourtzakis et al. has an advantage over alternative body composition assessments since it can be done on most CT or MRI images and accurately determines adipose tissue distributions and muscle area13. Additionally, axial L3 segmentation has the advantage of accuracy regardless of patient obesity status13. Similar to the aforementioned alternatives, the linear measures technique developed by Avrutin et al.14 does not have the ability to assess fat distribution. Recently, researchers have demonstrated disparate in body segmentation, especially in methods measuring psoas muscles alone22. Psoas muscle mass alone is not highly representative of the lumbar muscle quantity or systematic muscle wasting, and may not be highly correlated with clinical outcomes22. This problem may be more concerning in linear measurement, as psoas muscle is the major muscle group in assessment. However, our outlined technique includes bilateral psoas and paraspinal muscle estimations to gauge a more accurate, while still rapid and convenient assessment of cross-sectional muscle mass. Future studies that validate the accordance between CT/MRI linear measurement and segmentation methods and their correlation to clinical outcomes are warranted.
Both the L3 segmentation and linear measurement procedures were initially designed to rapidly and accurately assess body-wide muscle content. By segmenting at the L3 vertebrae only, the protocol saves time while still providing the researchers or clinicians enough information to determine the patient's lean muscle mass and adiposity status. However, even though L3 segmentation takes far less time than full body segmentation, it can still be time-consuming and expensive to use the Slice-O-Matic software. Conversely, linear measurements have the potential to be as accurate as the L3 segmentation in assessing muscle status and sarcopenia in critically ill patients14,15. We have demonstrated such relationship in the T3 renal cell carcinoma cohort, where the skeletal muscle measured by linear measurements is closely correlated with the value measured by segmentation (Figure 6). Importantly, the method is extremely fast, and the imaging software is free. However, the most notable limitation to the linear measurement procedure is its lack of ability to assess adipose tissue content, which limits the clinicians to contexts where general assessment of muscle content is sufficient.
There are three critical steps in both segmentation and linear measurement procedures. First, clinicians and researchers should identify the middle of the L3 vertebrae to achieve consistency. The middle of the L3 vertebrae will be the slice where the marrow of the transverse processes is most prominent. The axial L3 vertebrae slice is more easily identified with the aid of a cross-linked sagittal or coronal view. Researchers or clinicians can first find L1 vertebrae or sacrum as the reference point, keeping in mind that the presence of six lumbar vertebrae instead of five is a normal variant. The next crucial step is identifying muscles. In linear measurements, the quadratus lumborum should not be included while taking the vertical and horizontal measurements. Third, researchers should also pay close attention when labeling VAT in the segmentation protocol, as the colon content may sometimes be tagged as visceral adipose tissue23. When such an error occurs, researchers should erase these areas before moving on to the next step.
A common issue in segmentation is poor CT or MRI image quality (see Representative Results for examples). In some cases, the poor quality does not render the image useless, but in other cases the image may need to be excluded from analysis. Another, possibly unavoidable, limitation of the segmentation of a single image includes the random variation of solid organ position from image to image.
Other common issues for both L3 segmentation analysis and linear measurement analysis are often related to inter and intra-rater variation. As would be the case with most protocols, a certain amount of variation between observers and between a single individual's separate trials can be expected. To account for and minimize inter-rater variation with multiple people performing analysis, the team of researchers or clinicians can test for any statistically significant variations in surface area measurements and average HU from the same image. Take special note of HU variation as this will indicate whether researchers or clinicians who have very similar surface areas for the same image are indeed tagging the tissues approximately the same. To test for significant intra-rater variation for an individual, researchers or clinicians may take a small subset of images and segment each image until all replicas for each image are within a narrow, statistically insignificant margin.
We acknowledge that both the protocols presented here have limitations in body composition analysis as only a single slice is used. As suggested by Shen et al., the 3D analysis may provide more accurate information for the abdominal visceral fat, and single-slice analysis for VAT is at different levels for men and women24. However, the protocols discussed here are still valuable as they provide quick assessments of muscle as well as adipose tissue, which can be used for sarcopenia screening in clinics.
Moreover, there have been many automated body composition analysis protocols using 3D machine learning algorithms, especially neural-net-based classification algorithms25. We acknowledge that these may be the potential future alternatives to traditional 2D segmentation. However, these methods require large datasets of CT and MRI images to be developed, tested, and implemented in clinical and research settings. Plus, these methods often require 2D segmentation analysis to establish a baseline reference against which to validate the machine learning algorithms against. The protocols demonstrated here can therefore be useful when large data sets or 3D images are not available, and these protocols can be applied to help develop and validate machine learning algorithms when they are applicable. Thus, we believe that clinicians and researchers can benefit from this training video and adopt these rapid and reliable methods as preliminary screening before automated analysis is available and in order to facilitate the implementation of this advanced technology.
The ability to rapidly analyze adipose tissue distribution and skeletal muscle mass has a wide breadth of clinical interests ranging from cancer treatment and research to cardiac disease5.Compared to other commonly used methods, the Mourtzakis et al. L3 segmentation procedure in Slice-O-Matic can accurately and rapidly assess adipose tissue distribution and determine sarcopenia status5,12,13,19.Additionally, in contexts where information on skeletal muscle mass is sufficient, L3 linear measurement procedure is a reliable and very fast tool to help predict success in cancer treatments such as surgery, radiotherapy, and chemotherapy1,2,4,6,7,8. The purpose of this training video and manuscript is to clearly delineate the protocol for segmentation and linear measurements for future use so that clinicians can more easily assess body composition in the clinic setting.
Disclosures
The authors have nothing to disclose.
Acknowledgements
The authors would like to acknowledge the support of the John Robinson & Churchill family foundations.
Materials
| Name | Company | Catalog Number | Comments |
|---|---|---|---|
| Centricity PACS Radiology RA 1000 Workstation | GE Healthcare | Image viewer to obtain subject's MRI and CT images | |
| Slice-O-Matic 5.0 | TomoVision | Segmentation software used in this protocol. Other versions of this software may be used, but tools may be slightly different. | |
| Horos | Nimble Co LLC d/b/a Purview | Linear segmentation software used in this protol, but researchers can use any image viewer with a ruler tool. |
References
- Psutka, S. P., et al. Decreased skeletal muscle mass is associated with an increased risk of mortality after radical nephrectomy for localized renal cell cancer. The Journal of Urology. 195 (2), 270-276 (2016).
- Fukushima, H., Nakanishi, Y., Kataoka, M., Tobisu, K., Koga, F. Prognostic significance of sarcopenia in patients with metastatic renal cell carcinoma. The Journal of Urology. 195 (1), 26-32 (2016).
- Santilli, V., Bernetti, A., Mangone, M., Paoloni, M. Clinical definition of sarcopenia. Clinical Cases in Mineral and Bone Metabolism. 11 (3), 117-180 (2014).
- Caan, B. J., et al. Association of muscle and adiposity measured by computed tomography with survival in patients with nonmetastatic breast cancer. JAMA Oncology. 4 (6), 798-804 (2018).
- Borga, M., et al. Advanced body composition assessment: from body mass index to body composition profiling. Journal of Investigative Medicine. 66 (5), 1-9 (2018).
- Cushen, S. J., et al. Body composition by computed tomography as a predictor of toxicity in patients with renal cell carcinoma treated with sunitinib. American Journal of Clinical Oncology. 40 (1), 47-52 (2017).
- Bernstein, A. P., et al. A comparison of perinephric fat surface area and Mayo Adhesive Probability score in predicting malignancy in T1 renal masses. Urologic Oncology. 36 (11), 417-499 (2018).
- Auclin, E., et al. Prediction of everolimus toxicity and prognostic value of skeletal muscle index in patients with metastatic renal cell carcinoma. Clinical Genitourinary Cancer. 15 (3), 350-355 (2017).
- Vashi, P. G., et al. Sarcopenia supersedes subjective global assessment as a predictor of survival in colorectal cancer. PLoS One. 14 (6), 0218761(2019).
- Elliott, J. A., et al. Sarcopenia: prevalence, and impact on operative and oncologic outcomes in the multimodal management of locally advanced esophageal cancer. Annals of Surgery. 266 (5), 822-830 (2017).
- Kanellakis, S., et al. Development and validation of a bioelectrical impedance prediction equation estimating fat free mass in Greek - Caucasian adult population. Clinical Nutrition ESPEN. 36, 166-170 (2020).
- Bredella, M. A., et al. Comparison of DXA and CT in the assessment of body composition in premenopausal women with obesity and anorexia nervosa. Obesity (Silver Spring). 18 (11), 2227-2233 (2010).
- Mourtzakis, M., et al. A practical and precise approach to quantification of body composition in cancer patients using computed tomography images acquired during routine care. Applied Physiology, Nutrition, and Metabolism. 33 (5), 997-1006 (2008).
- Avrutin, E., et al. Clinically practical approach for screening of low muscularity using electronic linear measures on computed tomography images in critically ill patients. JPEN. Journal of Parenteral and Enteral Nutrition. 42 (5), 885-891 (2018).
- Cespedes Feliciano, E. M., Avrutin, E., Caan, B. J., Boroian, A., Mourtzakis, M. Screening for low muscularity in colorectal cancer patients: a valid, clinic-friendly approach that predicts mortality. Journal of Cachexia, Sarcopenia and Muscle. 9 (5), 898-908 (2018).
- Peng, P., et al. Impact of sarcopenia on outcomes following resection of pancreatic adenocarcinoma. Journal of Gastrointestinal Surgery. 16 (8), 1478-1486 (2012).
- Jones, K. I., Doleman, B., Scott, S., Lund, J. N., Williams, J. P. Simple psoas cross-sectional area measurement is a quick and easy method to assess sarcopenia and predicts major surgical complications. Colorectal Disease. 17 (1), 20-26 (2015).
- Prado, C. M., et al. Sarcopenia as a determinant of chemotherapy toxicity and time to tumor progression in metastatic breast cancer patients receiving capecitabine treatment. Clinical Cancer Research. 15 (8), 2920-2926 (2009).
- Fields, D. A., Goran, M. I., McCrory, M. A. Body-composition assessment via air-displacement plethysmography in adults and children: a review. The American Journal of Clinical Nutrition. 75, 453-467 (2002).
- Zopfs, D., et al. Single-slice CT measurements allow for accurate assessment of sarcopenia and body composition. European Radiology. 30 (3), 1701-1708 (2020).
- Schwenzer, N. F., et al. Quantitative analysis of adipose tissue in single transverse slices for estimation of volumes of relevant fat tissue compartment. Investigative Radiology. 45 (12), 788-794 (2010).
- Baracos, V. E. Psoas as a sentinel muscle for sarcopenia: a flawed premise. Journal of Cachexia, Sarcopenia and Muscle. 8 (4), 527-528 (2017).
- Potretzke, A. M., Schmitz, K. H., Jensen, M. D. Preventing overestimation of pixels in computed tomography assessment of visceral fat. Obesity Research. 12 (10), 1698-1701 (2004).
- Shen, W., et al. Total body skeletal muscle and adipose tissue volumes: estimation from a single abdominal cross-sectional image. Journal of Applied Physiology. 97 (6), 2333-2338 (2004).
- Weston, A. D., et al. Automated abdominal segmentation of CT scans for body composition analysis using deep learning. Radiology. 290 (3), 669-679 (2019).
Reprints and Permissions
