The overall goal of the current study is to present the techniques of induction of myocardial infarction (MI) and post-myocardial infarction heart failure (post-MI HF) in closed-chest, adult Göttingen minipigs and the characterization of post-MI HF model in Göttingen minipigs as compared to Landrace pigs.
Method Article
Post-Myocardial Infarction Heart Failure in Closed-chest Coronary Occlusion/Reperfusion Model in Göttingen Minipigs and Landrace Pigs
Gábor B Brenner*1,2 , Zoltán Giricz*1,2 , Rita Garamvölgyi3,4 , András Makkos1 , Zsófia Onódi1 , Nabil V Sayour1 , Tamás G Gergely1 , Tamás Baranyai1 , Örs Petneházy3,4 , Dénes Kőrösi3 , Gergő P. Szabó3 , Hajnalka Vago5 , Zsófia Dohy5 , Csilla Czimbalmos5 , Béla Merkely5 , Swetlana Boldin-Adamsky6 , Elena Feinstein6 , Iván G Horváth7 , Péter Ferdinandy1,2
1Department of Pharmacology and Pharmacotherapy, Semmelweis University, 2Pharmahungary Group, 3Diagnostic, Radiation Oncology, Research and Teaching Center, Moritz Kaposi Somogy County Teaching Hospital, 4Faculty of Agricultural and Environmental Sciences, Kaposvar University, 5Heart and Vascular Center, Semmelweis University, 6Quark Pharmaceuticals, Inc, 7Heart Institute, Medical School, University of Pécs
* These authors contributed equally
Opens in a new tab
In This Article
Summary
Loading...
$$\rightleftharpoonup{xx}$$
$$\longleftharp{xx}$$,
$$\longrightharp{xx}$$,
Abstract
Loading...
$$\rightleftharpoonup{xx}$$
$$\longleftharp{xx}$$,
$$\longrightharp{xx}$$,
The development of heart failure is the most powerful predictor of long-term mortality in patients surviving acute myocardial infarction (MI). There is an unmet clinical need for prevention and therapy of post-myocardial infarction heart failure (post-MI HF). Clinically relevant pig models of post-MI HF are prerequisites for final proof-of-concept studies before entering into clinical trials in drug and medical device development.
Here we aimed to characterize a closed-chest porcine model of post-MI HF in adult Göttingen minipigs with long-term follow-up including serial cardiac magnetic resonance imaging (CMRI) and to compare it with the commonly used Landrace pig model.
MI was induced by intraluminal balloon occlusion of the left anterior descending coronary artery for 120 min in Göttingen minipigs and for 90 min in Landrace pigs, followed by reperfusion. CMRI was performed to assess cardiac morphology and function at baseline in both breeds and at 3 and 6 months in Göttingen minipigs and at 2 months in Landrace pigs, respectively.
Scar sizes were comparable in the two breeds, but MI resulted in a significant decrease of left ventricular ejection fraction (LVEF) only in Göttingen minipigs, while Landrace pigs did not show a reduction of LVEF. Right ventricular (RV) ejection fraction increased in both breeds despite the negligible RV scar sizes. In contrast to the significant increase of left ventricular end-diastolic (LVED) mass in Landrace pigs at 2 months, Göttingen minipigs showed a slight increase in LVED mass only at 6 months.
In summary, this is the first characterization of post-MI HF in Göttingen minipigs in comparison to Landrace pigs, showing that the Göttingen minipig model reflects post-MI HF parameters comparable to the human pathology. We conclude that the Göttingen minipig model is superior to the Landrace pig model to study the development of post-MI HF.
Introduction
Loading...
$$\rightleftharpoonup{xx}$$
$$\longleftharp{xx}$$,
$$\longrightharp{xx}$$,
Despite the decreasing mortality of acute myocardial infarction (MI), the incidence of post-myocardial infarction heart failure (post-MI HF) has not changed over time1. Heart failure (HF) is one of the most powerful predictors of death in MI patients2. To date, reperfusion therapy is the only available treatment option to limit myocardial infarct size and to reduce the risk of a subsequent HF3,4,5. HF and other complications may occur as a consequence of reperfusion injury; therefore, there is still an unmet need for the development of cardioprotective therapies beyond timely reperfusion6,7,8. Numerous cardioprotective therapies effective even in large animal models have been described, but only remote ischemic conditioning (RIC) seemed to improve clinical outcomes of post-MI HF in a small clinical trial9. However, this encouraging result on the efficacy of RIC was questioned in a single-blind, randomized controlled trial (CONDI-2/ERIC-PPCI) performed at 33 centers across Europe in STEMI patients, where RIC failed to improve clinical outcomes10. Potential reasons for the failed translation of the preclinical data might be the use of suboptimal post-MI HF animal models with low clinical relevance11.
Cardiovascular (patho)morphology and (patho)physiology of the pig models resemble human conditions; thus, it is widely used and accepted in translational cardiovascular research12,13,14. Pig breeds used in cardiovascular research belong to the very diverse domestic pig (Sus scrofa domestica) species that includes swine that vary in size, appearance, and genetic background15,16. Although post-MI HF has been researched in pigs extensively, no study was published with the aim of characterizing and comparing the effect of MI on the outcome of post-MI HF in Landrace pigs and Göttingen minipigs. The intensive growth rate of Landrace pigs may affect the cardiac morphofunctional outcomes; however, Göttingen minipigs with restricted growth patterns may overcome these concerns and can serve as a feasible model for long-term follow up in the assessment of post-MI HF. Moreover, a guideline on the relevance of rigor and reproducibility in preclinical studies on cardioprotection recommends the use of cardiac magnetic resonance imaging (CMRI) as a clinically relevant model for measurement of ventricular function in pigs12.
To analyze the scientific interest on post-MI HF in pigs we performed literature search on PubMed using the following search string: "(pig OR swine OR porcine OR sus-scrofa OR minipig OR mini-pig OR miniature-pig OR miniature-swine) AND (infarct* OR ischem* OR ischaem* OR reperfus*) AND (heart OR cardi* OR myocard*) AND (LAD OR left-anterior* OR LCX OR left-circumflex OR RCA) AND (heart-failure OR lvef OR ejection-fraction OR infarct-size OR infarction-size)" and found that pig models of cardiac ischemia/reperfusion are frequently used to study MI and post-MI HF, but only 17% (71 out of 425 articles) of studies involved minipigs and 7% (30 out of 425 articles) used Göttingen minipigs. Only about 1% (5 out of 425) of studies used Göttingen minipigs and clinically relevant protocols with long-term follow-up (1-9 months of reperfusion) and CMRI to analyze cardiac function. The small number of clinically relevant studies highlights the translational gap between basic research and clinical trials. Therefore, a comprehensive characterization of the closed-chest post-MI HF models in Göttingen minipigs and Landrace pigs with repeated assessment of left and right ventricular function and anatomy using CMRI during long-term follow up is required. Here we aimed to focus on the technical feasibility and clinical relevance of two post-MI HF models to describe standardized and reproducible experimental protocols for post-MI HF studies that may be used to assess cardioprotective drug and/or medical device therapies.
The present study is the first one in the literature to characterize a clinically relevant model of post-MI HF using adult Göttingen minipigs and to compare morphological and cardiac left and right ventricular functional parameters with that of the adolescent Landrace pigs.
Protocol
Loading...
$$\rightleftharpoonup{xx}$$
$$\longleftharp{xx}$$,
$$\longrightharp{xx}$$,
13 healthy and sexually mature female Göttingen minipigs (age between 12 and 14 months) and 10 healthy and sexually immature female Landrace pigs (age between 2 and 3 months) were housed in pig stalls conforming to the size recommendations of the most recent Guide for the Care and Use of Laboratory Animals DHEW and EU Guidelines 63/2010. Animals were not spayed. The temperature of the animal rooms was controlled, and animals were kept at a 12-hour light/dark cycle and vermin-free. Ad libitum feeding leads to overt weight gain in both Göttingen minipigs and Landrace pigs, therefore, pigs from both the breeds were fed with a restricted diet regimen. Göttingen minipigs were put on restricted diet as early as they arrived to the animal facility and for the whole study duration. Special Diet Services pig chow 180-220 g/meal/animal was given twice daily according to "Taking good care of Ellegaard Göttingen Minipigs" guideline (revision date: 13 March, 2013) in the first 2 days. Between day 3 and 12 animals were fed 50% Special Diet Services pig chow and 50% maintenance minipig diet. From day 14 until the end of the study animals were fed a maintenance minipig diet. Landrace pigs received pregnant sow chow, 1.5% of body weight given two times a day according to PIC Wean to Finish Manual 2008 and 2013. All the animals received food individually dispensed and food intake was monitored to avoid competition for chow. Animals with feeding difficulties were fed individually aided by tending personnel. All animals received tap water ad libitum. The experimental protocol of post-MI HF in Göttingen minipigs and in Landrace pigs is shown in Figure 1.
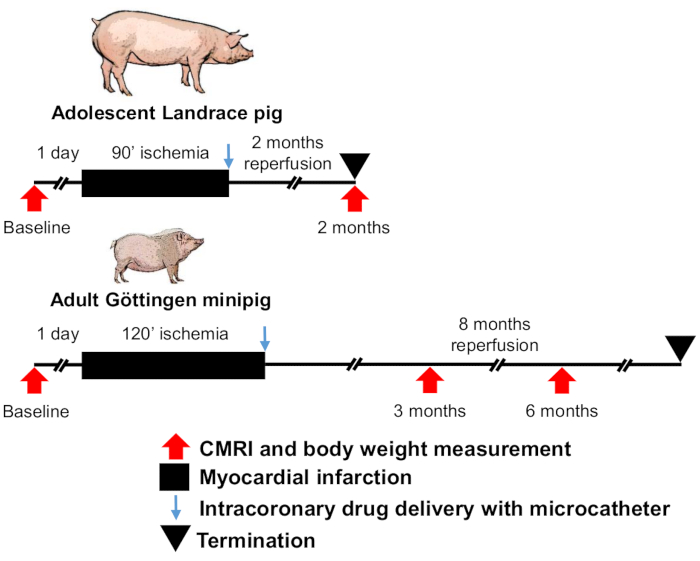
Figure 1. Experimental protocol for post-myocardial infarction-induced heart failure in Landrace pigs and Göttingen minipigs. CMRI - cardiac magnetic resonance imaging. Please click here to view a larger version of this figure.
1. Baseline CMRI
- Withdraw food from animals at least 12 hours before the start of anesthesia but secure access to water to prevent dehydration.
- Anesthesia
- Induce anesthesia of the animals with ketamine hydrochloride (12 mg/kg), xylazine (1 mg/kg), and atropine (0.04 mg/kg) as an intramuscular injection to the neck region.
- Measure the body weight and length of animals. The calculation of the body surface areas (BSA) formulas were described by Itok et al. for Göttingen minipigs (BSA [m2] = (7.98 × BW [kg]2/3)/100)17 and by Swindle et al. for Landrace pigs (BSA [m2] = (7.34 × BW [kg]0.656)/100)18.
- Intubate animals, maintain anesthesia with isoflurane (2% isoflurane, 2 L/min oxygen). The size of the endotracheal tube depends on the individual anatomic characteristics of each animal and ranges between 6.0- to 7.5-mm.
- Cannulate the ear vein with 18 G needle and start administration of 5% glucose in Ringer solution (1 L/hour).
- CMRI
- Transfer animal to CMRI facility and administer 0.4-0.5 mg/kg atracurium besylate i.v.. Atracurium besylate is a nondepolarizing, skeletal muscle relaxant that is used to avoid respiratory artefacts during CMRI measurements. Start positive pressure ventilation (16/min frequency, 350 mL volume, 25-30 mmHg positive pressure).
- Position the animals in the supine position. Place flexible coils on the chest and 32-channel coils are placed in CMRI bed. Perform non-contrast cardiac MRI with a 1.5T scanner, using a phased array coil and a vector electrocardiogram (ECG) system to assess the cardiac function and morphology (ejection fraction (EF), cardiac output (CO), chamber and wall dimensions). Acquire cine MRI images using a retrospectively ECG-gated, steady-state free precession cine MRI technique in short-axis and long-axis views of the heart using 1.2 ms echo time, 40 ms repetition time, 50-degree flip angle, 300 mm field-of-view, 8 mm slice thickness, and at least 256x256 image matrix.
- Quantify left and right ventricular end-diastolic (LVEDV and RVEDV) and end-systolic volumes (LVESV and RVESV), stroke volumes (LVSV and RVSV), EF-s (LVEF and RVEF) and masses by manual planimetry of end-diastolic (LVED mass) and end-systolic (RVED mass) short-axis cine images. Quantify left atrial volume by tracings on the two- and four-chamber cine images. Correct the left atrial volumes to BSA to get left atrial volume indexed to body surface area (LAVi). Assess the presence of pulmonary oedema on the localizer images.
- For calculation of cardiac index (CI) use BSA and cardiac output.
- Terminate the anesthesia by withdrawal of isoflurane. When spontaneous breathing returns, extubate the animal, remove i.v. cannula and return it to its cage.
2. Premedication, vascular access and coronary artery occlusion
- Premedication
- One day prior to surgical procedure administer 500 mg of acetyl salicylic acid and 300 mg of clopidogrel orally.
- Apply analgesia (meloxicam 0.4 mg/kg body weight) and antibiotic cocktail (benzylpenicillin-procain (24.8 mg/mL), benzylpenicillin-benzatine (83.6 mg/mL), dihidrostreptomycine-sulfate (156.3 mg/mL), 3 mL/50 kg body weight) by intramuscular injections on the day of coronary artery occlusion.
- Repeat the steps described in 1.2.1-1.2.4 sections.
- Use the ear vein cannula for fluid replacement and drug administration. Administer 1g magnesium sulfate throughout the procedure via ear vein every 30 min to prevent ventricular tachycardia (VT) and ventricular fibrillation (VF).
- Vascular access
- Place the animal on the operating table, fix the limbs, and apply wedges to immobilize the animal in the supine position.
- Disinfect the surgical site with povidone-iodine. The surgical site is around the skin fold between the gracilis and sartorius muscle.
- Remove the hair at the surgical site with a razor.
- Place surface ECG electrodes in Einthoven's triangle. This triangle is formed by the two anterior limbs and left hind limb and the electrodes are placed on limbs.
- Start positive pressure ventilation (16/min frequency, 350 mL volume, 25-30 mmHg positive pressure).
- Isolate the disinfected surgical area with a surgical drape.
- Approach the femoral region as described in detail by K. S. Ettrup et al.19. In brief, make a longitudinal incision to the skin between the gracilis and sartorius muscles. Separate the subcutaneous tissue and fascia. Isolate the femoral artery and put two surgical sutures below it to control hemorrhage.
- Puncture and cannulate the femoral artery with a 6F-ACT introducer using the Seldinger technique20,21.
- Fix the sheath to the skin.
- Use the artery for blood sampling for further biochemical analyses.
- Administer 5000 IU heparin via the femoral sheath to secure adequate anticoagulation and prevent thrombosis during the surgical intervention. Readminister 2500 IU heparin every 60 min throughout the procedure. The animals received approximately 370-440 IU/kg heparin during the whole intervention.
- Attach a pressure sensor to the femoral vessel to monitor the arterial blood pressure throughout the surgical intervention.
- For calibration of pressure place the pressure recording system on the level of the heart of each animal. After removing the air bubbles, the zero pressure calibration is performed when the three-way stopcock is opened to the direction of the free air.
- Coronary artery occlusion, reperfusion and intracoronary drug administration
- Note that this intervention should be performed only by trained interventional cardiologist. Through the femoral sheath, introduce and advance the guidewire to the aortic arch and introduce the 5F guiding catheter over the guidewire. First, advance the guidewire to approach aortic root atraumatically. Perform deep intubation by a thin, 5F guiding catheter to avoid significant obstruction of the blood flow.
- Position the fluoroscope in antero-posterior position.
- Ensure that there is no thrombus or air bubble within the catheter with the aspiration of at least 5 mL of blood, the volume of the catheter, with the syringe connected to the catheter.
- Connect the outer portion of the catheter to a syringe filled with radiocontrast agent (iobitridol 1.1 mL/50 kg body weight).
- Take care that the syringe is held elevated to prevent infusion of air bubbles into the coronary artery.
- To perform baseline angiography, intubate separately and fill with contrast agent selectively the ostia of right coronary artery and left main coronary artery. For more technical details, refer to catheterization textbooks20,21.
- Perform BARI (Bypass Angioplasty Revascularization Investigation Myocardial Jeopardy Index) scoring after the baseline angiography. A score to all terminal arteries (terminal portion of the left anterior descending, left circumflex, and right coronary artery, as well as the ramus, diagonals, obtuse marginals, posterior descending and posterolateral branches) is assigned based on their length and caliber according to specific criteria22,23. A value of 0 represents an almost insignificant vessel size. In contrast, a value of 3 defines a large-sized artery with a length of two thirds the distance between the base and cardiac apex. Do not take right ventricular marginals and posterior descending artery septal branches into account.
- Calculate the final BARI score (% of the left ventricle at risk) by dividing the total value from the infarct-related artery by the total values of all arteries (Figure 2A-D) supplying the LV. Choose the occlusion site on the left anterior descendent (LAD) coronary artery to achieve approximately 25-30% myocardium at risk as assessed by BARI scoring.
- Insert the percutaneous transluminal coronary angioplasty (PTCA) guidewire through the guiding catheter. Position it distally to the planned site of the occlusion under fluoroscopic guidance, and check angiography for potential complications (e.g., coronary dissection, perforation).
- Determine by visual estimation the optimal balloon size based on coronary artery diameter.
- Place the balloon catheter (balloon diameter 2.5 mm and balloon length 12 mm) over the PTCA guidewire and advance it to the planned position.
- Fill the balloon with contrast agent and check the position of the balloon catheter by angiography.
- Inflate the balloon below the nominal pressure (7-9 atmospheres) of the balloon to develop the soft touch between the balloon side-wall and the surface of the vessel. Soft-touch is defined as interaction of balloon side-wall that is enough to occlude the vessel without causing injury to the vessel wall.
- Confirm the occlusion (TIMI 0) with angiography by visualizing the stop of the contrast flow. Keep in place the guidewire and the balloon and pull back the guiding catheter from the ostium of the coronary artery to avoid diffuse cardiac ischemia.
- Tape instruments to the surgical drape to avoid dislocation of the intracoronary balloon.
- Record and document the ECG sign of occlusion by ST elevation.
- During the whole procedure, carefully monitor the vital signs, heart rate (HR), blood pressure, core temperature using rectal probe, and pulse oximetry.
- Cover the animal with a heating device to maintain the core temperature.
- Administer 1 g of magnesium sulfate as an intravenous bolus if pulseless VT or VF occurs and start chest compressions with a frequency of 100/min immediately. Apply 300J DC shock and lidocaine 2-4 mg/kg as an intravenous bolus. Treat asystole with 1 mg of epinephrine as an intravenous bolus.
- Check balloon pressure every 30 min during the coronary occlusion. If there is a decrease of more than 0.5 bar in balloon pressure, set it back to initial values.
- Perform angiography just before the end of coronary occlusion to verify the maintained balloon placement and absence of flow distally to the occlusion site.
- Administer 2500 IU of heparin and 1 g of magnesium sulfate intracoronarily as a slow bolus to prevent thrombosis and arrhythmias.
- Initiate the reperfusion with balloon deflation after 120 min cardiac ischemia in Göttingen minipigs and after 90 min in Landrace pigs.
- Remove the deflated balloon.
- Confirm the success of reperfusion with coronary angiography to demonstrate the blood flow at the distal part of the coronary vessel (TIMI 3).
3. Intracoronary drug administration
- To prevent coronary artery embolization, fill the therapeutic perfusion microcatheter with saline.
- Place the microcatheter over the PTCA guidewire.
- Advance and confirm the position of the microcatheter. The tip of the microcatheter should be placed at the level of occlusion.
- Remove the PTCA guidewire.
- Connect the microcatheter with the perfusion pump and initiate intracoronary administration 5 minutes after initiation of reperfusion.
- After drug administration remove the microcatheter.
- Make control angiography to check the TIMI 3-grade flow of the contrast and to exclude that intervention led to air emboli or coronary dissection.
4. Wound closure and post-operative care
- Remove the arterial sheath and tie down the femoral artery proximal to the puncture site. Occlusion of femoral artery following the angiographic intervention has no effect on the function of legs in pigs as assessed by daily veterinarian observations.
- Close the wound using continuous sutures and apply antiseptic coating.
- Terminate the anesthesia by withdrawal of isoflurane.
- Closely monitor the animals in the recovery period and inspect them every 12 hours until postoperation day 3, then every 24 hours until the end of the study. Particular attention should be given to eating and drinking behavior, lethargy, signs of infection, painful condition, weight change, mobility, and general health status. Following the procedure, the animals were transported with a van in small groups in cages to avoid unnecessary stress in early postoperative period.
5. Post-MI CMRI and its evaluation
- Anesthesia
- Use the anesthetic protocol described in sections 1.2.1-1.2.4.
- CMRI
- Administer an intravenous bolus of contrast agent, 0.2 mmol/kg gadobutrol at a rate of 4 mL/sec, using a manual injector.
- Take delayed enhancement images using an inversion recovery-prepared, gradient-echo sequence. Obtain short-axis and long-axis images 10 to 15 minutes after the administration of contrast agent.
- Evaluation
- Perform evaluation using MASS 7.6 analysis software in a blinded fashion.
- Assess end-diastolic segmental wall thickness on short-axis cine images.
- Measure scar transmurality on short-axis delayed enhancement images.
- Quantify myocardial necrosis with manual planimetry on the delayed contrast enhancement images by delineating the myocardium with signal intensity 5 SDs above the mean signal obtained in the remote, non-infarcted myocardium.
6. Statistics
- Show continuous data as mean ± standard error.
- Evaluate the difference using repeated measures one-way ANOVA followed by Fisher's LSD test in Göttingen minipigs and paired t-test in Landrace pigs. BARI scores were compared with unpaired t-test and mortality rates with the chi-square test between the two breeds.
- Use GraphPad Prism for data evaluation. The differences were claimed to be statistically significant if p<0.05.
Results
Loading...
$$\rightleftharpoonup{xx}$$
$$\longleftharp{xx}$$,
$$\longrightharp{xx}$$,
Mortality
Out of 13 Göttingen minipigs subjected to myocardial infarction, two animals died (15.4% mortality), one during the ischemic period due to irreversible VT and one owing to asystole in reperfusion. In Göttingen minipigs, one animal was successfully resuscitated during cardiac ischemia. The mortality rate was 0% in Landrace pigs, ten out of ten animals survived, two of them required resuscitation due to VF in the ischemic period. Mortality did not differ significantly between the two breeds.
Myocardial scar sizes were comparable between the two breeds
To measure the extent of cardiac scar as a consequence of MI, CMRI was performed. Scar sizes and BARI scores were comparable between the two breeds measured at the 2nd month of follow-up in Landrace pigs, and at the 3rd and 6th month in Göttingen minipigs (Figure 2E,F). No differences were observed when scar sizes were related to the BARI scores in Landrace pigs at 2 months (0.55 ± 0.1) and in Göttingen minipigs at 3 months and 6 months respectively (0.75 ± 0.12 and 0.57 ± 0.08). The scars were localized in the anterior, anteroseptal, septal, anteroapical and apical segments of the heart in both breeds. The lateral wall was affected only in Göttingen minipigs. Right ventricular infarction was negligible, affected only one animal out of eleven surviving Göttingen minipigs and one out of ten Landrace pigs (2.11 ± 2.11 vs. 0.97 ± 0.97).
Increase in left ventricular mass was more pronounced in Landrace pigs during follow-up
The cardiac growth rate was measured by CMRI. LVED mass in Göttingen minipigs increased only moderately (8%) at 6 months (Figure 3A). In contrast, in Landrace pigs, LVED mass increased by almost 100% at 2 months (Figure 3B).
Left ventricular ejection fraction decreased only in Göttingen minipigs
LVEF, as the most widely used parameter of left ventricular systolic function, was measured by CMRI. MI resulted in a significant decrease in LVEF in minipigs at 3 months and 6 months (Figure 4A). In Landrace pigs, LVEF did not change after 2 months (Figure 4B).
Post-infarction LVESV and LVEDV increased significantly in both breeds (Table 1). LVESV increased by 69% and 80% in Göttingen minipigs after 3 and 6 months, respectively, and by 80% in Landrace pigs after 2 months. LVEDV showed a 28% increase after 3 months and a 42% increase after 6 months in Göttingen minipigs and an 82% increase in Landrace pigs after 2 months. LVSV of Landrace pigs increased by 85% in 2 months and LVSV of Göttingen minipigs did not increase significantly even at 6 months.
Left atrial volume indexed to body surface area increased only in Göttingen minipigs, but both the breeds developed pulmonary oedema following myocardial infarction
In order to further examine signs of HF, we performed measurement of the left atrial volume indexed to body surface area (LAVi). LAVi increased by 34% in Göttingen minipigs after 6 months (Figure 5A) and did not change significantly in Landrace pigs after 2 months (Figure 5B). Representative images show the tracing of the left atria (Figure 5C-D). Moreover, the presence or absence of pulmonary oedema was assessed by CMRI on the localizer images (Figure 5E). Pulmonary oedema was observed in both breeds as a result of cardiac decompensation. Ten out of eleven Göttingen minipigs and nine out of ten Landrace pigs showed obvious signs of pulmonary oedema.
Increase in body weight was more pronounced in Landrace pigs during follow-up
In Göttingen minipigs body weight gain was only 8% after 3 months and 30% after 6 months (Figure 6A), whereas increased heart weight was accompanied by a nearly 100% increase in body weight in Landrace pigs at 2 months (Figure 6B).
Trends in cardiac functional parameters differ between Göttingen minipigs and Landrace pigs
Coronary artery occlusion led to an almost significant decrease in mean arterial pressure (MAP) in Göttingen minipigs (57.9 ± 3.98 mmHg vs. 49.89 ± 1.24 mmHg) and decreased significantly in Landrace pigs (65.4 ± 5.97 mmHg vs. 45.47 ± 4.79* mmHg) in the early reperfusion phase as compared to the baseline (pre-infarction) values.
CI is a reliable indicator of cardiac performance, which relates left ventricular CO to BSA. In Göttingen minipigs, CI did not change at the measured time points (Figure 7A), whereas in Landrace pigs a tendency to increase was detected in cardiac index (Figure 7B).
HR of Göttingen minipigs increased significantly at 3 (20%) and 6 months (22%) after MI compared to baseline values (Table 2).
In contrast, the HR of Landrace pigs did not change significantly during the follow-up period. In Göttingen minipigs CO showed a significant 32% increase only at 6 months of follow-up, whereas CO was increased by 76% in Landrace pigs after 2 months due to a significant increase in LVSV (Table 2). BSA increased significantly in both breeds at the measured time points (Table 2). BSA increased by 4% and 19% in Göttingen minipigs after 3 and 6 months, respectively, and by 54% in Landrace pigs after 2 months.
Increase in right ventricular morphofunctional parameters were observed in both Göttingen minipigs and Landrace pigs
MI affected not only left ventricular function, but it also resulted in a significant increase of RVEF in both breeds (Figure 8) measured by CMRI, despite the negligible right ventricular scar size. RVED mass increased in Landrace pigs only (Table 3).
RVESV did not change during follow up in any of the breeds. RVEDV increased significantly by 37% only in Landrace pigs (Table 3). While RVSV in Göttingen minipigs increased significantly by 23% only after 6 months, in Landrace pigs a significant 80% increase in RVSV was observed at 2 months.
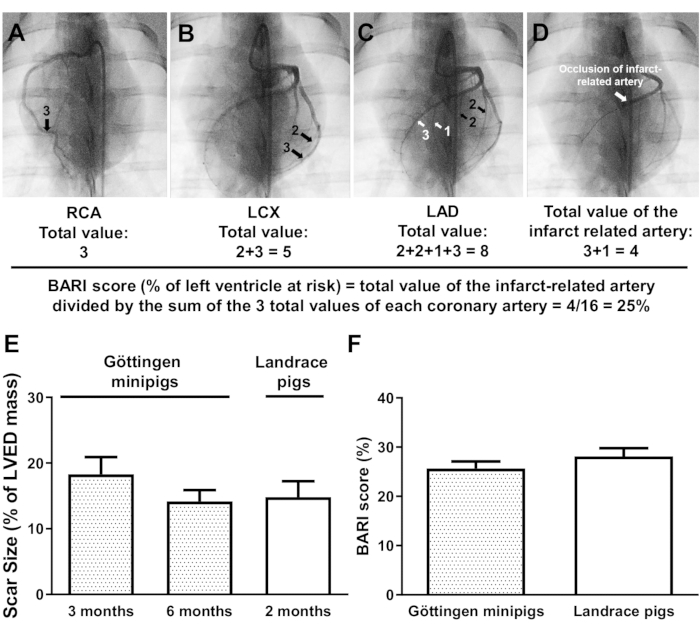
Figure 2. Estimation of the myocardium at risk based on the BARI (Bypass Angioplasty Revascularization Investigation Myocardial Jeopardy Index) score (A-D). The total value of the infarct-related artery is divided by the sum of the 3 total values of each coronary artery, the right coronary artery (RCA), the left circumflex coronary artery (LCX), and the left anterior descending coronary artery (LAD). Left ventricular scar sizes in Göttingen minipigs and Landrace pigs measured by cardiac magnetic resonance imaging (E). Scar size is shown as a ratio of mass of infarction to the mass of left ventricle at end of diastole (LVED). BARI scores in Göttingen minipigs and Landrace pigs measured before coronary occlusion (F). Please click here to view a larger version of this figure.
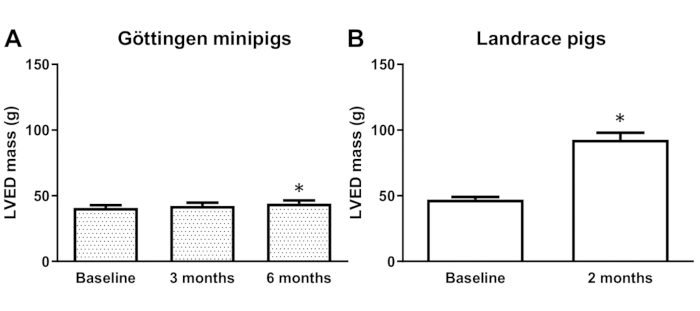
Figure 3. Left ventricular end-diastolic (LVED) mass (g) of Göttingen minipigs (A) and Landrace pigs (B) measured by cardiac magnetic resonance imaging. *p<0.05 vs. corresponding baseline (repeated measures one-way ANOVA followed by Fisher's LSD test in Göttingen minipigs; paired t-test in Landrace pigs). Please click here to view a larger version of this figure.
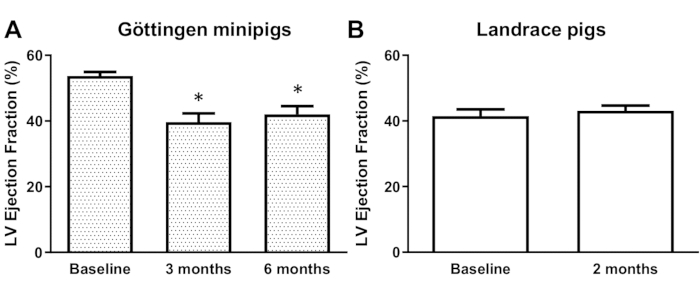
Figure 4. Left ventricular (LV) ejection fraction (%) of Göttingen minipigs (A) and Landrace pigs (B) measured by cardiac magnetic resonance imaging. *p<0.05 vs. corresponding baseline (repeated measures one-way ANOVA followed by Fisher's LSD test in Göttingen minipigs; paired t-test in Landrace pigs). Please click here to view a larger version of this figure.
| Measured parameter | Göttingen minipigs | Landrace pigs | |||
| Baseline | 3 months | 6 months | Baseline | 2 months | |
| LVESV [ml] | 25.77 ± 1.73 | 43.65 ± 4.53* | 46.28 ± 4.35* | 54.59 ± 2.00 | 98.26 ± 8.60* |
| LVEDV [ml] | 55.49 ± 3.14 | 71.08 ± 5.25* | 78.81 ± 5.46* | 93.99 ± 3.85 | 171.20 ± 11.50* |
| LVSV [ml] | 29.71 ± 1.65 | 27.44 ± 1.97 | 32.52 ± 2.37 | 39.40 ± 3.05 | 72.94 ± 3.99* |
Table 1. Left ventricular end-systolic volume (LVESV), left ventricular end-diastolic volume (LVEDV), and left ventricular stroke volume (LVSV) at the measured time points in Landrace pigs and Göttingen minipigs. *p<0.05 vs. corresponding baseline (repeated measures one-way ANOVA followed by Fisher's LSD test in Göttingen minipigs; paired t-test in Landrace pigs).
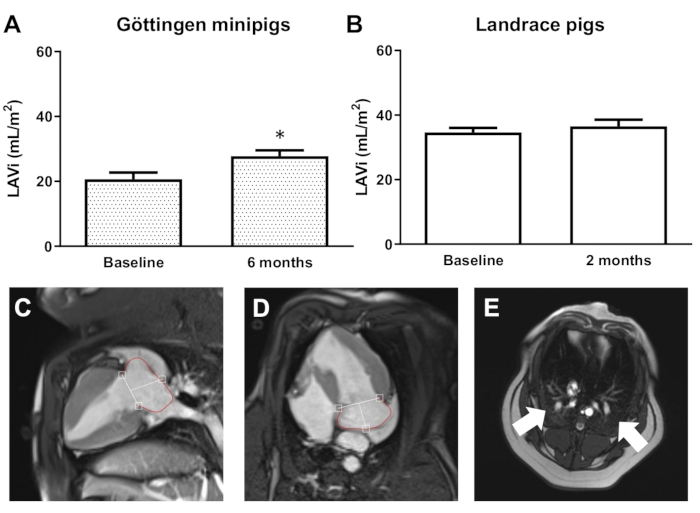
Figure 5. Left atrial volume indexed to body surface area (LAVi) in mL/m2 in Göttingen minipigs (A) and Landrace pigs (B) measured by cardiac magnetic resonance imaging. Representative images of left atrial volumes, tracings were made on the two- (C) and four chamber (D) cine images. The white arrows show the presence of pulmonary oedema on the representative localizer image (E). *p<0.05 vs. corresponding baseline (paired t-test in Göttingen minipigs and Landrace pigs). Please click here to view a larger version of this figure.
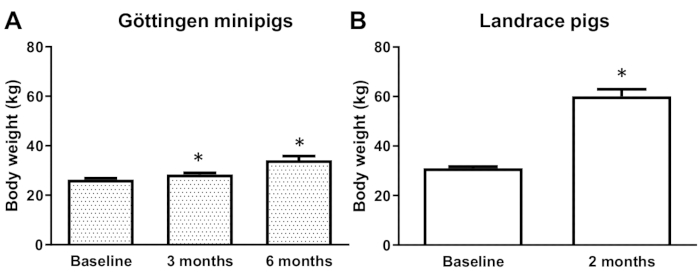
Figure 6. Body weight (kg) of Göttingen minipigs (A) and Landrace pigs (B). *p<0.05 vs. corresponding baseline (repeated measures one-way ANOVA followed by Fisher's LSD test in Göttingen minipigs; paired t-test in Landrace pigs). Please click here to view a larger version of this figure.
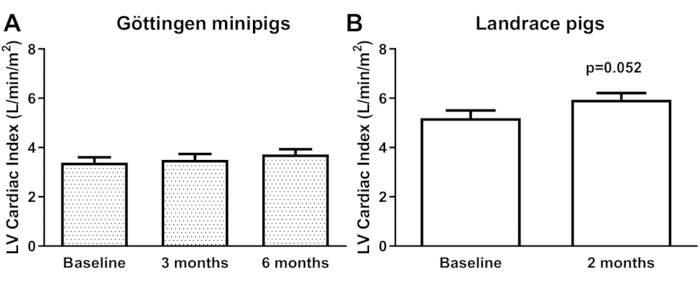
Figure 7. Left ventricular (LV) cardiac indices (L/min/m2) of Göttingen minipigs (A) and Landrace pigs (B). Please click here to view a larger version of this figure.
| Measured parameter | Göttingen minipigs | Landrace pigs | |||
| Baseline | 3 months | 6 months | Baseline | 2 months | |
| HR [1/min] | 79.64 ± 4.03 | 95.55 ± 5.34* | 97.00 ± 4.46* | 93.44 ± 2.73 | 88.00 ± 2.52 |
| CO [L/min] | 2.37 ± 0.16 | 2.58 ± 0.20 | 3.12 ± 0.24* | 3.65 ± 0.25 | 6.41 ± 0.39* |
| BSA [m2] | 0.70 ± 0.01 | 0.73 ± 0.01* | 0.83 ± 0.03* | 0.70 ± 0.01 | 1.08 ± 0.03* |
Table 2. Heart rate (HR), cardiac output (CO), and body surface area (BSA) of Göttingen minipigs and Landrace pigs. *p<0.05 vs. corresponding baseline (repeated measures one-way ANOVA followed by Fisher's LSD test in Göttingen minipigs; paired t-test in Landrace pigs).
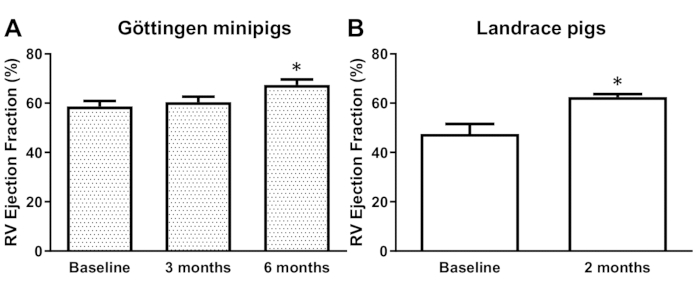
Figure 8. Right ventricular (RV) ejection fractions (%) of Göttingen minipigs (A), and Landrace pigs (B). *p<0.05 vs. corresponding baseline (repeated measures one-way ANOVA followed by Fisher's LSD test in Göttingen minipigs; paired t-test in Landrace pigs). Please click here to view a larger version of this figure.
| Measured parameter | Göttingen minipigs | Landrace pigs | |||
| Baseline | 3 months | 6 months | Baseline | 2 months | |
| RVED mass [g] | 8.64 ± 0.68 | 8.98 ± 0.76 | 7.94 ± 0.77 | 16.49 ± 0.90 | 23.61 ± 1.40* |
| RVESV [ml] | 18.27 ± 1.47 | 16.91 ± 1.80 | 14.57 ± 1.02 | 43.59 ± 3.68 | 42.65 ± 2.37 |
| RVEDV [ml] | 44.16 ± 2.61 | 42.14 ± 2.83 | 46.27 ± 3.45 | 83.03 ± 3.42 | 113.72 ± 5.12* |
| RVSV [ml] | 25.82 ± 1.72 | 25.25 ± 1.67 | 31.71 ± 2.99* | 39.44 ± 3.52 | 71.06 ± 3.38* |
Table 3. Right ventricular end-diastolic (RVED) mass, right ventricular end-systolic volume (RVESV), right ventricular end-diastolic volume (RVEDV), and right ventricular stroke volume (RVSV) in Göttingen minipigs and Landrace pigs. *p<0.05 vs. corresponding baseline (repeated measures one-way ANOVA followed by Fisher's LSD test in Göttingen minipigs; paired t-test in Landrace pigs).
Discussion
Loading...
$$\rightleftharpoonup{xx}$$
$$\longleftharp{xx}$$,
$$\longrightharp{xx}$$,
Here we described a detailed protocol highlighting the critical steps of a technique of induction of acute MI and the evaluation of post-MI HF in a closed-chest model of adult Göttingen minipigs. We also described the method of intracoronary drug administration, BARI scoring, and reported left and right ventricular cardiac morpho-functional changes in a translational post-MI HF model. This is the first characterization of post-MI HF in Göttingen minipigs in comparison to Landrace pigs, showing that the Göttingen minipig model reflects post-MI HF parameters comparable to humans. We conclude that the Göttingen minipig model is superior to the Landrace pig to follow-up the development of post-MI HF. Clinically relevant pig models of post-MI HF are prerequisites for final proof-of-concept studies before entering into clinical trials in most of the cardiovascular drug and medical device development projects6,7,12. Indeed, pig models resemble humans in anatomy, physiology, and biochemical properties in particular in the field of MI research as they develop trans-mural infarctions due to the lack of collateral perfusion14. Therefore, pig models can serve as models for the analysis of cardioprotective therapies and their mechanisms24,25,26,27,28,29.
Here we have found that despite the equal scar sizes, mortality rates, and BARI scores in the two breeds, left ventricular dysfunction characterized by decreased LVEF was observed only in Göttingen minipigs. Here we observed a 15.4% acute mortality in Göttingen minipigs and no mortality in the follow-up period, the latter is comparable to that in clinical studies. Indeed, a patient-level meta-analysis of 10 randomized clinical trials found that the Kaplan-Meier estimated 1-year rate of all-cause mortality was as low as 2.2% following myocardial infarction30. Scar sizes reported here are comparable to those in clinical trials. In clinical trials performed by Lonborg et al and Stone et al in patients surviving ST-elevation myocardial infarction the median scar sizes, measured as % of left ventricular myocardial mass were 9.5% and 17.9% respectively30,31. Moreover, scar sizes in the present study accord with those reported in previous publications in Göttingen minipigs (12-25%)32,33,34,35,36,37 and in Landrace pigs (14-18%)38,39,40. The present finding on baseline LVEF in Landrace swine is according to data reported by others in large swine13,41,42. These values in large swine are smaller as compared to healthy human LVEF reference ranges (58-61%)43 and baseline (pre-infarction) values in Göttingen minipigs (55-73%)33,44,45. Nevertheless, it is worth noting that only the post-infarction data or delta changes of LVEF are reported in most publications46,47,48,49,50. In accordance with the present results, previous studies of either post-MI HF induced by 45 to 90 min LAD occlusion followed by reperfusion or by permanent LAD occlusion have demonstrated either no reduction or modest reduction of LVEF in Landrace or Yorkshire swine after 4-6 weeks follow up as compared to baseline (pre-infarction) LVEF51,52,53. However, Schuleri et al. compared morphofunctional parameters between Göttingen minipigs and Yorkshire swine and found that both breeds showed a decrease of LVEF 8 weeks after induction of MI by 120 to 150 min LAD occlusion-reperfusion; however, baseline LVEF values in Yorkshire swine were not reported54. In other experiments in female Dalland Landrace pigs post-MI adverse remodeling was induced by 90 min LAD occlusion, however, LVEF was not reported after 4 weeks of follow-up55. In contrast to our findings, in a study by de Jong et al., LVEF markedly decreased in Landrace pigs subjected to open chest LAD occlusion and followed by a 12-week follow-up56. This difference can be attributed to substantially longer ischemic period (150 min), which resulted in larger infarct size (23.4 ± 2.1% of LV). Elsewhere, 120-min closed-chest occlusion of left circumflex (LCX) coronary artery in German Landrace pigs led to a significant reduction in LVEF after eight weeks of reperfusion, suggesting that the different location of MI may also affect global left ventricular function57. Our present findings are consistent with others showing significant reduction in LVEF in post-MI HF in Göttingen minipigs after long-term follow up33,44,45.
The reduction of LVEF in Göttingen minipigs following MI is consistent with clinical data showing cardiac dysfunction as a consequence of ventricular remodeling in patients after AMI58. In conclusion, Göttingen minipigs better mimic the human conditions, since pre-infarction LVEF, scar size, post-infarction LVEF, and mortality are all comparable to these parameters found in humans.
Here we observed an 8% increase in LVED mass after six months in Göttingen minipigs and a markedly higher (97%) increase in LVED masses in Landrace pigs after two months. Similar data were reported by Schuleri et al. in Yorkshire pigs, where a 40% increase in heart weight was observed after two months. In contrast, in other experiments of closed-chest post-MI HF in Göttingen minipigs no significant changes in left ventricular masses were observed33,44. Therefore, differences between the two breeds regarding LVEF can be attributed to an intensive cardiac growth rate in Landrace pigs and thus altered cardiac remodeling.
In clinical settings, besides the LVEF, left ventricular volume provides valuable insight into long-term prognosis and mortality rate in post-MI patients59. LVESV is the primary determinant of both early and late mortality in patients after AMI60,61. Here we have shown that ventricular volume assessed by CMRI increased significantly in both breeds. Post-MI remodeling induced a more pronounced increase in LVESV than in LVEDV in Göttingen minipigs, while both LVESV and LVEDV were increased by a similar rate in Landrace pigs. Consequently, left ventricular ejection fraction (LVEF) was significantly decreased at 3 and 6 months only in Göttingen minipigs but not in Landrace pigs after 2 months. These results must be interpreted with caution in Landrace pigs, where increased LVESV, LVEDV, and LVSV (calculated as the difference between the LVESV and LVEDV) are more likely related to an intensive increase in cardiac mass. Increased LVESV and LVEDV are consistent with clinical data of patients with post-MI HF62,63,64. Moreover, adverse left ventricular remodeling was defined as an increase of 15% or more in the LVEDV in clinical studies65,66 and we found here a 28% increase after 3 months and a 42% increase after 6 months in LVEDV in Göttingen minipigs showing a clinically relevant adverse remodeling. In addition, here we have shown that LAVi increased only in Göttingen minipigs, but not in Landrace pigs. Increase of left atrial volume is an additional key structural alteration in the context of HF and is an independent predictor of death and HF hospitalization in patients surviving MI67.
Right ventricular function is rarely studied in post-MI HF models. Here we have found that right ventricular ejection fraction increased in both breeds. Although RV was practically not involved in myocardial necrosis, RVEF increased significantly in both breeds indicating RV volume overload and hence left ventricular dysfunction. Similarly, a clinical study enrolling 2008 patients with chronic systolic HF showed that 733 patients (37%) belonged to normal right ventricular function category with RVEF≥40%68.
In conclusion, we have shown here that the adult Göttingen minipig model with long-term follow-up mimics functional and morphological parameters of post-MI HF comparable to humans. Our present data also show that Landrace pigs are not suitable for the evaluation of post-MI HF mainly due to consequences of the rapid increase in body and heart weight that does not allow long-term follow-up and interferes with post-MI HF pathology. Landrace pigs might be suitable to assess the consequences of acute myocardial infarction. The present comprehensive characterization of the closed-chest infarction models in Landrace and Göttingen minipigs will be useful for choosing the optimal large animal models to study post-MI HF and developing novel therapies against this pathology.
Limitations
The current experiment was performed only in female pigs, therefore, the potential effect of the different sexes on post-MI HF remains unknown in these models69. Signs of HF were assessed by CMRI, according to recommendations of a recent guideline on the relevance of rigor and reproducibility in preclinical studies on cardioprotection12. However, the use of more targeted angulation of CMRI imaging planes and more targeted sequence may result in better estimation of left atrial volumes, and pulmonary oedema. Although we have not measured biomarkers and histological signs of post-MI HF in this study, these models are suitable for analysis of any biomarkers since the availability of plasma and tissue samples. Due to the different susceptibility of the 2 breeds to ischemia/reperfusion injury, different durations of coronary occlusions were selected here that may although limit the comparison of the 2 models, however, by this approach we achieved similar infarct size. The follow-up time in the 2 breeds was different as in the Landrace pigs only 2 months follow up time can be achieved due to technical reasons, i.e. rapid increase in body weight that shows a major limitation of the Landrace model. A further limitation is the lack of different risk factors and comorbidities and thus the present large animal models do not completely mimic the clinical situation in terms of the presence of multiple risk factors including co-morbidities and their medications. However, currently, there are no established large animal models with multiple comorbidities for routine use. These large animal models cannot be powered for mortality analysis due to animal ethical reasons and the high cost of these studies.
Disclosures
Loading...
$$\rightleftharpoonup{xx}$$
$$\longleftharp{xx}$$,
$$\longrightharp{xx}$$,
PF is the founder and CEO of Pharmahungary Group, a Group of R&D companies
Acknowledgements
Loading...
$$\rightleftharpoonup{xx}$$
$$\longleftharp{xx}$$,
$$\longrightharp{xx}$$,
This study was funded by Quark Pharmaceuticals Inc where S.A. and E.F. are employees. This study was also supported by the National Research, Development and Innovation Office of Hungary (NKFIA; NVKP-16-1-2016-0017 National Heart Program), and by the Higher Education Institutional Excellence Program of the Ministry of Human Capacities in Hungary, within the framework of the Therapeutic Development thematic program of the Semmelweis University. GB.B. was supported by EFOP-3.6.3-VEKOP-16-2017-00009 and Gedeon Richter Plc. Scholarship. Z.G. was supported by a János Bolyai Research Scholarships of the Hungarian Academy of Sciences and by the ÚNKP-19-4 New National Excellence Program of the Ministry of Human Capacities.
Materials
| Name | Company | Catalog Number | Comments |
|---|---|---|---|
| Special Diet Services pig chow | SDS, Witham, England, Hungarian distributor: Akronom Kft. | ||
| maintenance minipig diet | no. 9023, Altromin | ||
| pregnant sow chow | Bonafarm-Bábolna Takarmány Plc | ||
| ketamine hydrochloride | Richter Pharma AG | ||
| xylazine | Medicus Partner | ||
| atropine | Egis | ||
| endotracheal tube | Portex | ||
| isoflurane | Abbot | ||
| anesthetic machine | Dräger Julian | ||
| 18 G needle | Anhul Kangda Medical Products Co. Ltd. | ||
| 5% glucose in Ringer solution | B Braun | ||
| atracurium besylate | GSK | ||
| cardiac magnetic resonance machine | Siemens Healthineers Medical GmbH | ||
| acetyl salicylic acid | Bayer | ||
| clopidogrel | Zentiva | ||
| meloxicam (meloxidyl) | Ceva | ||
| antibiotic coctail (tardomyocel) comp III. | Norbrook | ||
| ear vein cannula | B Braun Melsungen AG | ||
| magnesium sulfate | Wörwag Pharma GmbH | ||
| povidone-iodine | Egis | ||
| ECG electrodes | Leonhard Lang GmbH | ||
| 6F-ACT introducer | St Jude Medical | ||
| heparin | TEVA | ||
| arterial pressure sensor and monitoring system | GE Healthcare | ||
| guidewire | PT2MS Boston Scientific | ||
| 5F guiding catheter | Medtronic Launcher, 5F | ||
| fluoroscope, C-bow | Siemens Medical GmbH | ||
| Iobitridol (Xenetix) | Guerbet | ||
| balloon catheter | Boston Scientific, EMERGE, 2.5mm x 12mm | ||
| heating device | 3M | ||
| rectal probe | Vatner Kft | ||
| pulse oxymeter | Comen medical | ||
| epinephrine | Richter Gedeon Rt. | ||
| lidocaine | EGIS | ||
| microcatheter | Caravel ASAHI | ||
| defibrillator | GE Marquette Responder 1100 | ||
| perfusion pump | TSE system | ||
| antiseptic coating | Friedrich Huber aeronova GmbH&Co | ||
| gadobutrol | Bayer | ||
| MASS 7.6 analysis software | Medis Medical Imaging Software, Leiden |
References
Loading...
$$\rightleftharpoonup{xx}$$
$$\longleftharp{xx}$$,
$$\longrightharp{xx}$$,
- Gerber, Y., et al. A contemporary appraisal of the heart failure epidemic in Olmsted County, Minnesota 2000 to 2010. JAMA Internal Medicine. 175 (6), 996-1004 (2015).
- Gerber, Y., et al. Mortality Associated With Heart Failure After Myocardial Infarction: A Contemporary Community Perspective. Circulation: Heart Failure. 9 (1), e002460(2016).
- Paradies, V., Chan, M. H. H., Hausenloy, D. J. Primary Angioplasty: A Practical Guide. Watson, T. J., Ong, P. J. L., Tcheng, J. E. , Springer. 307-322 (2018).
- Ponikowski, P., et al. 2016 ESC Guidelines for the diagnosis and treatment of acute and chronic heart failure: The Task Force for the diagnosis and treatment of acute and chronic heart failure of the European Society of Cardiology (ESC)Developed with the special contribution of the Heart Failure Association (HFA) of the ESC. European Heart Journal. 37 (27), 2129-2200 (2016).
- Windecker, S., et al. ESC/EACTS Guidelines on myocardial revascularization: The Task Force on Myocardial Revascularization of the European Society of Cardiology (ESC) and the European Association for Cardio-Thoracic Surgery (EACTS)Developed with the special contribution of the European Association of Percutaneous Cardiovascular Interventions (EAPCI). European Heart Journal. 35 (37), 2541-2619 (2014).
- Hausenloy, D. J., et al. Novel targets and future strategies for acute cardioprotection: Position Paper of the European Society of Cardiology Working Group on Cellular Biology of the Heart. Cardiovascular Research. 113 (6), 564-585 (2017).
- Lecour, S., et al. ESC working group cellular biology of the heart: position paper: improving the preclinical assessment of novel cardioprotective therapies. Cardiovascular Research. 104 (3), 399-411 (2014).
- Ferdinandy, P., Hausenloy, D. J., Heusch, G., Baxter, G. F., Schulz, R. Interaction of risk factors, comorbidities, and comedications with ischemia/reperfusion injury and cardioprotection by preconditioning, postconditioning, and remote conditioning. Pharmacological Reviews. 66 (4), 1142-1174 (2014).
- Gaspar, A., et al. Randomized controlled trial of remote ischaemic conditioning in ST-elevation myocardial infarction as adjuvant to primary angioplasty (RIC-STEMI). Basic Research in Cardiology. 113 (3), 14(2018).
- Hausenloy, D. J., et al. Effect of remote ischaemic conditioning on clinical outcomes in patients with acute myocardial infarction (CONDI-2/ERIC-PPCI): a single-blind randomised controlled trial. Lancet. 394 (10207), 1415-1424 (2019).
- Heusch, G. Cardioprotection research must leave its comfort zone. European Heart Journal. 39 (36), 3393-3395 (2018).
- Bøtker, H. E., et al. Practical guidelines for rigor and reproducibility in preclinical and clinical studies on cardioprotection. Basic Research in Cardiology. 113 (5), 39(2018).
- McCall, F. C., et al. Myocardial infarction and intramyocardial injection models in swine. Nature Protocols. 7 (8), 1479-1496 (2012).
- Cesarovic, N., Lipiski, M., Falk, V., Emmert, M. Y. Animals in cardiovascular research. European Heart Journal. 41 (2), 200-203 (2020).
- Gutierrez, K., Dicks, N., Glanzner, W. G., Agellon, L. B., Bordignon, V. Efficacy of the porcine species in biomedical research. Frontiers in Genetics. 6, 293(2015).
- Lelovas, P. P., Kostomitsopoulos, N. G., Xanthos, T. T. A comparative anatomic and physiologic overview of the porcine heart. Journal of the American Association for Laboratory Animal Science. 53 (5), 432-438 (2014).
- Itoh, T., et al. Body surface area measurement in laboratory miniature pigs using a computed tomography scanner. Journal of Toxicological Sciences. 41 (5), 637-644 (2016).
- Swindle, M. M., Makin, A., Herron, A. J., Clubb, F. J. Jr, Frazier, K. S. Swine as models in biomedical research and toxicology testing. Veterinary Pathology. 49 (2), 344-356 (2012).
- Ettrup, K. S., et al. Basic surgical techniques in the Gottingen minipig: intubation, bladder catheterization, femoral vessel catheterization, and transcardial perfusion. Journal of Visualized Experiments. (52), (2011).
- Pepine, C. J., Hill, J. A., Labert, C. R. Diagnostic and therapeutic cardiac catheterization. , Wilkins & Wilkins. (1998).
- Thompson, C. A. Textbook Of Cardiovascular Intervention. , Springer London LTD. (2016).
- Moral, S., et al. Quantification of myocardial area at risk: validation of coronary angiographic scores with cardiovascular magnetic resonance methods. Revista Española de Cardiología (English Edition). 65 (11), 1010-1017 (2012).
- Candell-Riera, J., et al. Culprit lesion and jeopardized myocardium: correlation between coronary angiography and single-photon emission computed tomography. Clinical Cardiology. 20 (4), 345-350 (1997).
- Baranyai, T., et al. In vivo MRI and ex vivo histological assessment of the cardioprotection induced by ischemic preconditioning, postconditioning and remote conditioning in a closed-chest porcine model of reperfused acute myocardial infarction: importance of microvasculature. Journal of Translational Medicine. 15 (1), 67(2017).
- Giricz, Z., et al. Swiprosin-1/EFhD-2 Expression in Cardiac Remodeling and Post-Infarct Repair: Effect of Ischemic Conditioning. International Journal of Molecular Sciences. 21 (9), (2020).
- Gyöngyösi, M., et al. Inhibition of interleukin-1beta convertase is associated with decrease of neointimal hyperplasia after coronary artery stenting in pigs. Molecular and Cellular Biochemistry. 249 (1-2), 39-43 (2003).
- Gyöngyösi, M., et al. Platelet activation and high tissue factor level predict acute stent thrombosis in pig coronary arteries: prothrombogenic response of drug-eluting or bare stent implantation within the first 24 hours. Thrombosis and Haemostasis. 96 (2), 202-209 (2006).
- Lukovic, D., et al. Transcriptional Alterations by Ischaemic Postconditioning in a Pig Infarction Model: Impact on Microvascular Protection. International Journal of Molecular Sciences. 20 (2), (2019).
- Pavo, N., et al. On-line visualization of ischemic burden during repetitive ischemia/reperfusion. JACC Cardiovascular Imaging. 7 (9), 956-958 (2014).
- Stone, G. W., et al. Relationship Between Infarct Size and Outcomes Following Primary PCI: Patient-Level Analysis From 10 Randomized Trials. Journal of the American College of Cardiology. 67 (14), 1674-1683 (2016).
- Lønborg, J., et al. Final infarct size measured by cardiovascular magnetic resonance in patients with ST elevation myocardial infarction predicts long-term clinical outcome: an observational study. European Heart Journal: Cardiovascular Imaging. 14 (4), 387-395 (2013).
- Karantalis, V., et al. Synergistic Effects of Combined Cell Therapy for Chronic Ischemic Cardiomyopathy. Journal of the American College of Cardiology. 66 (18), 1990-1999 (2015).
- Natsumeda, M., et al. A Combination of Allogeneic Stem Cells Promotes Cardiac Regeneration. Journal of the American College of Cardiology. 70 (20), 2504-2515 (2017).
- Quevedo, H. C., et al. Allogeneic mesenchymal stem cells restore cardiac function in chronic ischemic cardiomyopathy via trilineage differentiating capacity. Proceedings of the National Academy of Sciences of the United States of America. 106 (33), 14022-14027 (2009).
- Schuleri, K. H., et al. CT for evaluation of myocardial cell therapy in heart failure: a comparison with CMR imaging. JACC: Cardiovascular Imaging. 4 (12), 1284-1293 (2011).
- Schuleri, K. H., et al. Cardiovascular magnetic resonance characterization of peri-infarct zone remodeling following myocardial infarction. Journal of Cardiovascular Magnetic Resonance. 14 (1), 24(2012).
- Schuleri, K. H., et al. Autologous mesenchymal stem cells produce reverse remodelling in chronic ischaemic cardiomyopathy. European Heart Journal. 30 (22), 2722-2732 (2009).
- Jansen of Lorkeers, S. J., et al. Xenotransplantation of Human Cardiomyocyte Progenitor Cells Does Not Improve Cardiac Function in a Porcine Model of Chronic Ischemic Heart Failure. Results from a Randomized, Blinded, Placebo Controlled Trial. PLoS One. 10 (12), e0143953(2015).
- van Hout, G. P., et al. Admittance-based pressure-volume loops versus gold standard cardiac magnetic resonance imaging in a porcine model of myocardial infarction. Physiological Report. 2 (4), e00287(2014).
- Thavapalachandran, S., et al. Platelet-derived growth factor-AB improves scar mechanics and vascularity after myocardial infarction. Science Translational Medicine. 12 (524), (2020).
- Pahlm, U. S., et al. Regional wall function before and after acute myocardial infarction; an experimental study in pigs. BMC Cardiovascular Disorders. 14, 118(2014).
- Baranyai, T., et al. In vivo MRI and ex vivo histological assessment of the cardioprotection induced by ischemic preconditioning, postconditioning and remote conditioning in a closed-chest porcine model of reperfused acute myocardial infarction: importance of microvasculature. Journal of Translational Medicine. 15 (1), 67(2017).
- Petersen, S. E., et al. Reference ranges for cardiac structure and function using cardiovascular magnetic resonance (CMR) in Caucasians from the UK Biobank population cohort. Journal of Cardiovascular Magnetic Resonance. 19 (1), 18(2017).
- Bellera, N., et al. Single intracoronary injection of encapsulated antagomir-92a promotes angiogenesis and prevents adverse infarct remodeling. Journal of the American Heart Association. 3 (5), e000946(2014).
- Sharp, T. E. 3rd, et al. Cortical Bone Stem Cell Therapy Preserves Cardiac Structure and Function After Myocardial Infarction. Circulation Research. 121 (11), 1263-1278 (2017).
- Crisostomo, V., et al. Delayed administration of allogeneic cardiac stem cell therapy for acute myocardial infarction could ameliorate adverse remodeling: experimental study in swine. Journal of Translational Medicine. 13, 156(2015).
- Uitterdijk, A., et al. VEGF165A microsphere therapy for myocardial infarction suppresses acute cytokine release and increases microvascular density but does not improve cardiac function. American Journal of Physiology-Heart and Circulatory Physiology. 309 (3), H396-H406 (2015).
- Vilahur, G., et al. HMG-CoA reductase inhibition prior reperfusion improves reparative fibrosis post-myocardial infarction in a preclinical experimental model. International Journal of Cardiology. 175 (3), 528-538 (2014).
- Vilahur, G., et al. Reperfusion-triggered stress protein response in the myocardium is blocked by post-conditioning. Systems biology pathway analysis highlights the key role of the canonical aryl-hydrocarbon receptor pathway. European Heart Journal. 34 (27), 2082-2093 (2013).
- Zalewski, J., et al. Cyclosporine A reduces microvascular obstruction and preserves left ventricular function deterioration following myocardial ischemia and reperfusion. Basic Research in Cardiology. 110 (2), 18(2015).
- Galvez-Monton, C., et al. Comparison of two preclinical myocardial infarct models: coronary coil deployment versus surgical ligation. Journal of Translational Medicine. 12, 137(2014).
- Ghugre, N. R., Pop, M., Barry, J., Connelly, K. A., Wright, G. A. Quantitative magnetic resonance imaging can distinguish remodeling mechanisms after acute myocardial infarction based on the severity of ischemic insult. Magnetic Resonance in Medicine. 70 (4), 1095-1105 (2013).
- Sim, D. S., et al. Cardioprotective effect of fimasartan, a new angiotensin receptor blocker, in a porcine model of acute myocardial infarction. Journal of Korean Medical Science. 30 (1), 34-43 (2015).
- Schuleri, K. H., et al. The adult Gottingen minipig as a model for chronic heart failure after myocardial infarction: focus on cardiovascular imaging and regenerative therapies. Comparative Medicine. 58 (6), 568-579 (2008).
- Koudstaal, S., et al. Myocardial infarction and functional outcome assessment in pigs. Journal of Visualized Experiments. (86), (2014).
- de Jong, R., et al. Cardiac function in a long-term follow-up study of moderate and severe porcine model of chronic myocardial infarction. BioMed Research International. 2015, 209315(2015).
- Raake, P. W. J., et al. Comprehensive cardiac phenotyping in large animals: comparison of pressure-volume analysis and cardiac magnetic resonance imaging in pig post-myocardial infarction systolic heart failure. International Journal of Cardiovascular Imaging. 35 (9), 1691-1699 (2019).
- Burns, R. J., et al. The relationships of left ventricular ejection fraction, end-systolic volume index and infarct size to six-month mortality after hospital discharge following myocardial infarction treated by thrombolysis. Journal of the American College of Cardiology. 39 (1), 30-36 (2002).
- Cohn, J. N., Ferrari, R., Sharpe, N. Cardiac remodeling--concepts and clinical implications: a consensus paper from an international forum on cardiac remodeling. Behalf of an International Forum on Cardiac Remodeling. Journal of the American College of Cardiology. 35 (3), 569-582 (2000).
- Migrino, R. Q., et al. End-systolic volume index at 90 to 180 minutes into reperfusion therapy for acute myocardial infarction is a strong predictor of early and late mortality. The Global Utilization of Streptokinase and t-PA for Occluded Coronary Arteries (GUSTO)-I Angiographic Investigators. Circulation. 96 (1), 116-121 (1997).
- White, H. D., et al. Left ventricular end-systolic volume as the major determinant of survival after recovery from myocardial infarction. Circulation. 76 (1), 44-51 (1987).
- Asgeirsson, D., et al. Longitudinal shortening remains the principal component of left ventricular pumping in patients with chronic myocardial infarction even when the absolute atrioventricular plane displacement is decreased. BMC Cardiovascular Disorders. 17 (1), 208(2017).
- Pfeffer, M. A., Lamas, G. A., Vaughan, D. E., Parisi, A. F., Braunwald, E. Effect of captopril on progressive ventricular dilatation after anterior myocardial infarction. New England Journal of Medicine. 319 (2), 80-86 (1988).
- McKay, R. G., et al. Left ventricular remodeling after myocardial infarction: a corollary to infarct expansion. Circulation. 74 (4), 693-702 (1986).
- Cung, T. T., et al. Cyclosporine before PCI in Patients with Acute Myocardial Infarction. New England Journal of Medicine. 373 (11), 1021-1031 (2015).
- Savoye, C., et al. Left ventricular remodeling after anterior wall acute myocardial infarction in modern clinical practice (from the REmodelage VEntriculaire [REVE] study group). American Journal of Cardiology. 98 (9), 1144-1149 (2006).
- Meris, A., et al. Left atrial remodelling in patients with myocardial infarction complicated by heart failure, left ventricular dysfunction, or both: the VALIANT Echo study. European Heart Journal. 30 (1), 56-65 (2009).
- Meyer, P., et al. Effects of right ventricular ejection fraction on outcomes in chronic systolic heart failure. Circulation. 121 (2), 252-258 (2010).
- Perrino, C., et al. Improving Translational Research in Sex-specific Effects of Comorbidities and Risk Factors in Ischemic Heart Disease and Cardioprotection: Position Paper and Recommendations of the ESC Working Group on Cellular Biology of the Heart. Cardiovascular Research. , (2020).
Reprints and Permissions
Request permission to reuse the text or figures of this JoVE article
Request Permission