This protocol describes how to perform optogenetic experiments for controlling gene expression with red and far-red light using PhyB and PIF3. Included are step-by-step instructions for building a simple and flexible illumination system, which enables the control of gene expression or other optogenetics with a computer.
Method Article
Building a Simple and Versatile Illumination System for Optogenetic Experiments
In This Article
Summary
Abstract
Controlling biological processes using light has increased the accuracy and speed with which researchers can manipulate many biological processes. Optical control allows for an unprecedented ability to dissect function and holds the potential for enabling novel genetic therapies. However, optogenetic experiments require adequate light sources with spatial, temporal, or intensity control, often a bottleneck for researchers. Here we detail how to build a low-cost and versatile LED illumination system that is easily customizable for different available optogenetic tools. This system is configurable for manual or computer control with adjustable LED intensity. We provide an illustrated step-by-step guide for building the circuit, making it computer-controlled, and constructing the LEDs. To facilitate the assembly of this device, we also discuss some basic soldering techniques and explain the circuitry used to control the LEDs. Using our open-source user interface, users can automate precise timing and pulsing of light on a personal computer (PC) or an inexpensive tablet. This automation makes the system useful for experiments that use LEDs to control genes, signaling pathways, and other cellular activities that span large time scales. For this protocol, no prior expertise in electronics is required to build all the parts needed or to use the illumination system to perform optogenetic experiments.
Introduction
Optogenetic tools are becoming ubiquitous and new technology is constantly being developed to optically control biological processes such as gene expression, cell signaling, and many more1,2,3. The ability to control cellular processes with light allows for fast kinetics, tight spatial control, and dose-dependent regulation that can be controlled by light intensity and exposure time. To use these tools, a device to control these parameters is necessary. We have recently developed a genetically encoded PhyB-PIF3 mammalian gene switch that reversibly activates and deactivates genes using red/far-red light, respectively4. This system was tested in several mammalian cell lines and enabled the unparalleled induction of gene expression even with very small amounts of light, including pulses of light. Researchers wishing to use the PhyB switch and similar tools5,6 frequently request information on methods to control illumination intensity and duration. Therefore, we developed this protocol with step-by-step instructions to enable broader adoption of these tools for optogenetics.
Before the widespread use of LEDs, broadband light sources with filters were used to study light-responsive proteins such as phytochromes7. Recently, some LED illumination systems have been published along with optogenetic tools8,9,10,11,12, but those protocols can require significant expertise in electronics/software, require specialized equipment (e.g., 3D printers, laser cutting machines, or photomasks), or do not provide the step-by-step instructions some researchers would need to deploy for their research needs. While independent control of individual wells in a multiwell plate can be useful, it is often unnecessary when researchers only need to compare several different samples in light and dark or red light versus far-red light. Also, many existing commercial systems are expensive, with limited customization capability. However, the LEDs described in this protocol are cost-effective, bright, and can be mounted in many ways; therefore, they can be used to illuminate several different types of samples. With the protocol and the software provided, LEDs ranging from ultraviolet (UV) to NIR can be used and controlled with software to perform optogenetic experiments using UVR813,14, Dronpa15,16, LOV domains17,18, Step Function Opsins19,20, CRY221,22, PhyB4,23,24,25, bacterial phytochromes26,27,28,29 and other light-responsive systems30,31,32.
This protocol constitutes a tutorial for the assembly of the circuits and other hardware needed to control different parameters for light stimulation as well as the molecular/cellular tools to run an optogenetic experiment. In addition, we report plasmids optimized from Kyriakakis et al.4 that are smaller and more stable for cloning. Through this protocol, biologists without expertise in electronics and optics can build illumination systems that are flexible and robust. In a step-by-step fashion, we show how to build LED systems, removing the technical bottleneck for the broader adoption of optogenetic tools. This system can easily be used in most cell culture incubators, even if they do not contain wire ports. For example, we have kept the LED system in a humidified CO2 incubator continuously for more than 6 months with no decrease in performance. We also explain how to connect the LED system to a computer and interface it with open-source software we provide on GitHub (https://github.com/BreakLiquid/LED-Control-User-Interfaces). Building a system using this protocol provides researchers the basic knowledge to debug potential issues, replace parts, and improve/extend functionalities.
System overview
Building the illumination system involves (1) building the electronic circuit, (2) building the peripherals (power supply cord, power switch, etc.), (3) building the LEDs, (4) assembling all of these components, and (5) installing the software to control the LEDs with a user interface (Figure 1A). Once completed, the illumination system can control up to four LEDs independently with a user interface (Figure 1B). The user interface enables each LED to pulse at specified time intervals and shut off after a specified time. There is also a start-delay to begin illumination programs at a specified time. Potentiometers (POTs) regulate each LED’s intensity independently or can be used for manual LED control without a computer. The wires to the LEDs can be any custom length, allowing them to be easily placed in an incubator or lab space. Due to these LEDs’ high power, they can be used to illuminate a large area with a single LED from a distance.
LED driver description
To power and control the LEDs' intensity, this protocol will go through steps to build an “LED driver”. Each LED has a range of voltages in which it operates (Figure 1C). During operation, the regulator's output voltage, which controls the light intensity, can be tuned by a potentiometer. The POT varies the resistance, adjusting the output voltage/brightness. Tuning with a 1kΩ (1 kilo-ohm) POT gives what we call the “high-voltage circuit” and has a range of 1.35 V to 2.9 V. Since 2.9 V is too high for operating the lower voltage LEDs (Figure 1C), we show a single modification (Resistor 3 or “R3” Supplementary Figure 1A) that limits the range to match the low voltage LEDs. R3 serves to decrease the maximum voltage applied to the LEDs to 1.85 V (assembly detailed in Supplementary Figure 8) when in parallel with the potentiometer. By using voltage to control brightness instead of current, the system is more flexible for LEDs with different operating voltages. Figure 1C contains a list of the high and low voltage LEDs to guide the optimal circuit selection. This design keeps the minimum voltage low enough so that the LED is completely off when the potentiometer is off and does not allow the voltage to go above the typical operating voltage of the LED. For PhyB optogenetics, we use deep red and far-red LEDs, which use the low-voltage circuit.
LED computer control system description
The LED illumination system can be used for constant illumination without a computer or microcontroller. However, for pulsing programs and for controlling individual LED timing, a microcontroller must be installed. To use a microcontroller to control the LEDs, a transistor is required to connect the microcontroller to the circuit. This transistor senses voltage from the microcontroller and switches from being conductive or insulating. To control the “on” and “off”, we use what is called an “NPN switching type transistor” (2N2222) as a controllable shunt across R2 (Supplementary Figure 1A). When the voltage from the microcontroller is applied to the transistor base, the transistor becomes conductive and makes the LED voltage low, turning the LED off. Thus, the LED and transistor on and off states are directly controlled by the microcontroller, which is controlled by the software installed on the PC.
For making the illumination system, the following steps are required: Build the electrical circuit; build the power supply, manual power switch, POTs, and microcontroller connection; build the LEDs; accommodate a black box to fit the illumination system; connect all of the wiring and devices; install the LED control software, stimulate the cells with light; measure gene expression using a dual luciferase assay.
Protocol
1. Build the electrical circuit
NOTE: The protocol for building a single circuit for an available LED is described here. Instructions to expand this up to four LEDs are included in the supplementary info.
- Turn on the smoke absorber and the soldering iron. Add water to the wiping sponge, have the solder at hand.
CAUTION: Make sure to take safety precautions to remove smoke and prevent burns. - Begin soldering circuit components to the printed circuit board (PCB board) in the order shown in the supplementary panels.
NOTE: Use a small amount of solder on the soldering iron tip to heat the metal of the component and the PCB board first and melt additional solder directly onto the components; flux can help a lot. - Solder jumper wires and components (Supplementary Figure 2 and Supplementary Figure 3).
- For the jumper wires (the insulated wiring that connects two points on the circuit board), use two pieces of orange [7.6 mm (0.3 inch)] and yellow [12 mm (0.4 inch)] wires from the jumper kit.
- Clip the PCB board onto the “helping hands” and insert the jumper wires in the following pinholes, bend the terminals 45 degrees and add flux (Figure 2, Supplementary Figure 2 and Supplementary Figure 3): a1 and a3 → ground (-) (orange), a7 → power supply (+) #7 (yellow), d2 → d6 (yellow).
- Solder and then trim the back of the wires.
- Insert LM317T voltage regulator in the following pinholes, bend the pins, and add flux (Figure 2 and Supplementary Figure 4): Adj → e5, Vout → e6, Vin → e7.
- Solder the left and right terminals first, trim them, then solder and trim the middle terminal.
- To set the low voltage range of the circuit, insert an 820 Ω resistor all the way down into pinholes, solder and trim c2 → c5 (Figure 2 and Supplementary Figure 5).
- To enable LED control by the microcontroller, insert the transistor into b3–b5 (Figure 2 and Supplementary Figure 6): Collector → b3, Base → b4, Emitter → b5.
NOTE: Be aware of the orientation of the transistor to insert correctly; check the specs to find the Collector, Base, and Emitter designation.
- Solder the wire-to-wire connectors for the POT, LED, microcontroller, and power source.
NOTE: Pay attention to the color of the wires of the wire-to-wire connectors and whether using a female or male wire-to-wire connector.- Determine whether a “low voltage” circuit or “high voltage” circuit is required for the desired LED (Figure 1C).
NOTE: If the LED is on the “low voltage” list, a resistor in parallel with the POT is required. - For the “low voltage” or “high voltage” circuit, place the wire from a female wire-to-wire connector through hole a5 (Supplementary Figure 7). Do not solder into place yet if making the low voltage circuit.
NOTE: Twist the bare wire ends so that the small wire hairs don’t flake out. If the wire seems too thick to push through the pinhole without fraying, cut 2–6 strands and then twist them back together (Supplementary Figure 7B–D). - If making the “high voltage” circuit, skip to step 1.4.5. If making the “low voltage” circuit, push a 560Ω resistor through the same hole (a5) and solder with the wire-to-wire connector lead.
- Connect the other end of the resistor to the ground (Supplementary Figure 7G).
- Insert the other end of the female wire-to-wire connector soldered into a5 hole connecting it to the ground and solder it (Supplementary Figure 8A,B).
- For the microcontroller connection, insert one end of a male wire-to-wire connector into hole a4 and the other into a hole connected to the ground (Supplementary Figure 9A–C).
- For the LED connection, insert one end of a female wire-to-wire connector into hole a2 and the other end into a hole connected to the ground (Supplementary Figure 9D,E).
- Determine whether a “low voltage” circuit or “high voltage” circuit is required for the desired LED (Figure 1C).
2. Build power supply, manual power switch, POTs, and microcontroller connection
- Build the power supply.
- Solder an orange [7.6 mm (0.3 inch)] jumper from a29 to the ground (Supplementary Figure 10).
- Solder a female wire-to-wire connector from a30 to the power supply (+) (Supplementary Figure 11A–C).
- Solder a male wire-to-wire connector from c29 to c30 (Supplementary Figure 11D–F).
- Cut the connector off a power supply cord, expose the wires, and strip them (Supplementary Figure 12A–C).
- Add flux to the wires prior to soldering using a flux pen (Supplementary Figure 3G).
- Place a 3.18 mm (1/8 inch) shrink tube around a male wire-to-wire connector and a thicker piece 4.76 mm (3/16 inch) over the power supply wire (Supplementary Figure 12D).
- Twist the wires from the power supply and the male wire-to-wire connector together and solder (Supplementary Figure 12E, 13A,B).
- Place the smaller diameter shrink tube 3.18 mm (1/8 inch) over the connections and shrink them with a heat gun (Supplementary Figure 13C,D).
- Place a larger diameter shrink tube 4.76 mm (3/16 inch) over the smaller shrink tube 3.18 mm (1/8 inch) and heat again (Supplementary Figure 13E,F).
- Build the manual power switch.
- Place the shrink tube 3.18 mm (1/8 inch) over the wires for the switch (Supplementary Figure 14A).
- Twist and solder the wires of a male wire-to-wire connector (Supplementary Figure 14B,C).
- Place the shrink tube 3.18 mm (1/8 inch) over soldered sections and shrink with a heat gun (Supplementary Figure 14D,E).
- Connect the male wire-to-wire connector to the POT.
- Loop the wire-to-wire connector's black wire around the middle terminal of the POT (Supplementary Figure 15B).
- Twist the wire that is looped tightly around the terminal and solder it (Supplementary Figure 15C).
NOTE: Small precision pliers can assist in making a tight twist. - Repeat with the red wire connection to the terminal, as in Supplementary Figure 15D.
- Use pliers to break the metal tab near the red arrow (Supplementary Figure 15E,F).
- Build the microcontroller connection (only necessary for computer-controlled LEDs).
- If making a LED driver for more than one LED, cut off the black wires from all but one female wire-to-wire connector (Supplementary Figure 16A).
- Crimp the ends of the wire-to-wire connectors, as shown (Supplementary Figure 16B–D).
- Push the crimped ends through the rectangular connector (Supplementary Figure 16E).
3. Build the LEDs
- Strip the wire ends (~5 mm) and apply flux using a flux pen as in Supplementary Figure 3G.
NOTE: To efficiently solder the wires onto the LED base, flux must be added to the contacts on the LED base and the wires. - Tin the wire by heating the wire from below and adding solder from the top (Supplementary Figure 17B).
- Use the flux pen to place flux onto the surface contact of the LED base (Supplementary Figure 17C).
- Place a generous amount of solder onto a large soldering tip (~4–5 mm) (Supplementary Figure 17D), use it to heat the LED base at the contact (Supplementary Figure 17E). After a few seconds, drag the solder across the contact (Supplementary Figure 17F). Repeat steps 3.3–3.4 on the other contact (Supplementary Figure 17G).
CAUTION: The LED base can get very hot during soldering. Place the LED base on a surface that will not melt or burn. - Clip the black wire onto the contact “C+” (the cathode) using the hair clips (Supplementary Figure 18A).
- Place a generous amount of solder onto the large soldering tip (Supplementary Figure 18B) and press it down on the wire until the solder on the LED base melts (Supplementary Figure 18C). Hold down the wire (Supplementary Figure 18D) and remove the soldering iron while holding the wire in place (Supplementary Figure 18E).
- Place a small amount of solder paste onto the pads for the LED connections (Supplementary Figure 19A,B) and place the LED over the pads using forceps (Supplementary Figure 19C).
NOTE: If the placement is a little off, it is okay; it will go into place once the solder paste melts. - Hold the red wire on the “A+” (anode) and clip it with a hair clip (Supplementary Figure 20A–C).
- Place a generous amount of solder onto the large soldering tip (Supplementary Figure 20D) and press it down onto the wire until the solder on the LED base and the solder paste under the LED melts (Supplementary Figure 20E).
NOTE: After the solder paste melts, the color becomes silver (Supplementary Figure 20H,I). - Choose the length of the wire needed for the desired set up. Strip the LED wires, and a male wire-to-wire connector (Supplementary Figure 21A) then add flux as in Supplementary Figure 3G.
- Place the shrink tube over the wires. Use a 3.18 mm (1/8 inch) shrink tube over the wire-to-wire connectors and a 4.76 mm (3/16 inch) shrink tube over the wire (Supplementary Figure 21B).
- Clip the wire-to-wire connector with a “helping hands” and twist the connector end with the wire (Supplementary Figure 21C) and solder them. Repeat with the other wire (Supplementary Figure 21D,E).
- Place the 3.18 mm (1/8 inch) shrink tubes over the solder and shrink (Supplementary Figure 21F–G).
- Place the 4.76 mm (3/16 inch) shrink tube over the 3.18 mm (1/8 inch) shrink tube and shrink (Supplementary Figure 21H–I).
- Clip the LED wires the “helping hands” with tape under it (Supplementary Figure 22A).
- Mix epoxy according to the manufacturer’s instructions and spread over the top of the soldered LED (Supplementary Figure 22B). Leave overnight to cure.
- If mounting using a touch fastener, cut a small piece of the touch fastener (Supplementary Figure 23A) and press it against the back of the LED for 30 s.
- Use a high-speed rotary tool to make a notch on the lid of a black box (Supplementary Figure 23C–E).
- Build a mounting for a single LED through a privacy film.
- Using the spade drill bit, drill a 1.75 cm (11/16 inch) hole through the top of a black box where the LED will be placed (Supplementary Figure 24A).
- Using a high-speed rotary tool, make a notch on one side of the hole to make room for the LED wire, as shown in Supplementary Figure 24A.
- Cut a piece of privacy film (25–30 mm) and tape onto the inside of the black box covering the hole that the LED will illuminate through (Supplementary Figure 24A).
- Place the LED outside the black box on top of the hole with privacy film and tape in place with electrical tape (Supplementary Figure 24B–E).
4. Accommodate a black box to fit the illumination system
- For a four LED system, drill four 0.83 cm (21/64 inch) holes on the lid 3.81 cm (1.5 inch) apart where the potentiometers will be attached (Supplementary Figure 25).
- Using a high-speed rotary tool, cut a 1.19 cm x 1.90 cm (0.47 inch x 0.75 inch) rectangular hole in the top-left corner (Supplementary Figure 25).
- Using the spade drill bit, drill a 1.75 cm (11/16 inch) hole on the black box (Supplementary Figure 26).
- File the holes and insert the grommet into the hole drilled in (Supplementary Figure 26).
- For the computer-controlled LEDs, sandpaper the area where the microcontroller will be glued in a black box, as well as the bottom side of the microcontroller holder.
- Snap the microcontroller onto the holder before securing the holder in the black box and then epoxy them in place (Supplementary Figure 27A).
- Use sandpaper to sand the bottom of two clips and the area in a black box where the circuit will be placed and secure the clips inside the black box with the epoxy (Supplementary Figure 27A).
- Secure the PCB board into clips (Supplementary Figure 27B).
- Push the power switch through the square hole in the lid made in Supplementary Figure 25 and snap it into place (Supplementary Figure 28A).
- Push the POTs through the holes on the lid, screw into place (Supplementary Figure 28A), and put the knob onto the POT (Supplementary Figure 28B).
5. Connect all of the wiring and devices
- Label the wire-to-wire connectors (e.g., LED, POT, COM) (Supplementary Figure 29A).
- Attach the crimped connectors made in step 2.4 (Supplementary Figure 16) to the male wire-to-wire connector between the two female connectors (POT and LED) (Supplementary Figures 7A and S37).
- Connect the crimped ends into the microcontroller (Supplementary Figure 30).
- Pull the USB cable through the grommet and plug it into the microcontroller.
- Pull the wires for the LEDs through the grommet and connect to the female wire-to-wire connector on the left of the microcontroller connection (Supplementary Figures 9D and 38).
- Pull the wire for the power supply through the grommet and connect it to the male wire-to-wire connector on the right side of the PCB board (Supplementary Figure 11D).
- Connect the male wire-to-wire connector from the power switch to the female wire-to-wire connector on the right of the PCB board (Supplementary Figure 11A).
- Connect the male wire-to-wire connectors from the POTs on the lid to the female wire-to-wire connectors on the PCB board (Supplementary Figures 8 and 36).
NOTE: Do not turn on the circuit without the potentiometers connected.
6. Install the LED control software
NOTE: See the detailed Software Installation Instructions in the supplementary file on Github. https://github.com/BreakLiquid/LED-Control-User-Interfaces
- Download and install the software for programming the microcontroller
- Download and install the package manager.
- Program the microcontroller.
- Download and install the runtime engine.
- Download the user interface.
7. Stimulate the cells with light
- Transfect HEK293 cells.
- Plate HEK293 cells at 100k cells per well in a 24-well plate.
- Use the example table to calculate serum-free media, Polyethylenimine (PEI), and DNA volumes (Supplementary Figure 39) and transfect using the manufacturer’s protocol.
- Stimulating cells with light.
NOTE: Cells must be kept in the dark after transfection or handled using a light source that does not excite the optogenetic system.- Decide what type of stimulation will be used on the cells (continuous light, pulsing intensity, etc.).
- With the POTs turned off (counterclockwise), turn on the LED power supply.
- Place a light meter inside the black box where the cells will be placed and place the lid with the LED over the meter. Adjust the light intensity as needed.
- If using the computer to control the LEDs, open the user interface software.
- Program the user interface (Figure 5A,B).
- On the top left panel, select the COM port for the microcontroller and click on Connect.
- Use the panels on the right to program each LED. For continuous light, select any time except for zero in the “Time On” and set the “Time Off” to zero.
- On the bottom right panel, program the main timing control.
- To delay illumination, select a start delay (HH:MM).
- To shut off all LEDs after a designated time, select a run time (HH:MM).
- Start the illumination program by clicking on the Run button (Figure 5A).
8. Measure gene expression using a dual luciferase assay
- Prepare luciferase reagent by mixing 10 mL of luciferase buffer with luciferase reagent and aliquot in 1 mL tubes to be stored at -80 °C for up to 1 year.
- Prepare lysis buffer 5x into 1x for 100 µL for N + 2 wells. e.g., for 30 samples, 30 x 20 µL of 5X lysis buffer, and 30 x 80 µL of MQ H2O.
- Prepare Renilla substrate solution: 20 µL of Renilla substrate for 1 mL of Renilla buffer (this amount is suitable for 10 assays).
- Remove cells from the incubator, aspirate the media, add 100 µL of 1x lysis buffer per well and place it on a shaker at 100 RPM for 15 min.
- Place in -20 °C for at least 1 h.
- Add 100 µL of luciferase reagent per sample into a well of a white 96-well plate.
- Set up the plate reader for luminescence. Using the luminometer module of the plate reader, set the integration for 1 s.
- Add thawed lysates in wells below the luciferase reagent. Using a multichannel pipette, mix 20 µL of sample into the luciferase reagent and measure luminescence immediately.
- After the readings plateau, add 100 µL of Renilla substrate solution and scan again.
- Divide the Luciferase signal by the Renilla signal to account for transfection efficiency.
- Compare luciferase signals normalized for transfection efficiency (e.g., compare the signal from red light illuminated and far-red light illuminated samples).
Results
Once the power circuit, power supply, power switch, the POTs, and an LED is assembled (up to Supplementary Figure 21), the circuit can be tested. With all the POTs in place, the POT will control the LED intensity. Once assembly is completed up to Supplementary Figure 29, the system can be used manually for optogenetics or other applications. The entire system power can be manually controlled with the power switch. The intensity of each LED can be controlled independently using the POT connected to each circuit.
After installing the software and programming the microcontroller, the user interface can communicate with the microcontroller. With the user interface, the LEDs can be controlled temporally in several ways: (1) each LED can be programmed to stay on for a specified time, (2) each LED can be programmed to pulse, (3) a global start delay (e.g., when transfecting and shining light 24 h later) can be programmed (Figure 6B), (4) the total time for the program to run after the delay. There are two User Interfaces, one with larger buttons that can control two LEDs at a time and another that can control four LEDs (Figure 5A,B). The two LED User Interface is optimized for tablets and is sufficient to control red and far-red LEDs for many experiments.
For larger experiments, the second user interface can be used to control up to four LEDs. When inducing gene expression, the anticipated result depends on several parameters. These include induction time, induction levels (e.g., amount of light or drug), and copy number of the inducible construct in the cell. To show this, we transfected the PhyB gene switch along with different amounts of reporter DNA (pPK-202) (0.5%, 1%, 2%, 4%, and 8% of the transfected DNA) (Figure 6A) and illuminated as shown in Figure 6B. In samples containing PhyB, but no plasmid to produce phycocyanobilin (PCB-chromophore) (i.e., unresponsive to light), luciferase gene expression/leakiness increases with the amount of reporter DNA (Figure 6C) (Far-red P < 0.0001, Linear regression followed by a Wald test), (Red P < 0.0001, Linear regression followed by a Wald test). In addition, when the entire PhyB gene switch, including the PCB-chromophore producing plasmid (light-sensitive cells), are illuminated for Far-red light, Luciferase expression also increases with the increasing reporter construct amounts in the transfection mix (Figure 6C,D) (Far-red light P < 0.0001, Linear regression followed by a Wald test). Similarly, when the light-sensitive cells are illuminated with red light, luciferase expression also increases with increased reporter amount (P < 0.0001, Linear regression followed by a Wald test). When comparing induction levels of the red light treated cells to the far-red light treated cells, we found a small decrease in the fold activation with increasing reporter amount (Figure 6E) (P = 0.0141, Linear regression followed by a Wald test).
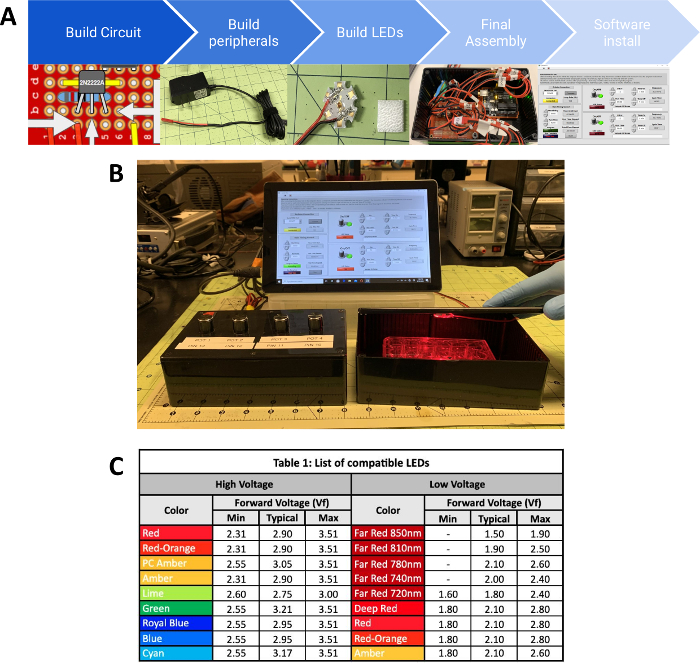
Figure 1: A basic circuit for a single LED. (A) A flow chart showing an overview of the steps needed to build the LED illumination system. (B) The LED illumination control system. (left) Control box for regulating LED intensity and timing. (middle) A PC tablet running user interface for controlling LEDs. (right) A black box for mounting LEDs and placing cells for optical stimulation. (C) Table for determining whether the LED requires a high or low voltage circuit. Please click here to view a larger version of this figure.
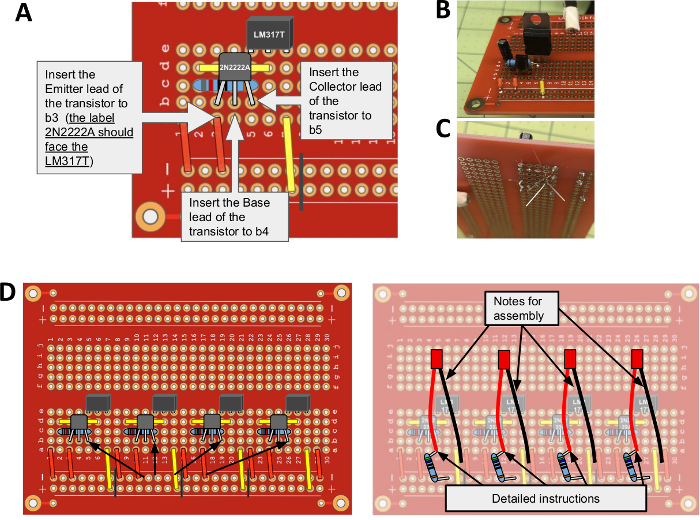
Figure 2: Instructions for soldering the components into place. (A) An example of the step-by-step cartoon instructions for building the circuit. (B,C) Example instructions with pictures of the device being assembled. (D) Example instructions for assembling multiple circuits simultaneously. Please click here to view a larger version of this figure.
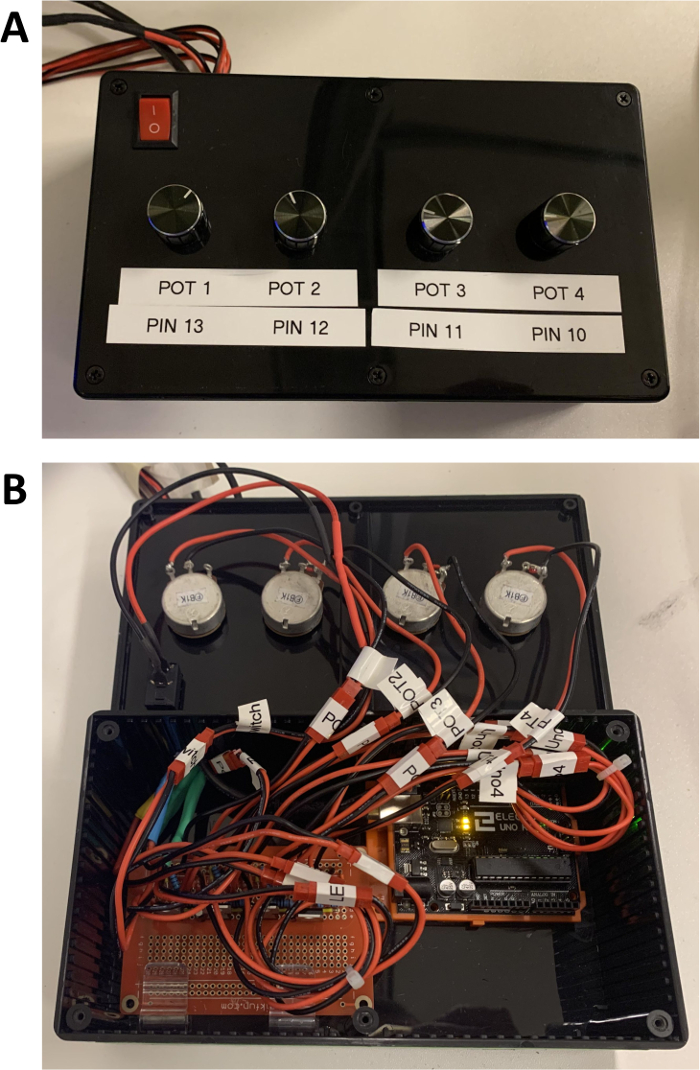
Figure 3: Views of an assembled LED control system. (A) A top outside view of the assembled system. (B) An inside view of an assembled four LED illumination system. Please click here to view a larger version of this figure.
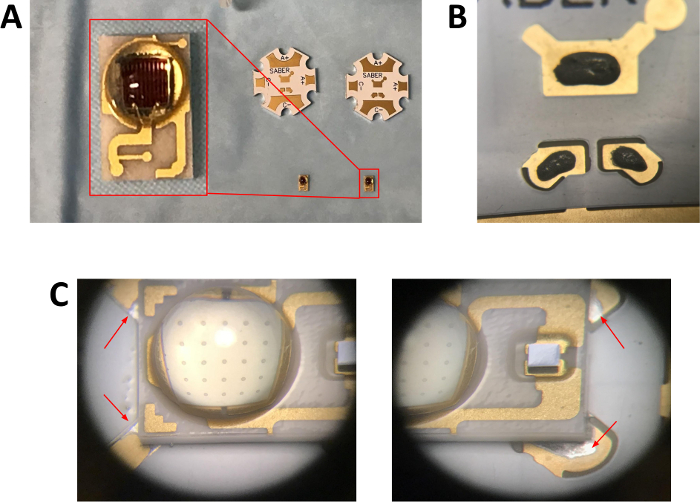
Figure 4: Instructions for reflow soldering the LED onto the heat sink. (A) The LED base and a close up of a deep red LED. (B) Placement of solder paste onto the LED base. (C) Picture of soldered LED. Red arrows point to soldering pads. Compared to gray before soldering (A), after soldering, the solder appears metallic/shiny. Please click here to view a larger version of this figure.
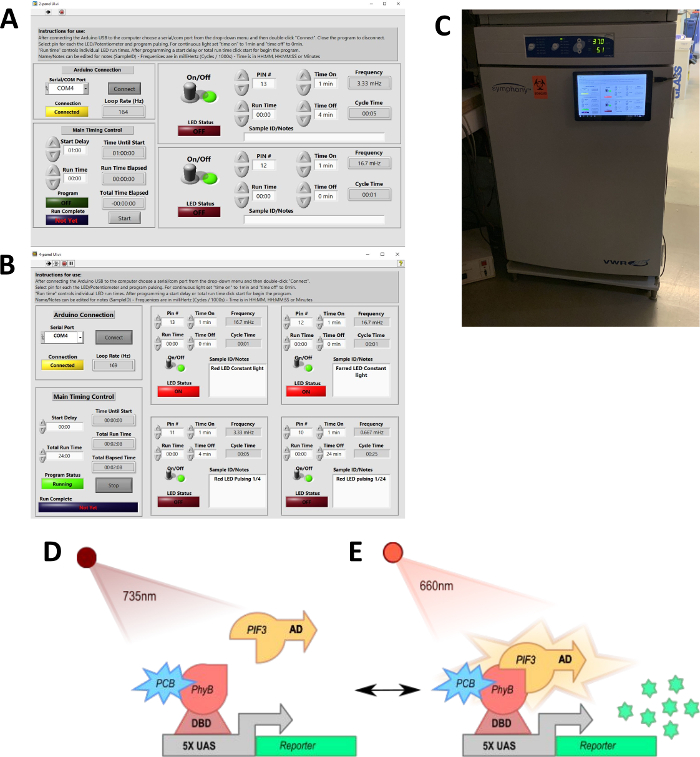
Figure 5: Software for controlling optogenetic experiments. (A) A two LED user interface with large buttons for easy use with an inexpensive tablet. (B) A four LED User Interface. Both interfaces allow independent LED control. For pulsing, LEDs can be programmed to turn on and off for specific pulse widths and specified durations. The pulsing can also have a start delay and a predetermined total run time. (C) The LED control tablet mounted onto a cell culture incubator. (D) Illustration of the PhyB gene system when illuminated with far-red light. Far-red light keeps the gene in the “off” or “dark” state. (E) Illustration of the PhyB gene system when illuminated with red light. Red light induces gene expression by promoting the interaction between PhyB and PIF3. This interaction localizes the gene activation domain (AD) fused to PIF3 to the UAS promoter, activating the reporter gene. Please click here to view a larger version of this figure.

Figure 6: Anticipated results using the LED system to control PhyB. (A) A plasmid encoding PhyB+PIF3 two-hybrid partners (pPK-351), a plasmid encoding phycocyanobilin (PCB-chromophore) synthesis enzymes (pPK-352), and a Luciferase reporter plasmid (pPK-202). (B) Timeline of light induction experiments for C–E. (C) Basal transcription levels (AKA leakiness) with increasing amounts of reporter DNA. “Leak” samples are not transfected with pPK-352 (i.e., unresponsive to light), but are illuminated with red or far-red light. Light Switch (LS) samples include all light-gene switch plasmids and are illuminated with red or far-red light. (D) Light induction levels in response to red and far-red light. (LS-Far-red light is the same data in C and D.) (E) Fold induction of luciferase in cells illuminated with red light/far-red light. Please click here to view a larger version of this figure.
Please click here to download Supplementary Figures 1-39.
Supplementary Figure 1: Electronic Driver Circuit for multiple LEDs. (A) The circuit diagram for a single LED system. (B) The circuit diagram for a four LED system.
Supplementary Figure 2: Placing the circuit Interconnections. (A) Clip your PCB board onto your helping hands. (B) Position of main circuit jumpers into the through holes in the picture. (C) Diagram of wire connectors mapping the coordinates. For the four LED systems, draw lines dividing each circuit as shown (black vertical lines). Supplementary Figure 31–38 describe the assembly of four circuits simultaneously.
Supplementary Figure 3: Soldering the wires onto the PCB. (A) Bend jumpers so that they make direct contact with the PCB and stay in place while soldering. (B) Another view of the bent wires. (C) Wires after soldering. (D) Trimmed wires on the PCB. (E) Shrunken insulation after heating with solder. (F) Moving the insulation into position to cover the ground through-hole (blue arrow) (G) Adding flux to a wire end or terminal.
Supplementary Figure 4: Soldering the voltage regulator into place. (A) Map of the voltage regulator coordinates. (B) Placement of the voltage regulator. (C) Bent voltage regulator leads. (D) Voltage regulator terminals after soldering.
Supplementary Figure 5: Soldering the R1 resistor into place. (A) Map of the R1 resistor (820Ω) coordinates. (B) Pulling the resistor through by the lead using pliers (C) The pulled resistor close to PCB. (D) The soldered resistor close to PCB.
Supplementary Figure 6: Soldering the transistor into place. (A) Map of the transistor coordinates and orientation. (B) Note the orientation of the transistor; the label in this model is facing the voltage regulator (LM317T). Double-check the specification of the transistor to make sure the “Emitter”, “Base”, and “Collector” are in the correct holes. (C) The transistor with the terminals bent before soldering.
Supplementary Figure 7: Soldering the wire-to-wire connector for the potentiometer into place (plus a 560Ω resistor for the low voltage circuit). (A) Map of the coordinates of the wire-to-wire connector (plus the R3-560Ω if building the low voltage circuit, the wire-to-wire connector is placed in the hole before the resistor). (B) A female wire-to-wire connector. (C) To facilitate fitting the resistor and the wire-to-wire connector into the through-hole, 3–5 strands of the braided wire are bent. (D) The strands are cut off with wire cutters as close to the insulation as possible. (E) Inserted red wire of a female wire-to-wire connector through the a5 through hole (for the low voltage circuit insert R3 through the same through hole). (F) Underside view of the resistor and wire-to-wire connector before soldering. (G) Image of the soldered R3 resistor connected to the ground (F = Female).
Supplementary Figure 8: Soldering the wire-to-wire connector for the potentiometer to the ground. (A) Map of the coordinates of the ground connection for the potentiometer wire-to-wire connector. (B) Top view of the potentiometer wire-to-wire connector in parallel with R3 (F = Female).
Supplementary Figure 9: Soldering the microcontroller and LED wire-to-wire connectors. (A) Map of the coordinates of the wire-to-wire connector for connecting the 2N222A and the ground to the microcontroller. (B) Soldered male wire-to-wire connector. (C) Top view of (B). (D) Map of the female wire-to-wire connector coordinates for connecting the input of the circuit and ground to the LED. (E) Soldered female wire-to-wire connector (F = Female, M = Male).
Supplementary Figure 10: Soldering the jumper for the power supply circuit. (A) Map of the coordinates of the orange jumper for connecting the power supply to the ground. (B) The orange jumper soldered in place. (C) The underside view of the jumper soldered in place.
Supplementary Figure 11: Soldering the power switch and power source wire-to-wire connectors. (A) Map of the coordinates of the female wire-to-wire connector for connecting the power switch. (B) The female wire-to-wire connector soldered in place. (C) Another view of (B). (D) Map of the coordinates of the male wire-to-wire connector for connecting the power source. (E) Soldered male wire-to-wire connector. (F) Another view of (E) (F = Female, M = Male).
Supplementary Figure 12: Connecting the power supply to a male wire-to-wire connector. (A) The unmodified power supply. (B) Cutting off the power supply wires. (C) The power supply wires stripped and with excess insulation cut away. (D) Placement of shrink tube around power supply wires. Tubing separating the two connections (red arrows) and tubing to hold the separated wires (yellow arrow). (E) Twisted wires connecting the power supply to the female wire-to-wire connector.
Supplementary Figure 13: Soldering and insulating the power supply connection to a male wire-to-wire connector. (A) The soldered connection between the power supply ground and a female wire-to-wire connector. (B) The soldered connection between the positive terminal of the power supply and a female wire-to-wire connector. (C) Shrink tube pulled over the soldered individual connections (red arrow). (D) Both power supply connections soldered and with heat-treated shrink tube. (E) Placement of shrink tube over individual connections (yellow arrow). (F) Completed power supply.
Supplementary Figure 14: Soldering the power switch to a male wire-to-wire connector. (A) Power switch with stripped wires and shrink tube placed over the wires (red arrows). (B) Wires connecting the switch and male wire-to-wire connector twisted together before soldering. (C) Placing the shrink tube over the soldered connections. (D) Connections covered with the heat-treated shrink tube. (E) A power switch assembled with a male wire-to-wire connector.
Supplementary Figure 15: Wiring a potentiometer to a male wire-to-wire connector. (A) The potentiometer parts. (B) A male wire-to-wire connector twisted and bent to hook around the middle terminal of the potentiometer. (C) A male wire-to-wire connector twisted around the middle terminal of the potentiometer. (D) Soldered wire-to-wire connections. (E) Red arrow pointing to the metal tab before removal. (F) The potentiometer after metal tab removal.
Supplementary Figure 16: Wiring the microcontroller connection. (A) Wires for female wire-to-wire connectors stripped and cut in preparation for crimping. (B) Placement of the crimp on the wire-to-wire connector. (C) Crimping of the wire-to-wire connector. (D) Crimped wire-to-wire connector. (E) Fully assembled microcontroller connection.
Supplementary Figure 17: Soldering wires and LED onto the LED base Part 1. (A) Materials needed to solder the LED to the LED base. (B) Tinning the tip of the stripped wire. (C) Applying flux onto the contact of the LED base. (D) Adding solder to the large soldering tip to tinning the LED base. (E) Placement of solder onto the contact to heat the LED base. (F) The LED base after dragging the soldering tip across the contact. (G) The same procedure on the other contact.
Supplementary Figure 18: Soldering wires and LED onto the LED base Part 2. (A) A tinned wire clipped to the contact using a hair clip. Note that the black wire is soldered to the cathode “C-”. (B) Addition of a generous amount of solder to the soldering tip. (C) The soldering tip pressing down on the wire, melting the solder on the LED base and the wire. (D) Holding down the wire so that it stays put when the soldering iron is removed. (E) Holding the wire in place until the solder hardens.
Supplementary Figure 19: Soldering wires and LED onto the LED base Part 3. (A) Using a sharp tip to place solder paste onto the LED base for mounting the LED. (B) The LED base with the soldering paste in place. (C) Placement of the LED onto the LED base such that the contacts of the LED and LED base match.
Supplementary Figure 20: Soldering wires and LED onto the LED base Part 4. (A) The black wire still clipped to the contact by the hair clip. (B,C) Using a second hair clip, the red wire is held into place. Note that the red wire is soldered to the anode “A+”. (D) Addition of a generous amount of solder to the soldering tip. (E) The soldering tip pressing down on the wire, melting the solder on the LED base and the wire as well as the solder paste under the LED. (F) The hot LED base cooling after soldering. (G) The LED base with the wires and LED soldered on. (H,I) Red arrows point to soldering pads. After soldering, the solder appears metallic/shiny (compared to gray before soldering (Supplementary Figure 16D)).
Supplementary Figure 21: Connecting the LED wire to a male wire-to-wire connector. (A) Stripped wires and male wire-to-wire connector next to the shrink tube cut in half (1/8 inch and 3/16 inch). (B) Shrink tube placement over the wires before soldering. (C) Wires twisted together before soldering. (D) The soldered connection from the wire to the wire-to-wire connector. (E) Both the red and black wires soldered together. (F) Placement of the 1/8 inch shrink tube over the soldered connection. (G) The shrink tube after shrinking with the heat gun. (H) Placement of the 3/16 inch shrink tube over the smaller shrink tube. (I) The connection soldered and sealed with the shrink tube.
Supplementary Figure 22: Securing the wires and LEDs to the LED base using epoxy. (A) Using a wooden applicator to place epoxy into the LED base. A tape is placed below to catch any dripping epoxy. (B) Epoxy is spread evenly over the entire surface. (C) The LED is left overnight to cure.
Supplementary Figure 23: Mounting LEDs inside a box lid. (A) An LED with a touch fastener piece attached for easy mounting. (B) Different color LEDs mounted on the inside of a black box using a touch fastener. (C) A notch on the black box's lid made by a high-speed rotary tool to make room for the LED wire. (D) A black box for stimulating the cells with touch fasteners for mounting the LED. (E) Placement of a multiwell dish inside of the touch fastener version of the LED box.
Supplementary Figure 24: Mounting LEDs outside a box lid. (A) Hole drilled into the black box's lid with a notch from the high-speed rotary tool to make room for the wire (red arrow). (B) LED placed into the hole with the wire in the notch, held in place with electrical tape. (C) Two more pieces of tape are used to secure the LED. The backside of the heat sink is exposed to maximize heat exchange. (D) Privacy film taped over the hole where the LED will be placed. The red arrow points to the privacy film. (E) A black box for stimulating the cells with an LED mounted outside the box and with privacy film for diffusing the illumination. (F) Placement of a multiwell dish inside of the external LED + privacy film version of the LED box.
Supplementary Figure 25: Drilling holes on the box lid for the power switch and potentiometers. (A) A CAD drawing with annotated dimensions of the box lid. (B) The box lid with the potentiometer and power switch holes.
Supplementary Figure 26: Preparing the wire outlet hole. (A) A CAD drawing with annotated dimensions. (B) Image of the drilled hole with the drill bit. (C) Smoothing of outlet hole with high-speed rotary tool or filing tool. (D) Placing grommet in outlet hole.
Supplementary Figure 27: Placement of the microcontroller and the PCB in the box. (A) The microcontroller holder (orange) and PCB holders inside the box. (B) The microcontroller and PCB secured into the box.
Supplementary Figure 28: Placement of the potentiometers and the power switch. (A) A front view of a box lid with a power switch and four POTs. (B) A front view of the box lid with potentiometer knobs added. (C) A rear view of the box lid with the attached components.
Supplementary Figure 29: The assembled LED control system. (A) An open control box with the wires labeled with a label printer and zip tied for organization. (B) The box once it is fully assembled with each POT labeled along with the PIN.
Supplementary Figure 30: Placement of the crimped wire-to-wire connector. (A) Picture of the crimped wire-to-wire connectors for a four LED-microcontroller system. (B) Placement of the crimped connector into the microcontroller ports.
Supplementary Figure 31: Placing the jumper wires. (A) A circuit board with the coordinates of the red jumper wires labeled. (B) A circuit board with the coordinates of the yellow jumper wires labeled.
Supplementary Figure 32: Placing the jumper wires. A circuit board displaying coordinates of the yellow jumper wires.
Supplementary Figure 33: Adding the voltage regulators. The LM317T voltage regulators are added to the circuit with their coordinates labeled in the diagrams.
Supplementary Figure 34: Inserting the 820Ω resistors. The R1 resistors are added to the circuit with their coordinates labeled in the diagrams.
Supplementary Figure 35: Inserting the transistors. The 2N2222A transistors are added to the circuit with their coordinates labeled in the diagrams.
Supplementary Figure 36: Inserting the Female wire-to-wire connectors and Resistors (optional) for the POT connection. The wires and resistors are added to the circuit with their coordinates labeled in the diagrams. (A) Insert the red wire, followed by the R2 resistor (560Ω) (for the low voltage circuit only). (B) Insert the other end of the resistor into the indicated ground hole. (C) Insert the black wires into the marked holes to connect to ground. Note: R2 (560Ω) is parallel to the potentiometer.
Supplementary Figure 37: Inserting male wire-to-wire connectors for the microcontroller connection and power supply. The wires are added to the circuit with their coordinates labeled in the diagrams. (A) Insert the red wires into the indicated holes. (B) Insert the black wires into the marked holes.
Supplementary Figure 38: Adding LED wire-to-wire connectors. (A) Female wire-to-wire connectors with the red lead coordinates highlighted. (B) Female wire-to-wire connector with the black lead coordinates highlighted.
Supplementary Figure 39: Setting up a PhyB-PIF3 gene switch experiment. (A) An example table of a master mix containing Renilla for the internal control. (B) An example table for setting up the DNA mixture for a Dual-Luciferase Reporter Assay of a PhyB-PIF3 optogenetic experiment. (C) An example table for setting up PEI transfection reagent and aliquoting the mixture onto cells (dropwise). (D) Placement of the light meter for setting the LED brightness.
Discussion
The LED system described here has been used in our lab to optimize, characterize, and work with several optogenetic tools. In Kyriakakis et al.4, we tested many combinations of PhyB-PIF gene switches in parallel. We then used this system to test pulses of light at different frequencies to measure the gene switch kinetics and effective light intensity. This system was also used to optimize and characterize two optogenetic systems that use blue light for stimulation5,6. Since only one LED needed to be bright enough to activate most optogenetic tools, buying a system with large numbers of LEDs over each well is not always necessary. This setup is inexpensive, reliable, easy to reconfigure, and requires no prior electrical expertise to follow the assembly protocol.
In the supplementary Supplementary Figures 31–38, we describe how to incorporate up to four LEDs into the system. While this may limit some experiments requiring a large number of parallel conditions, more LEDs can be added by replacing the 9 Volt power supply used in this protocol with a higher wattage one. Similarly, several lower power LEDs can be connected in parallel to each circuit. In this latter arrangement, some LEDs will not be controlled individually, but this can be useful when many LEDs are required to cover a larger area. Once familiar with the electronics of this system, there are many ways to customize it. Additional strategies for customizing the system include placing the LED farther or closer to the sample and illuminating through filters/diffusers for homogenous illumination conditions or to prevent heating as in (Supplementary Figure 23) and Allen et al.5. Another notable feature of our LED design is that it is encapsulated in epoxy and has a touch fastener on the back; this allows the LED to be securely placed with ease virtually anywhere: in incubators, fish tanks, animal cages, walls, etc.
Many experiments that use optogenetics to control genes, signaling pathways, and other cellular activity often require pulsing, span large time scales, or need to be performed in an incubator, therefore requiring automatization or remote manipulation without a microscope. This LED system has been tested continuously for several months inside a humidified CO2 incubator without any issues. Additionally, with reversible systems such as PhyB optogenetic systems, the experimenter may need to program-specific pulsing illumination schedules. In our previous work4, we used pulsing programs to test the reversibility dynamics of a PhyB-PIF3 switch in mammalian cells through the user interface. Using the methodology described in this manuscript, programming a pulsing protocol is easy, providing the flexibility and autonomy needed for many types of optogenetic experiments in a user-friendly manner.
The most critical steps in building this system include putting together the electrical circuit on the PCB board and connecting the components, which are detailed in section 1 and section 2. It is essential to carefully follow each step in these sections and double-check the pinhole numbers line-by-line before soldering each component. Section 2 explains how to set up the components that will be connected to the circuit. So that the components connect in the correct orientation, it is particularly important to ensure that the colors of the black and red wires on the wire-to-wire connectors match. Small oversights in these two sections will very likely affect the system’s functionality. Indeed, the first step in troubleshooting this method will be to check that the circuit was built correctly and that all the connections are in place. Secondly, checking the soldering quality for loose connections and the wires for flaring wirehairs that may be shorting the circuit is of particular importance. A third step would be to ensure that the LEDs are working correctly, which can be done using a power supply or a 1.5 V battery by clipping the LED's two terminals with alligator clips. Another potentially critical consideration is to prevent heating (when using the LEDs at high power) or diffusing the light for wider spread illumination. To address these considerations, the LEDs can be mounted outside of a black box with “privacy film” on the inside, as described in Supplementary Figure 23 and Allen et al.5. Because of the simplicity of this system, taking it apart to verify, modify, upgrade, or repair modular components is not difficult.
Another critical factor for inducible gene systems is to consider how much activation is required or how much leakiness is acceptable for the biological system being controlled. As shown in Figure 6, these can vary with the amount of reporter DNA. In addition, the transfection efficiency and, therefore, the copy number of reporter constructs in each cell will vary. It may be advantageous for some experiments to make a cell line with a fixed amount of reporter or PhyB gene-switch components and screen for clones with the desired range of induced expression, as is commonly done with drug inducible systems. Due to the size and instability of lentiviral plasmid pPK-2304, we also made non-lentiviral plasmid versions of the PhyB switch in the pcDNA backbone pPK-351 (Addgene #157921) and pPK-352 (Addgene #157922).
By building this LED illumination system following this protocol, users have all the components necessary to perform a wide array of optogenetics experiments in vitro and in vivo. Combined with the instructions for using PhyB-PIF3 in mammalian cells, this protocol will allow non-engineers and biologists to, flexibly and effectively, use PhyB-based optogenetics in a variety of contexts.
Disclosures
The authors have no conflicts of interest to disclose.
Acknowledgements
We would like to thank Yingxiao (Peter) Wang, Ziliang Huang, and Molly Allen for testing out different versions of the LED system as it was being developed. This work was supported by the Kavli Institute for Brain and Mind at UC San Diego and the Salk Institute, National Science Foundation through the NSF Center for Science of Information under Grant CCF-0939370, NIH Grant NS060847, and NIH Grant R21DC018237.
Materials
| Name | Company | Catalog Number | Comments |
|---|---|---|---|
| 18AWG 2pin RED Black wire | Amazon | 15M-28AWG-2468 | Inexpensive wire to connect LEDs to the power circuit. https://www.amazon.com/gp/product/B072KGYH1M/ref=oh_aui_detailpage_o05_s00?ie=UTF8&psc=1 |
| 1K Ohm potentiometer | Amazon | 52161500 | 2 x 1K Ohm potentiometer potential + 2 x black control Knob. https://www.amazon.com/gp/product/B00XIWA2GO/ref=oh_aui_detailpage_o00_s00?ie=UTF8&psc=1 |
| 20 Gauge Silicone JST Connector | Amazon | SIM&NAT 5.9 inch 2 Pin Male Female JST RCY Plug Connectors | These are very common and there are many equivalents. https://www.amazon.com/gp/product/B071XN7C43/ref=oh_aui_detailpage_o00_s01?ie=UTF8&psc=1 |
| 22 AWG solid jumper wires | Amazon | WJW-60B-R | Jameco Valuepro WJW-60B-R Wire Jumper Kit 350 each 22 AWG, 14 Lengths 10 Colors 25 Of Each Length. https://www.amazon.com/Jameco-Valuepro-WJW-60B-R-Jumper-Lengths/dp/B01KHWEB3W/ref=sr_1_5?s=industrial&ie=UTF8&qid=1519261370&sr=1-5&keywords=solid+wire+breadboard&dpID=51UopZhPJeL&preST=_SX342_QL70_&dpSrc=srch |
| 560 ohm 1/2watt 1% tolerance | Amazon | a14051600ux0301 | Uxcell a14051600ux0301 60 Piece Axial Lead 1% Tolerance Colored Ring Metal Film Resistor Resistance, 560 Ohm 1/2W. https://www.amazon.com/a14051600ux0301-Tolerance-Colored-Resistor-Resistance/dp/B016ZU2DGC/ref=pd_day0_328_9?_encoding=UTF8&pd_rd_i=B016ZU2DGC&pd_rd_r=XTM6KHQ3NT8DHWB1QWZN&pd_rd_w=txGNx&pd_rd_wg=ELyii&psc=1&refRID=XTM6KHQ3NT8DHWB1QWZN |
| 820 ohm 1/2watt 1% tolerance | Amazon | TTL-A-8035-50Ea | Set of 50Ea Metal Film Resistor 820 Ohm 1% 1/2W (0.5W). https://www.amazon.com/50Ea-Metal-Film-Resistor-0-5W/dp/B00VGU2SS0/ref=sr_1_14?s=industrial&ie=UTF8&qid=1518045187&sr=1-14&keywords=1%2F2W+820+Ohm+resistor |
| A Male to B Male Cable (10 Feet) | Amazon | Part# 30-001-10B | The cable that comes with the Arduino doesn't fit well in the box. https://www.amazon.com/gp/product/B001MSU1HG/ref=oh_aui_detailpage_o07_s00?ie=UTF8&psc=1 |
| Ardiuino UNO equivilent | Amazon | Elegoo EL-CB-001 | UNO R3 Board ATmega328P ATMEGA16U2 with USB Cable for Arduino. https://www.amazon.com/gp/product/B01EWOE0UU/ref=oh_aui_detailpage_o03_s00?ie=UTF8&psc=1 |
| Arduino holder | Digikey | X000018 | Fits very snug. https://www.digikey.com/product-detail/en/arduino/X000018/1050-1150-ND/8135632 |
| Black boxes for circuits and light chambers | Amazon | 1591ESBK | Hammond 1591ESBK ABS Project Box Black. https://www.amazon.com/gp/product/B0002BSRIO/ref=oh_aui_detailpage_o07_s00?ie=UTF8&psc=1 |
| Blue LED | Digikey | LXML-PB01-0040 | LED LUXEON REBEL BLUE SMD. Uses "Saber 20 mm Star base" https://www.digikey.com/product-detail/en/lumileds/LXML-PB01-0040/1416-1029-1-ND/3961134 |
| Cable ties | Amazon | sd027 | Tarvol Nylon Zip Ties (Pack of 100) 8 Inch with Self Locking Cable Ties (White). https://www.amazon.com/Tarvol-Nylon-Locking-Cable-White/dp/B01MRD0JRR/ref=sr_1_7?s=hi&ie=UTF8&qid=1519261882&sr=1-7&keywords=Cable+ties&dpID=51zUNmuUjyL&preST=_SY300_QL70_&dpSrc=srch |
| Command Fridge Clips | Amazon | 17210CLR | Clips for holding circuit board inside of the black box. Command strips can also be used. https://www.amazon.com/gp/product/B0084M69YM/ref=oh_aui_detailpage_o00_s01?ie=UTF8&psc=1 |
| Cyan LED | Digikey | LXML-PE01-0070 | LED LUXEON REBEL CYAN SMD. Uses "Saber 20 mm Star base" https://www.digikey.com/products/en?keywords=1416-1031-1-nd |
| Electrical tape - 3M Scotch #35 Electrical Tape Value Pack | Amazon | 03429NA | Scotch 700 Electrical Tape, 03429NA, 3/4 in x 66 ft. https://www.amazon.com/Scotch-Electrical-Tape-4-Inch-66-Foot/dp/B001ULCB1O/ref=psdc_256161011_t1_B001B19FDK |
| Farred LED 720nm | Luxeon Star LEDs | LXML-PF01 | Far Red (720nm) LUXEON Rebel LED. Uses "Saber 20 mm Star base" https://www.luxeonstar.com/lxml-pf01-far-red-luxeon-rebel-led-260mW |
| Farred LED 740nm | Ushio | EDC740D-1100-S5 | Uses "STAR XP 3535" base https://www.ushio-optosemi.com/jp/products/led/power/pdfs/edc/EDC740D-1100-S5.pdf |
| Farred LED 780nm | Ushio | EDC780D-1100 | Uses "STAR XP 3535" base http://www.ushio-optosemi.com/jp/products/led/power/pdfs/edc/EDC780D-1100.pdf |
| Farred LED 810nm | Ushio | EDC810D-1100 | Uses "STAR XP 3535" base http://www.ushio-optosemi.com/jp/products/led/power/pdfs/edc/EDC810D-1100.pdf |
| Farred LED 850nm | Ushio | EDC850D-1100 | Uses "STAR XP 3535" base http://www.ushio-optosemi.com/jp/products/led/power/pdfs/edc/EDC850D-1100.pdf |
| Grommets | Amazon | Pico 6120D | These are very common and there are many equivalents. https://www.amazon.com/Pico-6120D-Vinyl-Grommets-Package/dp/B0002ZG47G |
| Hair/Alligator Clips | Amazon | 1-3/4 Inch (45 Mm)- Hair Clips Single Prong Metal Alligator Clips Hairbow Accessory -Silver,50 Pcs. https://www.amazon.com/gp/product/B00K09T3L8/ref=oh_aui_detailpage_o00_s00?ie=UTF8&psc=1 | |
| LED base | Luxeon Star LEDs | LXB-RS20A | Saber 20 mm Star Blank Aluminum MCPCB Base For Rebel LEDs https://www.luxeonstar.com/saber-20mm-star-blank-mcpcb-base-for-a-rebel-leds |
| LED PCB fopr Ushio LEDs | Adura LED solutions | STAR XP 3535 Package LED | Fits many other LEDs by Ushio http://aduraled.com/product/pcb/1901-star-xp-3535-package-led |
| Loctite Epoxy Clear Multi-Purpose, 0.85-Fluid Ounce Syringe | Amazon | 1943587 | Loctite Epoxy Clear Multi-Purpose, 0.85-Fluid Ounce Syringe. https://www.amazon.com/Loctite-Multi-Purpose-0-85-Fluid-Syringe-1943587/dp/B011INNBN0/ref=psdc_256243011_t4_B0044FBB8C |
| NTE Heat Shrink 2:1 Assorted Colors and Sizes 160 PCS | Amazon | B000FIDTYG | These are very common and there are many equivalents. https://www.amazon.com/NTE-Heat-Shrink-Assorted-Colors/dp/B000FIDTYG/ref=sr_1_1?s=hi&ie=UTF8&qid=1519261282&sr=1-1&keywords=nte+shrink&dpID=41L5l7LCfiL&preST=_SX342_QL70_&dpSrc=srch |
| Picture Hanging Velcro Strips | Amazon | PH204-16NA | With these you can hang the LEDs in many places. https://www.amazon.com/Command-Picture-Hanging-16-Pairs-PH204-16ES/dp/B073XS3CHV/ref=pd_sim_60_5?_encoding=UTF8&pd_rd_i=B073XS3CHV&pd_rd_r=112KGQJNRRYD0RAT598H&pd_rd_w=3n34Q&pd_rd_wg=sRvec&psc=1&refRID=112KGQJNRRYD0RAT598H |
| Power supply | Amazon | tb013 | Any other 9V 1.5Z AC/DC converter will do becuase we cut the end off anyway. https://www.amazon.com/gp/product/B06Y1LF8T5/ref=oh_aui_detailpage_o07_s01?ie=UTF8&psc=1 |
| Power switch Rocker Switch | Amazon | SIXQJZML | These are very common and there are many equivalents. https://www.amazon.ca/COOLOOdirect-Solder-Rocker-Switch-Toggle/dp/B071Y7SMVQ/ref=sr_1_31?_encoding=UTF8&c=ts&dchild=1&keywords=Boat+Rocker+Switches&qid=1594434474&s=sports&sr=1-31&ts_id=2438617011 |
| Rectangular Connectors - for crimped wires | Digikey | 2183-1905-ND | 6 Rectangular Connectors - Housings Black 0.100" (2.54mm) https://www.digikey.com/product-detail/en/pololu-corporation/1905/2183-1905-ND/10450382?utm_adgroup=Rectangular%20Connectors%20-%20Housings&utm_source=google&utm_medium=cpc&utm_campaign=Shopping_Product_Connectors%2C%20Interconnects_NEW&utm_term=&utm_content=Rectangular%20Connectors%20-%20Housings&gclid=Cj0KCQjwvIT5BRCqARIsAAwwD-QmETT-ko07ote5VQgodKvWU0uDG8GYN7Vj-6WVBBOWdSgPaPd9azAaAhVLEALw_wcB |
| Red LED | Digikey | LXM3-PD01 | LED LUXEON REBEL DEEP RED SMD. Uses "Saber 20 mm Star base" https://www.digikey.com/products/en?keywords=1416-1701-1-nd |
| Sandpaper | Amazon | B002NEV6GS | 3M Wetordry Sandpaper, 03022, 800 Grit, 3 2/3 inch x 9 inch. https://www.amazon.com/3M-03022-Imperial-Wetordry-Sandpaper/dp/B002NEV6GS/ref=sr_1_1?dchild=1&keywords=3M+Imperial+Wetordry+3-2%2F3+in.+x+9+in.+800+Grit+Sandpaper+Sheets+%2810+Sheets-Pack%29&qid=1594435012&sr=8-1 |
| Solder for soldering wires and circuit components | Amazon | Mudder Lead Free Solder Wire Sn99 Ag0.3 Cu0.7 with Rosin Core for Electrical Soldering 0.22lbs (0.6 mm) | These are very common and there are many equivalents. https://www.amazon.com/Mudder-Solder-Electrical-Soldering-0-22lbs/dp/B01B61TWGY |
| Solder-able Breadboard for building the circuit | Amazon | GK1007 | Gikfun Solder-able Breadboard Gold Plated Finish Proto Board PCB Diy Kit for Arduino (Pack of 5PCS) GK1007. https://www.amazon.com/gp/product/B071R3BFNL/ref=oh_aui_detailpage_o04_s00?ie=UTF8&psc=1 |
| Spade drill bit | Amazon | Irwin 88811 | These are very common and there are many equivalents. https://www.amazon.com/Speedbor%C2%AE-Blue-GrooveTM-Standard-Length-Woodboring/dp/B017S9JXB2/ref=sr_1_10?ie=UTF8&qid=1519516560&sr=8-10&keywords=11%2F16+spade+bit |
| Transistor | Newark | 2N2222A | Can buy from many places. http://www.newark.com/nte-electronics/2n2222a/bipolar-transistor-npn-40v-to/dp/10M4197 |
| Voltage regulator | Newark | LM317T | Equivilent to NTE956. https://www.newark.com/stmicroelectronics/lm317t/adjustable-linear-regulator-1/dp/89K0685?gclid=CjwKCAiAu9vwBRAEEiwAzvjq-1rmUi6lvOIFFt-BxttHXvmAeUoni4NM0BW-BtM_LMliSqxA9Xq4KxoCfikQAvD_BwE&mckv=sQqHZDDRz_dc|pcrid|219869297712|plid||kword|lm317t|match|p|slid||product||pgrid|35966450488|ptaid|kwd-541160713|&s_kwcid=AL!8472!3!219869297712!p!!g!!lm317t&CMP=KNC-GUSA-SKU-MDC |
| Windows 10 tablet | Amazon | B08BYTT79Y | Any Windows 10 PC will do. https://www.amazon.com/gp/product/B08BYTT79Y/ref=ppx_yo_dt_b_asin_title_o01_s00?ie=UTF8&psc=1 |
| Cell Culture Reagents | |||
| Human Embryonic Kidney 293 cells HEK293 | ATCC | ATCC CRL-1573 | Common Cell line. https://www.atcc.org/products/all/CRL-1573.aspx |
| Fetal Bovine Serum | ThermoFisher | 26140079 | These are very common and there are many equivalents. https://www.thermofisher.com/order/catalog/product/26140079#/26140079 |
| Dulbecco’s Modified Eagle Medium High Glucose | ThermoFisher | 11965−092 | These are very common and there are many equivalents. https://www.thermofisher.com/order/catalog/product/11965118?SID=srch-srp-11965118#/11965118?SID=srch-srp-11965118 |
| 10,000 units/mL of penicillin and 10,000 µg/mL of streptomycin | ThermoFisher | 15140122 | These are very common and there are many equivalents. https://www.thermofisher.com/order/catalog/product/15140122?SID=srch-srp-15140122#/15140122?SID=srch-srp-15140122 |
| White Corning 96-Well Solid Black or White Polystyrene Microplates | ThermoFisher | 07-200-589 | White plates are preferred. Do not use clear plates. https://www.fishersci.com/shop/products/costar-96-well-black-white-solid-plates-8/p-152852 |
| PEI MAX - Transfection Grade Linear Polyethylenimine Hydrochloride (MW 40,000) | PolySciences | 24765-1 | Can be replaced with another transfection reagent. https://www.polysciences.com/default/catalog-products/life-sciences/transfection-reagents/polyethylenimine-max-mw40000-high-potency-linear-pei/ |
| Name of Equipment | |||
| Diagonal Cutting Plier (110mm) | Amazon | Proskit 1PK-037S | These are very common and there are many equivalents. https://www.amazon.com/iExcell-Diagonal-Cutting-Nippers-Chrome-Vanadium/dp/B076XYVS6Y/ref=sr_1_11?dchild=1&keywords=diagonal+cutting+pliers&qid=1594436230&sr=8-11 |
| Dremil 3000 with cutting tool and grinder | Amazon | Dremel 3000 | Dremel 3000-2/28 Variable Speed Rotary Tool Kit- 1 Attachments & 28 Accessories- Grinder, Sander, Polisher, Router, and Engraver. https://www.amazon.com/Dremel-3000-2-28-Attachments-Accessories/dp/B005JRJE7Y/ref=sr_1_3?dchild=1&keywords=Dremel+200-1%2F15+Two-Speed+Rotary+Tool+Kit&qid=1594436404&s=hi&sr=1-3 |
| Dremil cutting and grinding tool | Amazon | Dremel 200-1/15 | Any similar Dremil will work. https://www.amazon.com/Dremel-200-1-Two-Speed-Rotary-Tool/dp/B002BAHF8W/ref=sr_1_1?s=hi&ie=UTF8&qid=1519268058&sr=1-1&keywords=dremel+200&dpID=41h9ZucnTYL&preST=_SY300_QL70_&dpSrc=srch |
| Dremil grinding tip | Amazon | Dremel 84922 | Silicon Carbide Grinding Stone. https://www.amazon.com/Dremel-84922-Silicon-Carbide-Grinding/dp/B00004UDKD/ref=sr_1_fkmr0_1?s=hi&ie=UTF8&qid=1519268585&sr=1-1-fkmr0&keywords=dremel+tip+84922 |
| EDSYN The Original Deluxe SOLDAPULLT | Amazon | DS017 | For removing solder/mistakes. https://www.amazon.com/EDSYN-The-Original-Deluxe-SOLDAPULLT/dp/B006GOKVKI |
| Helping Hand with Magnifying Glass | Amazon | SE MZ101B | These are very common and there are many equivalents. https://www.amazon.com/SE-MZ101B-Helping-Magnifying-Glass/dp/B000RB38X8/ref=sr_1_4?s=hi&ie=UTF8&qid=1519268108&sr=1-4&keywords=Helping+hands&dpID=31GEhMw7WvL&preST=_SX300_QL70_&dpSrc=srch |
| Pointed Nose Micro Pliers | Amazon | Hakko CHP PN-20-M | Steel Super Specialty Pointed Nose Micro Pliers with Smooth Jaws, 1.0mm Nose. https://www.amazon.com/Hakko-PN-20-M-Specialty-Pointed-Pliers/dp/B00FZPGUBI/ref=sr_1_1?s=hi&ie=UTF8&qid=1519268153&sr=1-1&keywords=Hakko+CHP+PN-20-M+Steel+Super+Specialty+Pointed+Nose+Micro+Pliers+with+Smooth+Jaws%2C+1.0mm+Nose&dpID=3109XRgwn3L&preST=_SX342_QL70_&dpSrc=srch |
| Small screw drivers | Amazon | Wiha 26197 | These are very common and there are many equivalents. https://www.amazon.com/26197-Precision-Slotted-Phillips-Screwdrivers/dp/B01L46TEN2/ref=sr_1_1?s=hi&ie=UTF8&qid=1519268018&sr=1-1&keywords=Wiha+precision+set |
| Soldering iron | Amazon | Yihua 939D+ Digital Soldering Station | These are very common and there are many equivalents. https://www.amazon.com/Professional-Digital-Soldering-Station-Switch/dp/B07YSCBZ4F/ref=psdc_13837391_t1_B07RVMZNYR |
| TraceTech No-Clean Flux Pen | Amazon | 2507-N | Tech Spray 2507-N No-Clean Flux Dispensing Pen, 11.5 mL. https://www.amazon.com/Tech-Spray-2507-N-No-Clean-Dispensing/dp/B00DDF2FYS/ref=sr_1_1?dchild=1&keywords=2507-N&qid=1595469618&sr=8-1 |
| Weller WSA350 120v Bench Top Smoke Absorber | Amazon | WSA350 | For soldering safety. https://www.amazon.com/Weller-WSA350-Bench-Smoke-Absorber/dp/B000EM74SK |
| Wire strippers | Amazon | CSP-30-7 | These are very common and there are many equivalents. https://www.amazon.com/Hakko-CSP-30-7-Stripper-Maximum-Capacity/dp/B00FZPHY7M/ref=psdc_553398_t5_B00FZPHMUG |
| IWISS IWS-3220M Micro Connector Pin Crimping Tool 0.03-0.52mm² 32-20AWG | Amazon | IWS-3220M | These are very common and there are many equivalents. https://www.amazon.com/gp/product/B078WPT5M1/ref=ppx_yo_dt_b_search_asin_title?ie=UTF8&psc=1 |
References
- Klewer, L., Wu, Y. W. Light-induced dimerization approaches to control cellular processes. Chemistry - A European Journal. 25 (54), 12452-12463 (2019).
- Khamo, J. S., Krishnamurthy, V. V., Sharum, S. R., Mondal, P., Zhang, K. Applications of optobiology in intact cells and multicellular organisms. Journal of Molecular Biology. 429 (20), 2999-3017 (2017).
- Mansouri, M., Strittmatter, T., Fussenegger, M. Light-controlled mammalian cells and their therapeutic applications in synthetic biology. Advanced Science. 6 (1), Weinheim, Baden-Wurttemberg, Germany. 1800952(2019).
- Kyriakakis, P., et al. Biosynthesis of orthogonal molecules using ferredoxin and ferredoxin-NADP+ reductase systems enables genetically encoded PhyB optogenetics. ACS Synthetic Biology. 7 (2), electronic resource 706-717 (2018).
- Allen, M. E., et al. An AND-gated drug and photoactivatable Cre-loxP system for spatiotemporal control in cell-based therapeutics. ACS Synthetic Biology. 8 (10), electronic resource 2359-2371 (2019).
- Huang, Z., et al. Engineering light-controllable CAR T cells for cancer immunotherapy. Science Advances. 6 (8), (2020).
- Mancinelli, A. L., Rossi, F., Moroni, A. Cryptochrome, phytochrome, and anthocyanin production. Plant Physiology. 96 (4), 1079-1085 (1991).
- Hernández-Candia, C. N., Wysoczynski, C. L., Tucker, C. L. Advances in optogenetic regulation of gene expression in mammalian cells using cryptochrome 2 (CRY2). Methods. 164-165, 81-90 (2019).
- Bugaj, L. J., Lim, W. A. High-throughput multicolor optogenetics in microwell plates. Nature Protocols. 14 (7), 2205-2228 (2019).
- Repina, N. A., et al. Engineered illumination devices for optogenetic control of cellular signaling dynamics. Cell Reports. 31 (10), 107737(2020).
- Müller, K., Zurbriggen, M. D., Weber, W. Control of gene expression using a red- and far-red light-responsive bi-stable toggle switch. Nature Protocols. 9 (3), 622-632 (2014).
- Gerhardt, K. P., et al. An open-hardware platform for optogenetics and photobiology. Scientific Reports. 6, 35363(2016).
- Crefcoeur, R. P., Yin, R., Ulm, R., Halazonetis, T. D. Ultraviolet-B-mediated induction of protein-protein interactions in mammalian cells. Nature Communications. 4, 1779(2013).
- Chen, D., Gibson, E. S., Kennedy, M. J. A light-triggered protein secretion system. The Journal of Cell Biology. 201 (4), 631-640 (2013).
- Zhou, X. X., Chung, H. K., Lam, A. J., Lin, M. Z. Optical control of protein activity by fluorescent protein domains. Science. 338 (6108), 810-814 (2012).
- Zhou, X. X., et al. A single-chain photoswitchable CRISPR-Cas9 architecture for light-inducible gene editing and transcription. ACS Chemical Biology. 13 (2), 443-448 (2018).
- Wu, Y. I., et al. A genetically encoded photoactivatable Rac controls the motility of living cells. Nature. 461 (7260), 104-108 (2009).
- Kawano, F., Suzuki, H., Furuya, A., Sato, M. Engineered pairs of distinct photoswitches for optogenetic control of cellular proteins. Nature Communications. 6, 6256(2015).
- Berndt, A., Yizhar, O., Gunaydin, L. A., Hegemann, P., Deisseroth, K. Bi-stable neural state switches. Nature Neuroscience. 12 (2), 229-234 (2009).
- Gong, X., et al. An ultra-sensitive step-function opsin for minimally invasive optogenetic stimulation in mice and macaques. Neuron. 107 (1), 38-51 (2020).
- Kennedy, M. J., et al. Rapid blue-light-mediated induction of protein interactions in living cells. Nature Methods. 7 (12), 973-975 (2010).
- Taslimi, A., et al. Optimized second-generation CRY2-CIB dimerizers and photoactivatable Cre recombinase. Nature Chemical Biology. 12 (6), 425-430 (2016).
- Shimizu-Sato, S., Huq, E., Tepperman, J. M., Quail, P. H. A light-switchable gene promoter system. Nature Biotechnology. 20 (10), 1041-1044 (2002).
- Müller, K., et al. A red/far-red light-responsive bi-stable toggle switch to control gene expression in mammalian cells. Nucleic Acids Research. 41 (7), 77(2013).
- Levskaya, A., Weiner, O. D., Lim, W. A., Voigt, C. A. Spatiotemporal control of cell signalling using a light-switchable protein interaction. Nature. 461 (7266), 997-1001 (2009).
- Levskaya, A., et al. Synthetic biology: engineering Escherichia coli to see light. Nature. 438 (7067), 441-442 (2005).
- Kaberniuk, A. A., Shemetov, A. A., Verkhusha, V. V. A bacterial phytochrome-based optogenetic system controllable with near-infrared light. Nature Methods. 13 (7), 591-597 (2016).
- Redchuk, T. A., Omelina, E. S., Chernov, K. G., Verkhusha, V. V. Near-infrared optogenetic pair for protein regulation and spectral multiplexing. Nature Chemical Biology. 13 (6), 633-639 (2017).
- Ong, N. T., Olson, E. J., Tabor, J. J. Engineering an E. coli near-infrared light sensor. ACS Synthetic Biology. 7 (1), electronic resource 240-248 (2018).
- Zhang, W., et al. Optogenetic control with a photocleavable protein, PhoCl. Nature Methods. 14 (4), 391-394 (2017).
- Lee, D., et al. Temporally precise labeling and control of neuromodulatory circuits in the mammalian brain. Nature Methods. 14 (5), 495-503 (2017).
- Kim, M. W., et al. Time-gated detection of protein-protein interactions with transcriptional readout. eLife. 6, (2017).
Reprints and Permissions
