This protocol provides detailed and comprehensive methods for the isolation, culture, polarization, and measurement of the glycolytic metabolic state of live bone marrow-derived macrophages (BMDMs). This paper provides step-by-step instructions with realistic visual illustrations for workflow and glycolytic assessment of BMDMs in real-time.
A subscription to JoVE is required to view this content. Sign in or start your free trial.
Method Article
A Comprehensive High-Efficiency Protocol for Isolation, Culture, Polarization, and Glycolytic Characterization of Bone Marrow-Derived Macrophages
In This Article
Summary
Abstract
Macrophages are among the most important antigen-presenting cells. Many subsets of macrophages have been identified with unique metabolic signatures. Macrophages are commonly classified as M1-like (inflammatory) and M2-like (anti-inflammatory) subtypes. M1-like macrophages are pro-inflammatory macrophages that get activated by LPS and/or pro-inflammatory cytokines such as INF-γ, IL-12 & IL-2. M1-like polarized macrophages are involved in various diseases by mediating the host's defense to a variety of bacteria and viruses. That is very important to study LPS induced M1-like macrophages and their metabolic states in inflammatory diseases. M2-like macrophages are considered anti-inflammatory macrophages, activated by anti-inflammatory cytokines and stimulators. Under the pro-inflammatory state, macrophages show increased glycolysis in glycolytic function. The glycolytic function has been actively investigated in the context of glycolysis, glycolytic capacity, glycolytic reserve, compensatory glycolysis, or non-glycolytic acidification using extracellular flux (XF) analyzers.
This paper demonstrates how to assess the glycolytic states in real-time with easy-to-follow steps when the bone marrow-derived macrophages (BMDMs) are respiring, consuming, and producing energy. Using specific inhibitors and activators of glycolysis in this protocol, we show how to obtain a systemic and complete view of glycolytic metabolic processes in the cells and provide more accurate and realistic results. To be able to measure multiple glycolytic phenotypes, we provide an easy, sensitive, DNA-based normalization method for polarization assessment of BMDMs. Culturing, activation/polarization and identification of the phenotype and metabolic state of the BMDMs are crucial techniques that can help to investigate many different types of diseases.
In this paper, we polarized the naïve M0 macrophages to M1-like and M2-like macrophages with LPS and IL4, respectively, and measured a comprehensive set of glycolytic parameters in BMDMs in real-time and longitudinally over time, using extracellular flux analysis and glycolytic activators and inhibitors.
Introduction
Macrophages are one of the most critical cells of the innate immune system M1-like. They are involved in clearing infectious diseases, phagocytosis, antigen presentation, and inflammation regulation2. Furthermore, macrophages are required to regulate other immune cells via various cytokines they release3. There is a big spectrum in macrophage phenotypes4. Depending on the signals that macrophages are exposed to, they polarize toward different inflammatory and metabolic states5. Macrophages manifest metabolic alterations in various diseases, depending on what tissue the macrophages reside6. Polarized macrophages have the capability to reprogram or switch their glycolytic metabolism, lipid metabolism, amino acid metabolism, and mitochondrial oxidative phosphorylation (OXPHOS)7,8. Classically activated M1-like macrophages and alternatively activated M2-like macrophages are the two most studied phenotypes of macrophages3. Non-activated quiescent macrophages are referred to as M0 macrophages. Polarization of M0 macrophages towards an M1-like phenotype can be induced by stimulation of naive BMDMs with bacterial lipopolysaccharide (LPS)9. The PI3K-AKT-mTOR-HIF1a signaling pathway can be activated in macrophages in the presence of inflammatory cytokines, interferon-gamma (IFN γ,) or tumor necrosis factor (TNF)10. M1-like macrophages have increased levels of glycolysis metabolism, decreased levels of oxidative phosphorylation (OXPHOS), producing inflammatory cytokines involved in infectious and inflammatory diseases8. On the other hand, polarization towards the M2-like phenotype can be induced by Interleukin (IL)-4, via the JAK-STAT, PPAR, and AMPK pathways, or by (IL)-13 and TGFβ pathays11,12.
In contrast to M1-like macrophages, M2-like macrophages have decreased glycolysis and increased OXPHOS and are involved in anti-parasitic and tissue repair activities8,13. BMDMs are a widely used system for the study of macrophages that are derived from bone marrow stem cells. Glycolysis and OXPHOS are the two leading energy production pathways in the cells14. Based on their microenvironment, BMDMs can choose to use either of these pathways; in some cases, switch from one to another, or use both pathways14. In this study, we focused on glycolysis metabolism in activated pro-inflammatory macrophages. When the glucose in the cytoplasm is converted to pyruvate and then lactate, the cells produce protons in the medium that cause an elevation in the acidification rate in the surrounded medium of M1-like cells5. An extracellular flux analyzer was used to measure the acidification rate of the cell media. Results are reported as Extracellular Acidification Rate (ECAR) or as Proton Efflux Rate.
An optimized quick and easy method to access glycolysis levels in polarized macrophages is essential to determine the glycolytic phenotype, metabolite changes, and the effects of inhibitors/activators and drugs on the polarized macrophages. The method described in this manuscript has been optimized to give information about specific glycolysis factors (Glycolysis, Glycolytic capacity, Glycolytic reserve, and Non-glycolytic acidification), as well as the metabolic reprogramming of glycolytic metabolism. The inhibitor (2DG) that has been used in this study explicitly targets the glycolysis pathway.
This optimized protocol has been modified and improved based on the combination of a published protocol16, extracellular flux analysis of glycolytic assays of manufacturer's user guides, and direct communication with manufacturer's R&D scientists.
Access restricted. Please log in or start a trial to view this content.
Protocol
Mice were humanely sacrificed according to Assessment and Accreditation of Laboratory Animal Care (AAALAC) and American Association for Laboratory Animal Science (AALAS) guidelines and using protocols approved by the Texas A&M University institutional animal care and use committee (IACUC).
1. Mice bone marrow harvest and culture of BMDMs
- Sacrifice mouse (6-10 weeks of age C57Bl/6 mice were in this protocol) and lay it on its ventral side, cut the skin and peritoneal layer and gently peel off the legs.
NOTE: Use CO2 gas exposure to euthanize the mouse. - Separate both hind legs from the hip down, being careful not to cut the bone.
- Place the whole leg in an empty 50 mL conical tube (with feet facing up to have an easy grip to pull out later) on ice and proceed with harvesting both legs from the mouse.
2. Femur exposure
NOTE: Perform the following steps in a biosafety cabinet.
- Harvest the femur by cutting off the tibia from each leg and remove as much tissue surrounding the femur as possible with scissors and laboratory paper.
- Place harvested, "cleaned" femurs in a 10 cm plate containing a piece of laboratory paper saturated with tissue culture (TC) medium or PBS. Place them on ice.
- Continue harvesting femurs and removing tissue from all femurs before proceeding to the flushing stage (Figure 1A).
3. Marrow flush
- To flush marrow from femurs, use a 3 mL syringe filled with TC medium or PBS with a 23G needle. Fill the syringe before exposing the marrow.
- Use scissors to expose the marrow by cutting the very end of the femur at both epiphyses.
- Insert needle tip into the femur and gently flush marrow out into a 10 cm dish.
- Run the needle through the entire length of the femur, and flush until the bone color turns white. Usually, most marrow can be flushed out with 2-3 mL of media.
- Flush all femurs and pool bone marrow in the dish. Use a needle to break up any visible clumps. Strain marrow into a 50 mL conical tube (Figure 1A).
4. RBC lysis
- Spin marrow at 190 x g for 10 min. Aspirate the supernatant.
- Resuspend the pellet in 4 mL of ACK lysis buffer with a pipette. Allow RBC lysis buffer to work for 5 min at room temperature.
- Add 4 mL of TC medium RPMI-C 10% (RPMI 1640 -GlutaMAX) supplemented with 2-mercaptoethanol, gentamicin, streptomycin, and 10% FCS to the marrow suspension and spin at 1300 x g for 10 min.
- Strain again to remove RBC debris and re-suspend in a small volume of RPMI-C 10% for counting.
- Count cells with a cell counter (Figure 1B). A Vi-Cell Counter was used to determine the count and viability of cells in the suspension.
5. Plating and culture
- Add 10 mL of RPMI-C 10% + 10 ng/mL M-CSF (Macrophage Colony Stimulating Factor, an essential regulator of monocyte/macrophage proliferation, differentiation, and survival) to as many 10 cm plates as desired.
- Add an appropriate volume of counted cells so that each 10 cm plate contains 1 x 10⁶ cells. Put the plates in a 37 °C incubator (defined as day 0).
- On day 3, gently add 5 mL of fresh RPMI-C 10% + 10 ng/mL M-CSF to each plate.
NOTE: On day 7, BMDMs should be ready for testing (Figure 1C).
6. Harvest from plates
- Use a light microscope to confirm that most cells have adhered to plates.
- Gently aspirate media. Then add 3 mL of PBS and gently swirl the plate. Aspirate this well to remove any remaining non-adherent cells.
- Add 7-10 mL of cold PBS to the plate, use a P1000 pipette to wash the bottom of plates, and harvest all remaining cells into a collection tube.
NOTE: Keep tubes on ice as macrophages are very tightly adherent and will adhere to the inside of the tube. If the cells kept cold, they would be less tightly adherent. - Centrifuge, count, and plate cells for experiments (Figure 1D). Using Flow cytometry, resulting cells should be >95% positive for CD11b and F4/80. (macrophage polarization was determined by staining with M1-like markers of CD38, TNF-a, and MCP-1 and M2-like marker of CD206.
NOTE: Perform steps 6.1-6.3 in the biosafety cabinet and perform step 6.4 on the benchtop. Maintain aseptic techniques throughout the procedure.

Figure 1: Graphical workflow of mouse bone marrow culture of BM-Derived Macrophages. (A) Leg harvest, Femur exposure, and marrow flush; (B) RBC Lysis; (C) Plating and culture; (D) Cell harvest from the plates. Please click here to view a larger version of this figure.
7. The day before the metabolic flux analyzer assay: seeding and polarization of the cells for the glycolytic test
- Warm up the Metabolic Flux Analyzer to 37 °C by turning on the instrument.
- Hydrate a cartridge by adding 200 µL of a Calibrant Solution and incubate the cartridge in a non-CO2 incubator overnight (Figure 2A). The humidity of non-CO2 incubator is not important for cartridge hydration.
- An hour prior to the experiment, dip the plate a few times up and down, which will help to remove air bubbles.
- Design the plate map on the software in the default glycolysis stress test-acute injection, by following the instruction of the test.
- Click on the software icon, and then click on Glycolysis stress-acute injection test. On the group definition icon, generate group names.
- There are five measurement cycles with a duration of 18 minutes and four injections. Change the injection of port A to Glucose, port B to Oligomycin, Port C to Rotenone and antimycin A (Rot/AA), and Port D to 2DG.
- Re-suspend the cells in RPMI-C 10% medium and seed 50k cells per well except for the four edges of the plate (A1, A12, H1, and H12; Add media only, no cells) in a Metabolic Flux Analyzer microplate to a final volume of 100 µL. Normally a minimum of 40k cells is required to conduct this assay.
- Allow the cells to sit at room temperature for 45 min to avoid the edge effect of the cells. The edge effect is when the medium from around the perimeter of the plate evaporates partly, which causes volume and concentration changes and reduces cell viability.
- Add 10 ng/mL LPS to polarize the naïve macrophages towards M1-like cells and add 20 ng/ml of IL-4 to polarize them towards M2-like cells. Use at least 3 to 6 wells per condition (Figure 2B).
- Check the cells under the microscope and place the plate in an incubator at 37 °C and 5% CO2 for 24 hours.
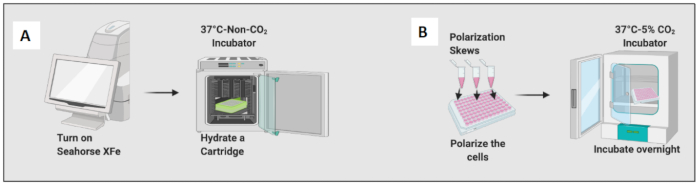
Figure 2: Graphical demonstration of seeding and polarization of the cells. (A) Extracellular flux analyzer set up and cartridge hydration; (B) Polarization of the cells and overnight incubation. Please click here to view a larger version of this figure.
8. Day of the assay: XF Medium and compound preparation
- Complement 100 mL of XF RPMI (pH 7.4) assay medium with 2 mM glutamine.
- Filter-sterilize the media using a 0.2 µm vacuum filter system.
- Place the assay media in a 37°C water bath for 20 min.
- Remove the plated cells from the 37 °C, 5% CO2 incubator. Wash the cells with assay media twice and replace the previous media with assay media to the final volume of 180 µL.
- Use a microscope to make sure that all the wells have confluent cells and mark any wells that have any scratches from pipetting. If there are any scratches, remove that plate before analyzing.
- Position the cell-containing plate in a non-CO2 incubator for 45 min (Figure 3A).
- Using the compounds and the assay media to make stock solutions of Glucose (100 mM), Oligomycin (100 µM), Rot/AA (50 µM), and 2DG (500 mM) (Table 1).
- Make a 10x injection mixture of each compound using assay media (Table 2).
| Injection Stocks (Provided in the kits) | Add Complete assay media (mL) | Final Stock concentration (μM) |
| Glucose | 3 | 100K |
| Oligomycin | 0.72 | 100 |
| 2-DG | 3 | 100k |
Table 1. Injection stocks
| Ports on the Cartridge | Stock solutions | Add stock volume | Add assay media | Final concentration of injections (10x) | Add this volume to designated port (μL) | Final concentration after injection in each well |
| A | Glucose (100 mM) | 3000 μL + 0 μL | 100 mM | 20 | 10 mM | |
| B | Oligomycin (100 μM) | 300 μL + 2700 μL | 10 μM | 22 | 1.0 μM | |
| C | Rotenone/ Antimycin A (50 μM) | 300 μL + 2700 μL | 5 μM | 25 | 0.5 μM | |
| D | 2-DG (500 mM) | 300 μL + 0 μL | 500 mM | 28 | 50 mM | |
Table 2. Final Injection Concentrations
9. Day of the assay: Running the acute glycolytic test on polarized macrophages
- Open the saved Glycolysis stress assay (Acute injection) template from the software. The default Acute Glyco-Stress Test has 3 minutes of mix and measurement before each injection.
- Check the template and the assay details, and when ready, click on Run and follow the instruction of the default assay. However, all parameters can be customized.
- Remove the Sensor Cartridge from the non-CO2 incubator, remove the lid, and insert in the instrument in a way that the A1 well of the cartridge plate falls into the top left corner of the insertion panel of the machine. Usually, calibration takes between 20 to 45 min.
- After finishing the calibration, the device will eject the plate containing the calibrant solution and will hold the sensor cartridge. Remove the calibrant containing the plate.
- Remove the cell plate from the non-CO2 incubator, remove the plate lid, and insert it in the machine. Click on Run (Figure 3B).
- When the assay is done, the machine will eject the cell plate and the sensor cartridge.
- Remove the media from the plate and freeze it at -20 °C for further normalization.
- Use the commercial cell proliferation assay kit (e.g., CyQUANT) for normalizing the cells.
- Add 1 mL of Compound B or lysis buffer to 19 mL of nuclease-free distilled water.
- Add 100 µL of Compound A or GR working solution to the abovementioned solution.
- Make sure the cells in the plate are thawed and then add 200 µL of the solution to each well.
- Incubate for 5 min at room temperature (RT).
- Measure the fluorescence in 480 nm excitation and 520 nm emission wavelengths using a plate reader.
- Normalize the cells on the normalization panel of the software.
- Normalize cells based on naïve macrophages cell count (Figure 3C). Consider the average of the naïve macrophages as 1 (by dividing the cell number of each well by the average cell number of naïve macrophages) and apply them to all macrophages.
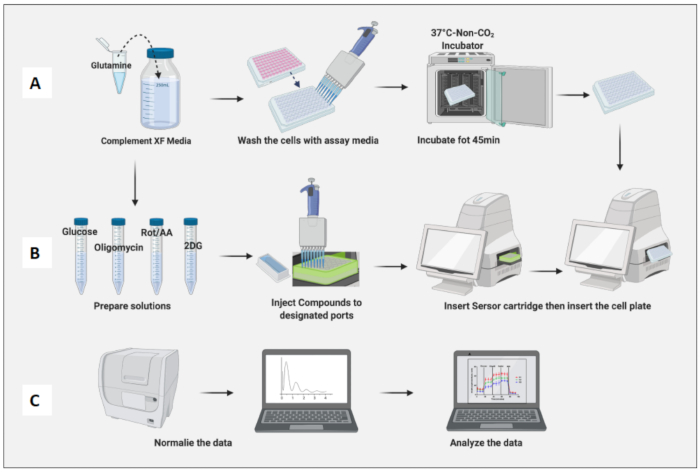
Figure 3: Day of the assay: medium and compound preparation and running the assay. (A) Cells preparation for assay; (B) Compounds preparation, calibration, and running the assay; (C) Normalization and data analysis. Please click here to view a larger version of this figure.
Access restricted. Please log in or start a trial to view this content.
Results
Glycolysis and mitochondrial oxidative phosphorylation are the two major ATP production pathways in the cells (Figure 4A). Some cells have the capability to switch between these two pathways to meet their energy demands. The conversion of glucose to pyruvate in the cytoplasm is called glycolysis. Pyruvate has two fates; it will either get converted to lactate or further metabolized through the TCA cycle and eventually through the electron transport chain (ETC...
Access restricted. Please log in or start a trial to view this content.
Discussion
As mentioned earlier, the extracellular flux analyzer machine can provide real-time information about two major energy-producing pathways of the cells by measuring OCR (oxygen consumption rate), an indicator of mitochondrial OXPHOS activity, and ECAR (extracellular acidification rate) which is an indicator of glycolysis. Macrophages can use both pathways, depending on their microenvironment. They can also switch their energy production pathways17,18. Understandin...
Access restricted. Please log in or start a trial to view this content.
Disclosures
The authors have nothing to disclose.
Acknowledgements
We thank Ms. Joanna Rocha for editorial assistance. The work was partially supported by the National Institutes of Health (NIH) R01DK118334 (to Drs. Sun and Alaniz) and (NIH) R01A11064Z (to Drs. Jayaraman and Alaniz).
Access restricted. Please log in or start a trial to view this content.
Materials
| Name | Company | Catalog Number | Comments |
|---|---|---|---|
| 23G needles | VWR | BD305145 | |
| 2-mercaptoethanol | Life Technologies | 21985023 | |
| 50ml Conical Tube | VWR | 21008-951 | |
| ACK lysis buffer | Thermo Fisher Scientific | A1049201 | It can be lab-made |
| Agilent Seahorse XF glycolysis stress test kit | Agilent Technologies | 103020-100 | |
| Agilent Seahorse XF Glycolysis Stress Test Kit User Guide | Agilent Technologies | 103020-400 | |
| Agilent Seahorse XF Glycolytic Rate Assay Kit | Agilent Technologies | 103344-100 | |
| Agilent Seahorse XF Glycolytic Rate Assay Kit User Guide | Agilent Technologies | 103344-100 | |
| Alexa Fluor 488 anti-mouse CD206 (MMR) Antibody | BioLegend | 141710 | |
| anti-mouse CD11b eFluor450 100ug | eBioscience | 48-0112-82 | |
| BD 3ML - SYRINGE | VWR | BD309657 | Other syringes are acceptable too |
| Cell counter-Vi-CELL- XR Complete System | BECKMAN COULTER Life Sciences | 731050 | Cells can be manually counted too |
| Cell Strainer-70µm | VWR | 10199-656 | |
| CyQUANT Cell Proliferation Assay Kit | Thermo Fisher Scientific | C7026 | |
| F4/80 monoclonal antibody (BM8) pe-Cyanine7 | eBioscience | 25-4801-82 | |
| Fetal Bovine Serum | Life Technologies | 16000-044 | |
| Flow cytometer: BD LSFRFortessa X-20 | BD | 656385 | |
| Kim Wipes | VWR | 82003-822 | |
| LPS-SM ultrapure (tlrl-smpls) 5 mg | Invivogen | tlrl-smlps | |
| MCSF | Peprotech | 315-02 | |
| Murine IL-4 | Peprotech | 214-14 | |
| PE Rat Anti-Mouse CD38 | BD Biosciences | 553764 | |
| Penicillin-Streptomycin (10,000 U/mL) | Life Technologies | 15140122 | |
| Petri Dish 100mm x 15 mm | Fisher Scientific | F80875712 | |
| RPMI, Glutamax, HEPES | Invitrogen | 72400-120 | |
| Seahorse Calibrant Solution | Agilent Technologies | 103059-000 | |
| Seahorse XF 200mM Glutamine Solution | Agilent Technologies | 103579-100 | |
| Seahorse XF Glycolytic Rate Assay Kit | Agilent Technologies | 103344-100 | |
| Seahorse XFe96 FluxPaks | Agilent Technologies | 102416-100 | |
| XF Glycolysis Stress Test Kit | Agilent Technologies | 103020-100 | |
| XF RPMI Medium, pH 7.4 without phenol Red | Agilent Technologies | 103336-100 |
References
- Rosowski, E. E. Determining macrophage versus neutrophil contributions to innate immunity using larval zebrafish. Disease Models & Mechanisms. 13 (1), (2020).
- Martinez-Pomares, L., Gordon, S. The Autoimmune Diseases. , Elsevier. 191-212 (2020).
- Orecchioni, M., Ghosheh, Y., Pramod, A. B., Ley, K. Macrophage polarization: different gene signatures in M1 (LPS+) vs. classically and M2- (LPS–) vs. alternatively activated macrophages. Frontiers in immunology. 10, 1084(2019).
- Barrett, T. J. Macrophages in atherosclerosis regression. Arteriosclerosis, Thrombosis, and Vascular Biology. 40 (1), 20-33 (2020).
- Ni, Y., et al. Adipose tissue macrophage phenotypes and characteristics: the key to insulin resistance in obesity and metabolic disorders. Obesity. 28 (2), 225-234 (2020).
- Chu, C., et al. Modulation of foreign body reaction and macrophage phenotypes concerning microenvironment. Journal of Biomedical Materials Research Part A. 108 (1), 127-135 (2020).
- Batista-Gonzalez, A., Vidal, R., Criollo, A., Carreño, L. J. New insights on the role of lipid metabolism in the metabolic reprogramming of macrophages. Frontiers in Immunology. 10, 2993(2020).
- Kang, S., Kumanogoh, A. The spectrum of macrophage activation by immunometabolism. International Immunology. , (2020).
- Shi, Y., et al. M1 But Not M0 Extracellular Vesicles Induce Polarization of RAW264. 7 Macrophages Via the TLR4-NFκB Pathway In Vitro. Inflammation. , 1-9 (2020).
- Zhang, L., Li, S. Lactic acid promotes macrophage polarization through MCT-HIF1α signaling in gastric cancer. Experimental Cell Research. 388 (2), 111846(2020).
- Geng, T., et al. CD137 signaling induces macrophage M2 polarization in atherosclerosis through STAT6/PPARδ pathway. Cellular Signalling. , 109628(2020).
- Liu, Q., et al. Combined blockade of TGf-β1 and GM-CSF improves chemotherapeutic effects for pancreatic cancer by modulating tumor microenvironment. Cancer Immunology & Immunotherapy. , 1-16 (2020).
- Rigoni, T. S., et al. RANK Ligand Helps Immunity to Leishmania major by Skewing M2 Into M1 Macrophages. Frontiers in Immunology. 11, 886(2020).
- Viola, A., Munari, F., Sánchez-Rodríguez, R., Scolaro, T., Castegna, A. The metabolic signature of macrophage responses. Frontiers in Immunology. 10, (2019).
- Ivashkiv, L. B. The hypoxia–lactate axis tempers inflammation. Nature Reviews Immunology. 20 (2), 85-86 (2020).
- Van den Bossche, J., Baardman, J., de Winther, M. P. Metabolic characterization of polarized M1 and M2 bone marrow-derived macrophages using real-time extracellular flux analysis. Journal of Visualized Experiments. (105), e53424(2015).
- Van den Bossche, J., et al. Mitochondrial dysfunction prevents repolarization of inflammatory macrophages. Cell reports. 17 (3), 684-696 (2016).
- Liu, P. S., Ho, P. C. Metabolic Signaling. , Springer. 173-186 (2019).
- Wang, F., et al. Glycolytic stimulation is not a requirement for M2 macrophage differentiation. Cell metabolism. 28 (3), 463-475 (2018).
- Romero, N., Rogers, G., Neilson, A., Dranka, B. Quantifying Cellular ATP Production Rate Using Agilent Seahorse XF Technology. , Agilent Technologies, Inc. (2018).
- Mookerjee, S. A., Brand, M. D. Measurement and analysis of extracellular acid production to determine glycolytic rate. Journal of Visualized Experiments. (106), e53464(2015).
- Mookerjee, S. A., Goncalves, R. L., Gerencser, A. A., Nicholls, D. G., Brand, M. D. The contributions of respiration and glycolysis to extracellular acid production. Biochimica Et Biophysica Acta-Bioenergetics. 1847 (2), 171-181 (2015).
- Yang, S., et al. Macrophage polarization in atherosclerosis. Clinica Chimica Acta. 501, 142-146 (2020).
- Hörhold, F., et al. Reprogramming of macrophages employing gene regulatory and metabolic network models. PLoS Computational Biology. 16 (2), e1007657(2020).
- Han, X., Ma, W., Zhu, Y., Sun, X., Liu, N. Advanced glycation end products enhance macrophage polarization to the M1 phenotype via the HIF-1α/PDK4 pathway. Molecular and Cellular Endocrinology. , 110878(2020).
- Müller, E., et al. Toll-like receptor ligands and interferon-γ synergize for induction of antitumor M1 macrophages. Frontiers in Immunology. 8, 1383(2017).
- Soto-Heredero, G., Gómez de las Heras, M. M., Gabandé-Rodríguez, E., Oller, J., Mittelbrunn, M. Glycolysis–a key player in the inflammatory response. The FEBS Journal. , (2020).
Access restricted. Please log in or start a trial to view this content.
Reprints and Permissions
This article has been published
Video Coming Soon