A combination of solution and surface assisted synthesis opens new directions in the atomically precise synthesis of nanostructures. Scanning tunneling microscopy (STM) supplemented by non-contact atomic force microscopy (nc-AFM) enables detailed characterization of newly designed and generated carbon-based nano-objects.
Method Article
Microscopic Visualization of Porous Nanographenes Synthesized through a Combination of Solution and On-Surface Chemistry
Rafal Zuzak1 , Iago Pozo2 , Mads Engelund3 , Manuel Vilas-Varela2 , José M. Alonso2 , Enrique Guitián2 , Dolores Pérez2 , Diego Peña2 , Szymon Godlewski1
1Centre for Nanometer-Scale Science and Advanced Materials, NANOSAM, Faculty of Physics, Astronomy and Applied Computer Science, Jagiellonian University, 2Centro de Investigación en Química Biolóxica e Materiais Moleculares (CiQUS), Departamento de Química Orgánica, Universidade de Santiago de Compostela, 3Espeem S.A.R.L.
Opens in a new tab
In This Article
Summary
Loading...
$$\rightleftharpoonup{xx}$$
$$\longleftharp{xx}$$,
$$\longrightharp{xx}$$,
Abstract
Loading...
$$\rightleftharpoonup{xx}$$
$$\longleftharp{xx}$$,
$$\longrightharp{xx}$$,
On-surface synthesis has recently been regarded as a promising approach for the generation of new molecular structures. It has been particularly successful in the synthesis of graphene nanoribbons, nanographenes and intrinsically reactive and instable, yet attractive species. It is based on the combination of solution chemistry aimed at preparation of appropriate molecular precursors for further ultra-high vacuum surface assisted transformations. This approach also owes its success to an incredible development of characterization techniques, such as scanning tunneling/atomic force microscopy and related methods, which allow detailed, local characterization at atomic scale. While the surface-assisted synthesis can provide molecular nanostructures with outstanding precision, down to single atoms, it suffers from basing on metallic surfaces and often limited yield. Therefore, the extension of the approach away from metals and the struggle to increase productivity seem to be significant challenges toward wider applications. Herein, we demonstrate the on-surface synthesis approach for generation of non-planar nanographenes, which are synthesized through a combination of solution chemistry and sequential surface-assisted processes, together with the detailed characterization by scanning probe microscopy methods.
Introduction
Loading...
$$\rightleftharpoonup{xx}$$
$$\longleftharp{xx}$$,
$$\longrightharp{xx}$$,
In recent years precisely generated fragments of a graphene layer, namely, nanographenes1,2,3,4,5 and graphene nanoribbons6,7 are attracting growing attention due to perspectives for wide-ranging applications in areas such as sequencing, gas sensing, sieving, (opto)electronics, and photovoltaics. The size-limited nanostructures duplicating the graphene atomic structure retain its excellent properties such as high mobility of charge carriers or mechanical strength. However, obtaining a high degree of control over the desired tunable properties requires precision and repeatability down to single atoms in the chemical synthesis. While the traditional solution chemistry has reached an unbelievably high level of development and allows the synthesis of an extremely wide range of molecules with the necessary precision and repeatability, additionally achieving excellent efficiency, the synthesis of atomically pure and precise extended nanostructures remains still a challenge. One of the significant difficulties seems to be the decreasing solubility of increasingly larger nanostructures. Among different approaches that are regarded as promising to overcome these difficulties the combination of wet and on-surface approach has been widely developed in recent years8,9,10,11,12,13,14. This strategy is based on preparation of stable, soluble and well-structured molecular precursors, which are generated through solution chemistry. Further, the precursors are deposited onto the atomically clean crystalline surfaces, usually in ultra-high vacuum (UHV) conditions. Subsequently, on-surface processes are triggered, often assisted by the catalytic activity of the surface10,15. Such approach has been proven especially powerful in the generation of graphene nanoribbons6,7, which are often created by the combination of polymerization15 and cyclodehydrogenation6,7,16 processes14. Undoubtedly, the most widely established protocols lead to covalent bonding of molecular precursors and internal transformations enabling planarization through the formation of new benzenoid rings14. The desire to obtain a higher degree of control over the properties of molecular nanostructures generated in this way forces the search for paths that allow going beyond the hexagonal rings, while maintaining atomic precision. This could be achieved through deliberate design and synthesis of molecular precursors that could evolve in sequential transformations through intermediate structures17,18. Such an approach has proven to be efficient (e.g., in generation of porous nanostructures like nanoporous graphene19 or nanographenes with embedded annulene rings8,17,18). The success of the on-surface synthesis approach is possible thanks to the introduction of new research methods in recent decades, which enable insight into the local atomic structure of molecules with unprecedented precision. This could be achieved with scanning tunneling microscopy (STM)20,21,22 and more recently even at greater resolution with non-contact atomic force microscopy (AFM) with functionalized tips providing bond-resolved images23. Here we present the synthesis of trigonal porous nanographenes, which are generated through the combination of solution chemistry with surface assisted processes17. Further we demonstrate the atomically precise visualization of the generated nano-objects based on STM, STS (scanning tunneling spectroscopy) and nc-AFM (non-contact atomic force microscopy) techniques17.
In this report the preparation procedures of the specially designed molecular precursor (i.e. dodecaphenyl[7]starphene) is described in section 1. Further, in section 2 we describe a procedure of clean Au(111) UHV preparation. This is followed by the presentation of the procedure leading to precursor deposition onto the Au(111) surface kept in UHV conditions. These procedures are described in detail in section 3. Subsequently, in section 4 we present a detailed protocol leading to the on-surface synthesis of trigonal porous nanographenes through deliberate annealing triggering sequential cyclodehydrogenation processes. The STM measurements and the dI/dV mapping of the electronic clouds are described in section 5. Finally, section 6 is devoted to show how to functionalize the nc-AFM tip and perform bond-resolved measurements in order to doubtlessly unravel the structure of the on-surface generated nanographenes.
Protocol
Loading...
$$\rightleftharpoonup{xx}$$
$$\longleftharp{xx}$$,
$$\longrightharp{xx}$$,
NOTE: The reaction to obtain dodecaphenyl[7]starphene (Figure 1) was carried out in solution, under argon, using oven-dried glassware. All the experimental procedures related with the synthesis and purification of this compound have been performed in a fume hood. The surface experiment has been performed using low-temperature (LT) STM/AFM system with the application of the Au(111) crystal and molecular precursors evaporated and subsequently annealed in the UHV conditions (Figure 2).
1. Synthesis of dodecaphenyl[7]starphene (Figure 1)
- Add 95 mg of commercially available 5,6,7,8-tetraphenyl-2-(trimethylsilyl)-3-naphthyl triflate, 16.5 mg of Pd(PPh3)4 and a Teflon coated magnetic stirring bar to a Schlenk flask.
- Apply a vacuum to the Schlenk flask to evacuate the atmospheric gas. Refill with argon.
- Add 12 mL of a mixture of anhydrous CH3CN/THF (5:1) to the flask.
- Add 65 mg of anhydrous and finely powdered CsF.
- Heat (60 °C) and stir the reaction mixture under argon for 16 hours.
- Filter the reaction mixture over a filter funnel (borosilicate glass, pore size: 10-20 µm). Wash the solid sequentially with 10 mL of CH3CN (twice) and 10 mL of Et2O (twice). Discard the solvents.
- Extract the resulting solid in a Soxhlet apparatus using 50 mL of CHCl3 for 16 hours.
- Remove CHCl3 under reduced pressure to obtain 23 mg of docecaphenyl[7]starphene as a white solid, which is used as a nanographene precursor.
2. Preparation of the atomically clean Au(111) surface
- Use nitrile gloves to protect the sample from contamination. Before using, wash the gloves with alcohol.
- Rinse the Au crystal (Au(111) monocrystalline) in the ultrasonic scrubber filled with acetone and subsequently isopropanol. Have the sample undergo 5 min of rinsing completely submerged in each of the solvents.
- Mount the Au(111) monocrystal on the sample holder compatible with the LT-STM transfer system by two thin tantalum metal strips welded tightly to the sample holder.
- Transfer the sample to the UHV system and heat above 100 °C for approximately one hour to remove the contamination from the surface, especially water. Afterwards transfer the sample into the preparation chamber and anneal it to 450 °C by the resistive heater mounted in the preparation chamber. Control the temperature by the thermocouple (type K); the process duration is estimated to 15 min.
- Before the sputtering, calibrate the gun with luminophore. Adjust the distance between the gun and the sample to be within ~50 mm.
- During annealing, sputter the sample by Ar+ ions provided by the ion gun with the gas pressure set at 5 x 10⁻⁷ mbar and with the gun oriented at the angle of 45° with respect to the sample surface.
- Repeat the annealing and sputtering procedure at least three times. After three cycles check the quality of the sample by STM measurements. The appropriately prepared Au(111) surface shall exhibit the well-known herringbone pattern without any recordable contaminants (Supplementary Figure 2). If the sample is still not atomically clean, repeat the cleaning procedure.
3. Deposition of the nanographene precursor (docecaphenyl[7]starphene) on the Au(111) crystal
NOTE: The Knudsen cell must be mounted in the preparation chamber with a separate valve to allow an easy venting option (e.g., for precursors exchange without system venting).
- Close the valve between the Knudsen cell and the preparation chamber.
- Vent the Knudsen cell and take it out from the preparation chamber.
- Fill the dedicated quartz crucible with molecules. Use ~1 mg of the molecular powder.
- Place the crucible inside the Knudsen cell properly.
- Mount the Knudsen cell onto the valve at the preparation chamber and pump it down by the external vacuum pump. Do not open the valve between the preparation chamber and the Knudsen cell to avoid contamination of the preparation chamber.
- Outgas the Knudsen cell for at least 12 h at 120 °C to remove contamination. During outgassing, cool the crucibles in the Knudsen cell to room temperature (or lower) to protect the molecules in the crucible from overheating and uncontrolled evaporation.
NOTE: The procedure is applicable to the molecular precursor, which exhibits negligible vapor pressure at room temperature in UHV conditions. - When the vacuum level inside the Knudsen cell is in the low 10-10 mbar range, open the valve between the cell and preparation chamber. Subsequently close the valve between the Knudsen cell and the external pump. Further, shut down the external pump.
- In order to calibrate the molecular flux, use a quartz microbalance. Gently increase the temperature in the Knudsen cell by 5 °C for 10 min (by setting the appropriate temperature value on the Knudsen cell controller) and monitor the variation of the molecular flux by checking the quartz microbalance readout.
NOTE: The adequate flux for dodecaphenyl[7]starphene molecules is approximately 1 Hz/5 min. When the flux is stable for 5x5 min=25 min the calibration process is finished.
4. On-surface preparation of the nanographenes
- Transfer the clean Au(111) sample from the microscope chamber into the preparation chamber. Subsequently, set the clean Au(111) sample directly in line with the Knudsen cell (here the angle between the sample surface and the evaporator reads 85°), and adjust the distance between the sample and the evaporator to be within 50-100 mm. Keep the sample facing away from the Knudsen cell to avoid uncontrolled deposition of the molecular material.
- Using the Knudsen cell, deposit the molecules by rotating the sample to face the Knudsen cell and keeping the sample in such a position for t=4 min (this corresponds to approximately ~0.8 Hz readout of the quartz microbalance, that is equivalent to sublayer coverage crucial for further steps of intramolecular bond formation processes). Afterwards rotate the sample to face away from the Knudsen cell. Switch off the Knudsen cell to stop evaporation.
- Anneal the sample with molecules to predefined temperatures: (1) 320 °C for 15 min; (2) 370 °C for 15 min.
- After each annealing step, measure the sample by LT-STM/AFM to investigate the current stage of the experiment and verify the presence and type of generated objects.
- During STM measurements, set sample bias to -1.0 V and the tunneling current setpoint at 100 pA to allow distinction between differently reacted molecules (Figure 5).
5. dI/dV measurements
- Connect the lock-in amplifier to the microscope electronics: connect It to the input of the lock-in, Vext to the output of the lock-in amplifier. Connect the auxiliary output of the lock-in with the auxiliary input in microscope electronics.
- Set the lock-in parameters: frequency (560-720 Hz), amplitude (~10 mV) and time constant (10 ms).
- Gently approach to the surface by STM tip when lock-in is off. Retract 2-3 steps from the surface. Turn on the lock-in and monitor the It signal. By changing the phase of the lock-in amplifier, minimize the It signal around the zero.
- Approach to the surface; now the lock-in is ready for measurements.
- Calibrate the dI/dV on a clean Au(111) surface by looking for the position and shape of the Shockley surface state24,25,27.
- For dI/dV mapping, set the low value of the scan speed. Use the raster time in the order of 4 ms per point.
6. nc-AFM sensor functionalization
NOTE: The gas line with CO must be mounted in the microscope chamber, because CO molecules desorb from the sample at T > 40 K, so the CO molecules are deposited directly onto cooled samples stored in the cryostat. For security reasons, mount the CO detector in the vicinity of the UHV system.
- Cool down the sample in the microscope to 5 K.
- Open the leak valve with CO for t=1:30 min and set the pressure of the CO at the level of pCO=5x10⁻⁸ mbar.
- Check the sample under STM. When the tip is metallic (without the CO) the CO molecules on the Au surface exhibit a specific contrast in STM, this is shown in Supplementary Figure 3c22.
- To pick up the single CO molecule, either perform the procedure manually or set the controller into the spectroscopy mode with predefined parameters including the following steps.
- Place the tip above the CO molecule intended for pick-up at +0.5 V and 15 pA.
- Retract the tip by at least 0.3 nm.
- Ramp the voltage to +3 V.
- Return the surface to the previously predefined position (before retraction).
- Set the spectroscopy time to around 5 s and monitor the I(t) trace, the abrupt change of the I value indicates on the CO pick-up manipulation process. The above mentioned 5 s time of spectroscopy duration has been chosen in order to let the pick-up triggering last long enough to achieve reasonable balance between the efficiency of the pick-up and the reversal putting down of the CO.
- Check if the STM contrast of the CO molecule changed. The typical appearance recorded at +0.5 V, 15 pA is shown in Supplementary Figure 3b.
- The tip is functionalized by the CO molecule. If the CO molecule is lost, repeat the procedure until successful functionalization.
7. Nc-AFM with CO measurements
- Approach the surface in the STM mode.
- Perform the STM imaging. From the STM scan, choose the separated single-molecule for nc-AFM measurements.
- In STM mode, find a proper z plane parallel to the molecule plane.
- Retract the tip from the surface by approximately 0.7 nm and turn off the STM loop.
- Find a Q-plus sensor frequency, set the amplitude (~100 pm) and AFM loop parameters (~3% P-I).
- Start scanning with low scan speed.
- During scanning, approach the surface step-by-step with exemplary step reaching 0.01 nm and observe the scan until the bond-resolved image is acquired.
Results
Loading...
$$\rightleftharpoonup{xx}$$
$$\longleftharp{xx}$$,
$$\longrightharp{xx}$$,
Figure 2 represents schematically the UHV STM/nc-AFM experiments. First, the Au(111) single crystal is cleaned by cycles of annealing and simultaneous sputtering by Ar+ ions. The clean Au surface exhibits the well-known herringbone reconstruction pattern, which in STM images arises as bright ridges separated by darker area. This is already well visualized in Figure 2, where the Au(111) sample is shown as a 3D STM topographic image. The ridges of the surface reconstruction separate the fcc and hcp areas, as indicated in the inset of Supplementary Figure 2a. Figure 2 shows also relatively narrow and high isolated entities. These are precursor molecules transformed through annealing. The procedure is described below in the following paragraphs and the molecule separation is quite typical for hydrocarbon species on Au(111)28,29,30. At this point it is important to note that the preparation of a clean surface is crucial in many experiments, where contaminants may strongly influence the behavior of adsorbates of interest. The cleanliness of the Au(111) surface could be monitored in STM imaging by visualizing the herringbone pattern and inspection of most reactive sites (i.e., the elbows of the reconstruction topography, where the ridges change their direction). In the clean sample the corners shall be visualized as in Supplementary Figure 2a without any additional bumps that could correspond to contaminants.
It is also important that before characterization of electronic properties through dI/dV single point and lateral mapping spectroscopy, the tip has to be calibrated on the Au(111) surface in order to allow decoupling of the tip states from the surface and adsorbate characteristics as far as possible. This is important step, since otherwise the obtained spectroscopy data might be strongly affected by the tip apex properties and the acquired STS resonances as well as spatial images might present the complex convolution of both tip and sample properties. In order to calibrate the tip, a two-step procedure is advised. First, the high-resolution STM images of the herringbone pattern must be recorded. Second, the single point STS spectra of the bare surface shall represent the well-known feature corresponding to the Au Shockley surface state (i.e., the STS dI/dV(V) curve course shall be relatively flat with a clearly noticeable onset of the surface state at approximately -0.5 V and without any further exaggerated variations of the dI/dV signal as visualized in Supplementary Figure 2b24,25,26,27). If the recorded data do not fulfill the above requirements, the tip must be cleaned; this is often performed by gentle crashing of the tip into the sample surface until the herringbone pattern is clearly recorded and the appropriate dI/dV signal over Au(111) is achieved.
In order to allow bond resolved nc-AFM measurements, the microscope tip has to be functionalized with the CO molecule23. In the functionalization, the first step is focused on the deposition of CO molecules onto the Au(111) surface kept at cryogenic temperatures. For CO pick-up we have applied the procedure performed in a spectroscopy mode, which contains the approach over the intended for manipulation of the CO molecule, voltage ramp and further monitoring of the current versus time signal. The schematic representation of the process is shown in Supplementary Figure 3a. Further we verify the successful functionalization of the tip by recording the appearance of the CO molecules adsorbed on the surface22. Supplementary Figure 3a,b shows the typical appearance of the CO molecule on Au(111) acquired at specific tunneling conditions with (Supplementary Figure 3b, clearly visible bump in the center of the CO image) and without the CO molecule (Supplementary Figure 3c, no signs of the characteristic bump in the middle).
Figure 3 schematically shows the idea behind the sequential on-surface cyclodehydrogenation. We start from the flexible precursors (marked by a black rectangle), which are prepared by solution chemistry approach. Further, we perform the two-step surface assisted cyclodehdrogenation procedure yielding the molecular propeller intermediate (marked by a blue rectangle) with already internally fused blades and finally the non-planar nanographenes with embedded [14]annulene pores. The target molecules are shown by a red rectangle in Figure 3.
The first step of cyclodehydrogenation is achieved when the Au(111) sample with molecular precursors is annealed at 320 °C, providing isolated molecular propellers clearly visualized by STM, as indicated in Figure 4. The non-planar conformation of the molecules could be inferred from their STM appearance with clearly discernible three bright lobes marked by blue circles in Figure 4b,c.
The final cyclodehydrogenation yielding [14]annulene pores is achieved when the sample is heated up to 370 °C. Figure 5 shows the STM appearance of isolated molecules, the high resolution image shown in Figure 5b indicates on the presence of molecular mixture with single entities containing one, two three embedded pores.
Finally, the detailed structural characterization is obtained by bond-resolved nc-AFM measurements visualized in Figure 6 and subsequent characterization of the electronic states as shown in Figure 7.
![Chemical reaction diagram, synthesis of docecaphenyl[7]starphene, using Pd catalyst, organic chemistry.](/files/ftp_upload/62122/62122fig01.jpg "figure-results-1")
Figure 1. Synthetic procedure to obtain the nanographene precursor (i.e., dodecaphenyl[7]starphene) by solution chemistry. Please click here to view a larger version of this figure.
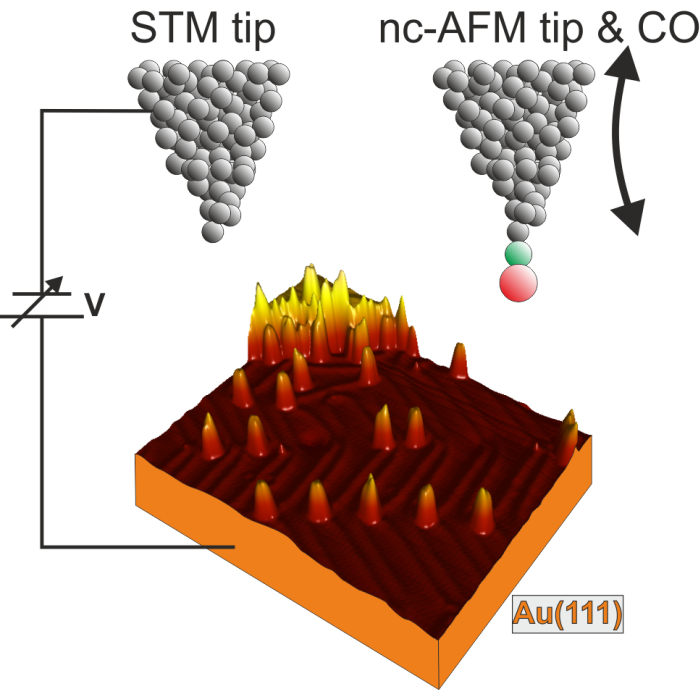
Figure 2. Scheme of the UHV STM/nc-AFM experiment. The CO molecule is displayed at the apex of the AFM tip with color coding: green - C, red - O. The two-headed arrow indicates the AFM tip oscillation motion. The 3D STM image of the Au(111) with transformed precursors is shown in the bottom. Please click here to view a larger version of this figure.
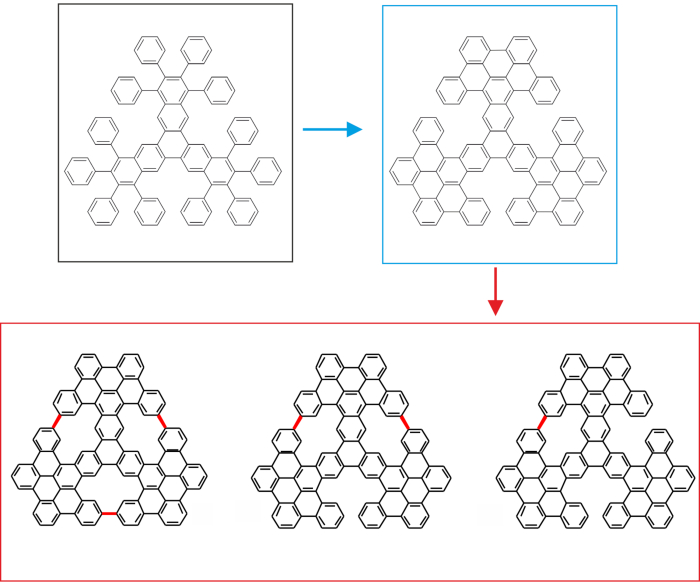
Figure 3. Scheme showing the idea of the sequential cyclodehydrogenation synthetic path. The precursor is marked by a black rectangle. The intermediate molecular propeller is indicated by the blue rectangle. The target molecules equipped with [14]annulene rings embedded are highlighted by a red rectangle. Please click here to view a larger version of this figure.
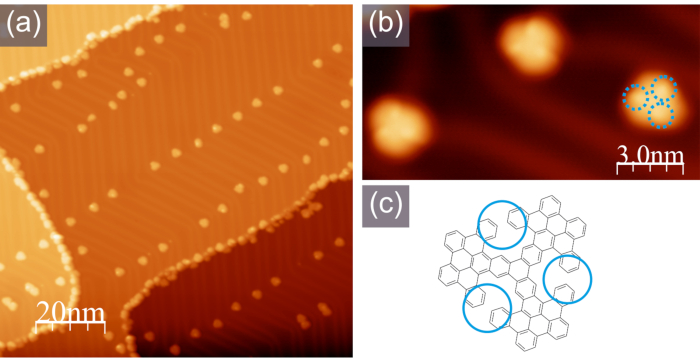
Figure 4. Typical STM appearance of the intermediate propeller. (a) A large-scale STM image; (b) A high-resolution STM image with clearly discernible bright lobes corresponding to the non-planar parts of the molecules as indicated in the scheme shown in (c), -1.0 V, 100 pA. Please click here to view a larger version of this figure.
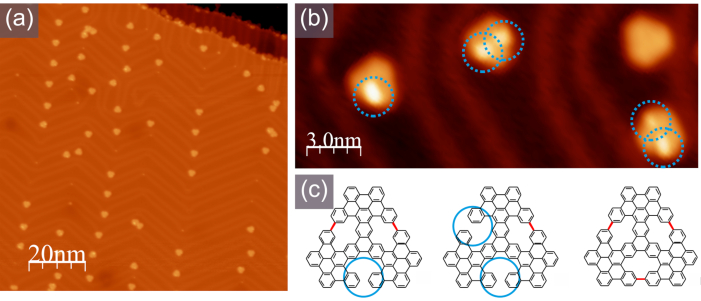
Figure 5. Typical STM appearance of the molecules with [14]annulene rings embedded. (a) A large-scale STM image; (b) A high-resolution STM image with clearly discernible bright lobes corresponding to the non-planar parts of the molecules, as indicated in the scheme shown in (c), -1.0 V, 100 pA. Please click here to view a larger version of this figure.
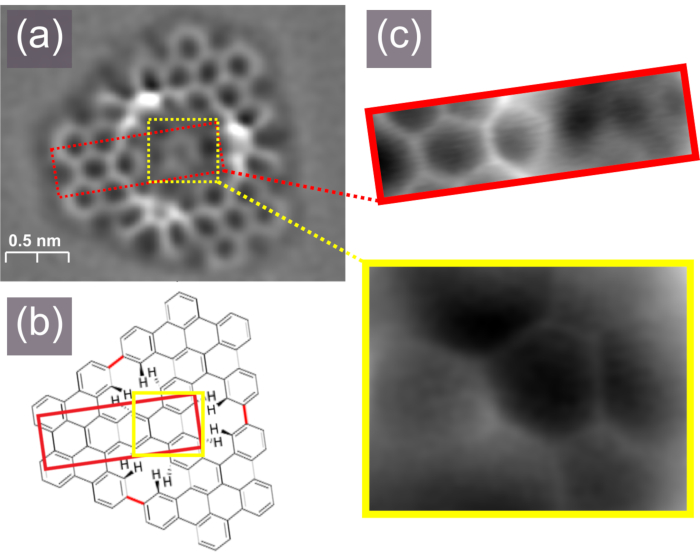
Figure 6. Bond-resolved frequency shift nc-AFM image of the trigonal porous nanographene (a) with its scheme shown in (b), smaller nc-AFM images show parts of the molecule (c). Please click here to view a larger version of this figure.
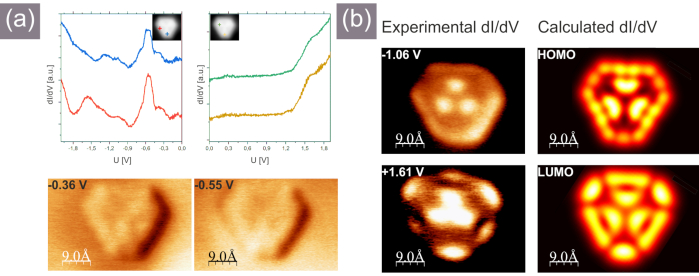
Figure 7. Scanning tunneling spectroscopy data obtained for the trigonal porous nanographene. (a) Single point STS spectra (top), dI/dV maps acquired at voltages corresponding to the onset of the Au surface state (insets in the dI/dV graphs show lateral location of the tip during spectroscopy measurements); (b) left panel - dI/dV spatial images acquired over the nanographene at voltages corresponding to resonances recorded in single point STS measurements shown in (a), right panel - calculated dI/dV images at the voltages corresponding to HOMO and LUMO states. Please click here to view a larger version of this figure.
Supplementary Figure 1. Spectroscopic characterization of docecaphenyl[7]starphene Please click here to download this File.
Supplementary Figure 2. Au(111) surface. (a) filled state high resolution STM image with clearly discernible herringbone pattern, the inset shows magnified image with marked fcc and hcp areas, -1.0 V, 100 pA, (b) typical single point STS data acquired with well-shaped metallic tip presenting the onset of the Au surface state at approximately -0.5 V. Please click here to download this File.
Supplementary Figure 3. nc-AFM tip functionalization with a CO molecule. (a) A schematic drawing of the process; (b) a typical STM image of Au(111) with CO molecules imaged with a CO functionalized tip, the CO molecule is visualized as a dark depression surrounded with a bright halo and a characteristic bright lobe in the center; (c) a typical STM image of Au(111) with CO molecules imaged with a metallic tip; the CO molecule is visualized as a dark depression surrounded with a bright halo without the characteristic bright lobe in the center, exemplary CO molecules are highlighted by white dashed circles in (b,c), +0.5 V, 15 pA. Please click here to download this File.
Discussion
Loading...
$$\rightleftharpoonup{xx}$$
$$\longleftharp{xx}$$,
$$\longrightharp{xx}$$,
For successful surface assisted synthesis and further detailed characterization, the critical steps include: (1) solution synthesis of pure precursor sample, which has to be in the range of at least 1 mg in order to allow hassle-free UHV deposition, (2) generation of large and atomically clean terraces of the Au(111) surface, (3) deposition of the appropriate amount of the molecular precursors on the sample surface, (4) preparation and application of the well-shaped STM tip for dI/dV measurements and tip functionalization for the bond-resolved nc-AFM imaging, (5) deliberate heating of the sample with detailed characterization of the annealing outcome in terms of intramolecular transformations.
The first goal is governed by the design, synthesis and purification of the nanographene precursor (docecaphenyl[7]starphene). The synthesis is done in solution, in one step from commercially available reagents as shown in Figure 1. The purification is facilitated by the insolubility of the nanographene precursor in most organic solvents. Therefore, the compound precipitates from the reaction mixture, and is then purified by washing followed by continuous extraction with hot chloroform.
The second goal is achieved by repetitive cleaning cycles with adequate monitoring of the sample temperature, which shall not exceed 450 °C. Overheating may result in the sample damage and melting. The surface quality must be verified through STM measurements and recording of the herringbone pattern without noticeable contaminants.
In order to achieve goal three, one has to gently calibrate the flux of the precursor molecules from the powder located inside the evaporator. The experiments are often performed with molecular precursors, in which the deposition temperature is not known at all and might be difficult to estimate before the trial and additionally the precursors may be fragile. Therefore, it is advised to perform the calibration slowly with small steps increasing the evaporator temperature and precise observation of the quartz microbalance display. It is reasonable to adjust the molecule flux in the range of approximately 1 Hz per 5 minutes, which depending on the particular precursor, roughly corresponds to the formation of a closed monolayer within more than 15 minutes of evaporation. Such settings allow for precise deposition of a fairly sublayer amount of the starting material, which is most appropriate for observation of intramolecular surface assisted transformations.
The fourth goal is governed by the appropriate procedure of tip formation. In case of the STM tip preparation it is of prime importance to follow the described calibration protocols on the clean Au(111) to avoid misleading STM and STS results originating from badly shaped tip, which strongly convolutes with the object of interest properties. Therefore the reference dI/dV spectra on the Au(111) surface have to be acquired and analyzed each time the tip apex is modified during measurements or when the recorded STM images or STS data arouse suspicion. In general the STM and in particular STS imaging is susceptible to misinterpretation, because the recorded data cannot be related in a straightforward manner to the topographic pattern or the electronic structure, but rather reflects the convolution. In this regard ensuring that the tip influence is minimized seems to be crucial. On the other hand, the single point STS and spatial STS mapping provide an unprecedented insight into the properties of the nanoscale objects with submolecular resolution. Here we present an example of the dI/dV single point spectroscopy and dI/dV planar mapping performed for the target trigonal porous nanographene. The results are displayed in Figure 7. Figure 7a shows the single point STS data, which are always acquired over different areas of the molecule to monitor the STS resonances intensity variations. This is an important step in order to avoid location of the tip over the molecular orbital nodal plane, which could contribute to significant suppression of the STS signal and as a consequence may lead to omission of the particular resonance. Top panels of Figure 7a show selected single point STS data recorded within the filled and empty state regimes. In order to confirm the matching of the recorded resonances with the states associated with the molecule the spatial dI/dV mapping has to be performed subsequently. The images are shown in Figure 7b, the left column presents the experimental data, while the calculated ones are displayed on the right hand side. The reasonable agreement allows to conclude that the resonance recorded experimentally at -1.06 V could be linked with dominant contribution of HOMO, while the one acquired at +1.63 V is dominated by LUMO. Importantly, we need to notice that in the filled state part of the spectra recorded over the molecule and shown in Figure 7a, there are also two other resonances located closer to Fermi level: at -0.36 V and -0.55 V. These resonances are, however, found in the range of the well-known Schockley surface state and may originate from the surface instead from the molecule itself. This is indeed indicated by the additional lateral dI/dV mapping performed at the above-mentioned voltage values. The images are shown at the bottom of Figure 7a and we can note that within the images we can only notice the reminiscent of the molecule shape without any further features, which allows to link the observed resonances with the surface state. The above description clearly points on the importance of the comparison between the experimentally recorded data and the calculations in the assignment of the single point STS resonances and spatial dI/dV maps.
The CO functionalization requires a patient approach; hence its successful realization is clearly visualized by the recording of bond-resolved images displaying the molecule backbone structure. The approach toward nc-AFM imaging shall be performed step by step and with the awareness that the AFM procedures must be usually applied much slower than typical STM measurements. At this point it is worth to note that in the presented experiment the anticipated target structure, the trigonal porous nanographene shall be flat enough to allow bond-resolved nc-AFM measurements. This is indeed proven in Figure 5a, where the frequency shift nc-AFM image is presented. The appearance of the nanographene suggests that the structure adopts a non-planar conformation due to the steric interactions between hydrogen atoms located inside the [14]annulene pores, as schematically shown in Figure 5b. The nc-AFM image also provides additional information on the details of the nanographene configuration, a quick look into Figure 5a leads to the conclusions that the central part locates closer to the Au(111) surface than the outskirts of the nanostructure. In order to better visualize the atomic structure of the nanographene, especially to show the presence of the central phenyl ring and the three arms attached, additional smaller nc-AFM images could be acquired with the scan height adjusted to different parts of the molecules. The results are presented in Figure 5c, where the central phenyl ring with three attached arms is clearly discernible within the image highlighted by the yellow rectangle and one arm is in detail visualized by the image marked by the red elongated rectangle. This proves that the different parts of non-planar molecules could be shown separately by independent scans performed with the scanning plane adjusted to the part of the structure to be visualized31. Nevertheless, it is important to note that the more non-planar objects, in our case the intermediates may serve as examples, are usually too little flat to allow bond-resolved nc-AFM measurements and the identification must be performed based on STM imaging. Nevertheless in some cases the nc-AFM can also be applied by measurements performed only over a selected area of the molecule, which exhibits more planar conformation, as described in detail on the example of the intermediate with two embedded [14]annulene pores in ref. 18.
The fifth goal achievement is based on the several repetitions of the on-surface experiment during searching for the appropriate conditions to trigger the surface assisted intramolecular transformations. In this regard each step of the experiment must be verified by STM measurements that provide the hints on the possible processes; finally it is beneficial if bond-resolved nc-AFM measurements are applied to verify the outcome of the on-surface processes.
Combined STM/nc-AFM studies of newly created molecular structures provide a detailed characterization of both structural arrangement and electronic states with sub-molecular precision. Thus, the scanning probe microscopes seem to be irreplaceable in the atomic-scale characterization of elusive and new molecular scaffolds. The combination of solution chemistry providing well-shaped and pure molecular precursors with surface assisted transformations is a powerful approach toward precise synthesis of molecules and has proven to be very successful in particular in the generation of new nanographenes and graphene nanoribbons. This opens up new perspectives form further development of synthetic strategies in order to fabricate the new generations of tunable nanostructures exhibiting the desired properties. Nevertheless, the method based on surface assisted synthesis is limited to the reaction schemes that could be applied on surfaces and the number of already established reactions is quite limited. This means that the approach could be regarded as an extension of already existing, well-developed solution chemistry protocols. It shall be mentioned that in some cases the reactions observed in the on-surface synthesis manner proceed differently than in solution, thus giving significantly different final products. This opens up perspectives for the synthesis of new compounds that cannot be generated based on existing wet chemistry pathways. One of the great limitations of the approach is also originating from the very limited amount of the products that could be generated, as well as from sometimes observed low efficiency. The microscopic characterization based on scanning probe techniques with functionalized tips offers unprecedented insight into the atomic structure of newly created compounds, but on the other hand it is very time consuming and limited to local characterization. In other words, it does not provide the global, macroscopic view of the synthesized compounds, unless the processes are highly homogeneous. This, however, shall be also determined and confirmed by other, more averaging techniques.
Disclosures
Loading...
$$\rightleftharpoonup{xx}$$
$$\longleftharp{xx}$$,
$$\longrightharp{xx}$$,
The authors have nothing to disclose.
Acknowledgements
Loading...
$$\rightleftharpoonup{xx}$$
$$\longleftharp{xx}$$,
$$\longrightharp{xx}$$,
We acknowledge financial support from the National Science Center, Poland (2017/26/E/ST3/00855), Agencia Estatal de Investigación (MAT2016-78293-C6-3-R and CTQ2016-78157-R), Xunta de Galicia (Centro singular de investigación de Galicia, accreditation 2019-2022, ED431G 2019/03) and Fondo Europeo de Desarrollo Regional (FEDER). IP thanks Xunta de Galicia and the European Union (European Social Fund, ESF) for awarding a pre-doctoral fellowship.
Materials
| Name | Company | Catalog Number | Comments |
|---|---|---|---|
| Au(111) monocrystal | SPL | Au (111) diameter 8 mm and 2 mm thick aligned to ~ 0.1 degree and one side polished make into model 12 | single monocrystal of Au |
| 5,6,7,8-tetraphenyl-2-(trimethylsilyl)-3-naphthyl triflate (CAS 1799510-57-8) | ABCR | AB357101 | |
| Argon gas (0.99% purity) | LindeGas | Argon 5.0 Ar 12 l 1 4950 001 | for ion sputtering |
| CH3CN | Sigma-Aldrich | 271004 | anhydrous |
| CHCl3 | vwr | 8,36,27,320 | |
| CO gas (0.99% purity) | LindeGas | Carbon monoxide 3.7 CO 12 l 1 4950 029 | for tip functionalization |
| CsF | Sigma-Aldrich | 289345 | anhydrous, finely podered, weigh in a glove box |
| Et2O | Sigma-Aldrich | 309966 | |
| Pd(PPh3)4 | Sigma-Aldrich | 216666 | Store cold under inert atmoshere, weigh in a glove box |
| PtIr wire 0.15mm | Mint of Poland | wire used for tip etching | |
| sample holder | ScientaOmicron | ||
| THF | Sigma-Aldrich | 186562 | anhydrous, 250 ppm BHT as inhibitor |
| tip holder | ScientaOmicron | tip holder LT-STM S2701-S |
References
Loading...
$$\rightleftharpoonup{xx}$$
$$\longleftharp{xx}$$,
$$\longrightharp{xx}$$,
- Ostroverkhova, O. Organic optoelectronic materials: mechanisms and applications. Chemical Reviews. 116, 13279(2016).
- Beser, U., et al. A C216-nanographene molecule with defined cavity as extended coronoid. Journal of the American Chemical Society. 138, 4322-4325 (2016).
- Ikemoto, K., Kobayashi, R., Sato, S., Isobe, H. Synthesis and bowl-in-bowl assembly of a geodesic phenylene bowl. Angewandte Chemie: International Edition. 56 (23), 6511-6514 (2016).
- He, L., et al. Trefoil-shaped porous nanographenes bearing a tribenzotriquinacene core by three-fold Scholl macrocyclization. Angewandte Chemie: International Edition. 57, 13635-13639 (2018).
- Buttrick, J. C., King, B. T. Kekulenes, cycloarenes, and heterocycloarenes: addressing electronic structure and aromaticity through experiments and calculations. Chemical Society Reviews. 46, 7-20 (2017).
- Cai, J., et al. Atomically precise bottom-up fabrication of graphene nanoribbons. Nature. 466, 470-473 (2010).
- Ruffieux, P., et al. On-surface synthesis of graphene nanoribbons with zigzag edge topology. Nature. 531, 489-492 (2016).
- Hieulle, J., et al. On-surface route for producing planar nanographenes with azulene moieties. Nano Letters. 18, 418-423 (2018).
- Ammon, M., Sander, T., Maier, S. On-Surface Synthesis of Porous Carbon Nanoribbons from Polymer Chains. Journal of the American Chemical Society. 139 (37), 12976-12984 (2017).
- Bieri, M., et al. Two-dimensional polymer formation on surfaces: insight into the roles of precursor mobility and reactivity. Journal of the American Chemical Society. 132 (46), 16669-16676 (2010).
- Bieri, M., et al. Porous graphenes: two-dimensional polymer synthesis with atomic precision. Chemical Communications. , 6919-6921 (2009).
- Mishra, S., et al. Topological frustration induces unconventional magnetism in a nanographene. Nature Nanotechnology. 15, 22-28 (2020).
- Pavliček, N. Synthesis and characterization of triangulene. Nature Nanotechnology. 542, 284-285 (2017).
- Clair, S., De Oteyza, D. G. Controlling a chemical coupling reaction on a surface: tools and strategies for on-surface synthesis. Chemical Reviews. 119 (7), 4717-4776 (2019).
- Grill, L., et al. Nano-architectures by covalent assembly of molecular building blocks. Nature Nanotechnology. 2, 687-691 (2007).
- Zuzak, R., et al. Building a 22-ring nanographene by combining in-solution and on-surface syntheses. Chemical Communications. 54, 10256-10259 (2018).
- Xu, K., et al. On-surface synthesis of a nonplanar porous nanographene. Journal of the American Chemical Society. 141 (19), 7726-7730 (2019).
- Zuzak, R., et al. Synthesis and reactivity of a trigonal porous nanographene on a gold surface. Chemical Science. 10, 10143-10148 (2019).
- Moreno, C. Bottom-up synthesis of multifunctional nanoporous graphene. Science. 360, 199-203 (2018).
- Soe, W. -H., Manzano, C., De Sarkar, A., Chandrasekhar, N., Joachim, C. Direct observation of molecular orbitals of pentacene physisorbed on Au(111) by scanning tunneling microscope. Physical Review Letters. 102, 176102(2009).
- Repp, J., Meyer, G., Stojković, S. M., Gourdon, A., Joachim, C. Molecules on insulating films: scanning-tunneling microscopy imaging of individual molecular orbitals. Physical Review Letters. 94, 026803(2005).
- Gross, L., Mohn, F., Moll, N., Liljeroth, P., Meyer, G. The chemical structure of a molecule resolved by atomic force microscopy. Science. 325 (5944), 1110-1114 (2009).
- Kichin, G., Weiss, C., Wagner, C., Tautz, F. S., Temirov, R. Single molecule and single atom sensors for atomic resolution imaging of chemically complex surfaces. Journal of the American Chemical Society. 133 (42), 16847-16851 (2011).
- Andreev, T., Barke, I., Hövel, H. Adsorbed rare-gas layers on Au(111): of the Shockley surface state studied with ultraviolet photoelectron spectroscopy and scanning tunneling spectroscopy. Physical Review B. 70, 205426(2004).
- Jung, H. S., et al. Fabrication of gate-tunable graphene devices for scanning tunneling microscopy studies with Coulomb impurities. Journal of Visualized Experiments. (101), e52711(2015).
- Kim, J. -H., et al. Direct observation of adsorption geometry for the van der Waals adsorption of a single π-conjugated hydrocarbon molecule on Au(111). Journal of Chemical Physics. 140, 074709(2014).
- Chen, W., Madhavan, V., Jamneala, T., Crommie, M. F. Scanning tunneling microscopy observation of an electronic superlattice at the surface of clean gold. Physical Review Letters. 80, 1469(1998).
- Zuzak, R., et al. Nonacene generated by on-surface dehydrogenation. ACS Nano. 11, 9321-9329 (2017).
- Zuzak, R., et al. Higher acenes by on-surface dehydrogenation: from heptacene to undecacene. Angewandte Chemie: International Edition. 57 (33), 10500-10505 (2018).
- Krüger, J., et al. Decacene: On-surface generation. Angewandte Chemie: International Edition. 56 (39), 11945-11948 (2017).
- Jelínek, P. High resolution SPM imaging of organic molecules with functionalized tips. Journal of Physics: Condensed Matter. 29, 343002(2017).
Reprints and Permissions
Request permission to reuse the text or figures of this JoVE article
Request Permission