Presented here is a procedure for measuring fundamental material properties through micromechanical tension testing. Described are the methods for micro-tensile specimen fabrication (allowing rapid micro-specimen fabrication from bulk material volumes by combining photolithography, chemical etching, and focused ion beam milling), indenter tip modification, and micromechanical tension testing (including an example).
Method Article
Micromechanical Tension Testing of Additively Manufactured 17-4 PH Stainless Steel Specimens
Opens in a new tab
In This Article
Summary
Loading...
$$\rightleftharpoonup{xx}$$
$$\longleftharp{xx}$$,
$$\longrightharp{xx}$$,
Abstract
Loading...
$$\rightleftharpoonup{xx}$$
$$\longleftharp{xx}$$,
$$\longrightharp{xx}$$,
This study presents a methodology for the rapid fabrication and micro-tensile testing of additively manufactured (AM) 17-4PH stainless steels by combining photolithography, wet-etching, focused ion beam (FIB) milling, and modified nanoindentation. Detailed procedures for proper sample surface preparation, photo-resist placement, etchant preparation, and FIB sequencing are described herein to allow for high throughput (rapid) specimen fabrication from bulk AM 17-4PH stainless steel volumes. Additionally, procedures for the nano-indenter tip modification to allow tensile testing are presented and a representative micro specimen is fabricated and tested to failure in tension. Tensile-grip-to-specimen alignment and sample engagement were the main challenges of the micro-tensile testing; however, by reducing the indenter tip dimensions, alignment and engagement between the tensile grip and specimen were improved. Results from the representative micro-scale in situ SEM tensile test indicate a single slip plane specimen fracture (typical of a ductile single crystal failure), differing from macro-scale AM 17-4PH post-yield tensile behavior.
Introduction
Loading...
$$\rightleftharpoonup{xx}$$
$$\longleftharp{xx}$$,
$$\longrightharp{xx}$$,
Mechanical material testing at the micro- and nano-scales can provide important information on fundamental material behavior through identifying length-scale dependencies caused by void or inclusion effects in bulk material volumes. Additionally, micro- and nano-mechanical testing allows for structural component measurements in small-scale structures (such as those in micro electromechanical systems (MEMS))1,2,3,4,5. Nanoindentation and micro compression are currently the most common micro- and nano-mechanical material testing approaches; however, the resulting compression and modulus measurements are often insufficient to characterize material failure mechanisms present in larger bulk material volumes. To identify differences between bulk and micro-mechanical material behavior, particularly for materials having many inclusions and void defects such as those created during additive manufacturing (AM) processes, efficient methods for micro-tension testing are needed.
Although several micromechanical tension testing studies exist for electronic and single-crystalline materials3,6, specimen fabrication and tension testing procedures for additively manufactured (AM) steel materials are lacking. Material length-scale dependencies documented in2,3,4,5,6 suggest material hardening effects in single-crystalline materials at sub-micron length-scales. As an example, observations from micro-mechanical tension testing of single-crystal copper highlight material hardening due to dislocation starvation and truncation of spiral dislocation sources4,5,7. Reichardt et al.8 identifies irradiation hardening effects at the micro scale, observable through micro-mechanical tension testing.
Micro-tensile material measurements requiring attachment of the indenter probe to the specimen are more complex than corresponding micro-compression tests but provide material fracture behavior applicable for bulk material volume predictions under more complex loading (axial tension, bending, etc.). Fabrication of micro-tensile specimens often relies heavily on Focused Ion Beam (FIB) milling from the bulk material volumes. Because FIB milling processes involve highly localized material removal (at the micro and nano-scales), large area removal through FIB milling often results in lengthy micro-specimen fabrication times. The work presented here explores a methodology to improve efficiency in micro-tensile specimen fabrication for AM 17-4PH stainless steels by combining photolithographic processes, chemical etching, and FIB milling. Additionally, procedures for the micro-mechanical tension testing of fabricated AM steel specimens are presented and testing results are discussed.
Protocol
Loading...
$$\rightleftharpoonup{xx}$$
$$\longleftharp{xx}$$,
$$\longrightharp{xx}$$,
1. Sample preparation for photolithography
- Cut a sample from the area of interest and polish it using a semi-automatic polishing machine.
- Use a slow dicing saw or a band saw to cut a section of ~6 mm from the area of interest to be studied. For this study, the material was cut from the gage section of an AM 17-4 PH fatigue specimen, as shown in Figure 1.
- Prepare the cut sample in a metallographic mount for polishing.
- Use a semi-automatic polisher to polish the sample to mirror-like surface (having a surface roughness on the order of 1 µm) starting from 400 grit abrasive paper and moving to 1 µm diamond particles. To ensure sufficient polish at each abrasion level and uniform surface abrasions, alternate the polishing direction by 90° following each grit level. Maintain a flat surface during polishing to avoid issues during a later spin coating process.
- Section the material into a thin disk.
- Protect the polished surface using an adhesive tape.
- Use a slow speed saw to align and cut a thin section (0.5-1 mm).
NOTE: An even section will be important for the spin coating process.
2. Photolithography
- Clean the sample.
- Remove the protective adhesive tape from the polished surface and place the sample with the polished surface facing up in a beaker with acetone. Use an ultrasonic cleaner to clean the sample for 5 min. Use enough acetone to cover the sample.
- Remove the sample from the acetone and dry it using compressed air.
- Submerge the sample in isopropanol and use an ultrasonic cleaner to clean the sample for 5 min. Use enough isopropanol to cover the sample.
- Remove the sample from the container with isopropanol and dry the sample with compressed air.
- Place the sample in a holding container and perform an oxygen plasma cleaning for 1 min.
- Prepare the photoresist solution in advance.
- Using a mixer, mix 27.2 g (50 wt%) of liquid PGMEA and 25.1 g (50 wt%) of SU-8 3025 for 2 min.
- De-foam the mixture for 1 min.
- Perform the photo-resist patterning.
- Place the sample (polished side up) on the spin-coater.
- Use compressed air to remove any dust or particle on the surface of the sample.
- Apply photoresist on the sample and run the spin-coater using the parameters shown in Table 1.
NOTE: The thickness of the resulting SU-8 photoresist used in this study was measured to be near 1.5 µm on average. - Place the sample on a hot plate and heat at 65 °C for 5 min.
- Heat the sample at 95 °C for 10 min.
- Remove the sample from the hot plate and allow the sample to cool to room temperature.
- Using a photomask with an array of squares measuring 70 µm on each side, expose the sample for 10-15 s at a power density of ~75 mJ/cm2.
- Heat the sample to 65 °C for 5 min on a hotplate.
- Heat the sample to 95 °C for 10 min on a hotplate and then let the sample to cool to room temperature before continuing to the next step.
- Submerge the sample (with the pattern facing up) in a clean container with propylene glycol monomethyl ether acetate (PGMEA) and agitate it for 10 min. Use enough PGMEA to cover the sample.
- Remove the sample and splash with isopropanol before carefully drying with compressed air.
NOTE: Figure 2 shows the final result of a patterned SU-8 on the sample. In Figure 2, there are locations on the steel surface having no photoresist (note the bottom-left specimen surface) likely due to uneven surface affecting the spin coat. For the purpose of this study (creating local micro-tensile specimens), it is considered a satisfactory pattern.
3. Wet-etching
- Prepare the AM 17-4PH stainless steel aqueous etchant9 shown in Table 2.
- Inside of a fume hood, place the sample in a beaker and place it on top of a hotplate at ~65-70 °C.
- Leave the sample on the hot plate for 5 min.
- With the sample on the hot plate, place a few drops of the prepared etchant so that the patterned surface is completely covered. Leave the etchant for 5 min.
- Remove the sample from the beaker and neutralize the etchant with water.
NOTE: Figure 3 shows the resulting sample after etching. Note in Figure 3 that the remaining photoresist prevents the etchant from reacting the steel surface, creating localized platform areas of unremoved material.
4. Focused Ion Beam milling of specimen geometry
- Prepare the sample for the FIB-milling process.
- Place the sample in a container with isopropanol. Use an ultrasonic cleaner to clean the sample for 5 min. Use enough isopropanol to cover the sample.
- Remove and dry the sample with compressed air.
- Using a conductive adhesive, mount the sample on a stub compatible with the nanoindentation device to be used during later testing.
- Drill a hole in a 45° SEM mounting stub and use a carbon tape to place the indenter stub and specimen on a 45° SEM stub, as shown in Figure 4.
NOTE: This step is intended to reduce direct contact with the sample once the micro tensile specimen is fabricated, decreasing the chance of damaging the sample. - Place the sample in an SEM and identify an etched square to perform the FIB milling.
NOTE: For this study, remaining material squares ~9 µm in height or larger were desired due to the chosen specimen geometry. - Orient the chosen FIB location at the top of the SEM stub to avoid contact issues during alignment in the SEM.
- Perform FIB milling.
NOTE: A SEM operated at 30 kV was used in this study. Although a specific procedure cannot be outlined, as it requires adjustment based on specific equipment, milling from outside to inside is a good practice to avoid material re-deposition within the specimen location. Additionally, it is good practice to use maximum energy to remove bulk material, but reduce the FIB energy while approaching the final specimen dimensions.- Use the maximum power (20 mA, 30 kV) to remove any undesired bulk material from the remaining etched platform as shown in Figure 5.
- Use lower power (7 mA, 30 kV) or (5 mA, 30 kV) to make a rectangle with slightly larger dimensions than needed for the final specimen geometry (see Figure 6).
- With even lower power (1 mA, 30 kV) or (0.5 mA, 30 kV), perform cross section cuts near to the final micro-tensile specimen dimensions.
NOTE: Following this FIB step (shown in Figure 7), the sample should have the required outer dimensions but should be missing the dog-bone shape profile. - Rotate the sample at 180°.
- Using low power (0.5 mA, 30 kV) or (0.3 mA, 30 kV), perform the final FIB milling step to create the specimen geometry desired. Create and use bitmap to control the FIB intensity and location for the repeatability in the creation of final geometry for multiple specimens.
NOTE: Figure 8 shows an SEM image of the resulting micro-tensile specimen fabricated from the steps described in sections 4.2.1 through 4.2.5. Dimensions of the tensile specimen are shown in Figure 9.
5. Grip fabrication
- Make alignment marks on the nanoindentation tip to be used for tensile testing.
- Mount the tip on the desired nanoindentation transducer.
- Using a laser scribe, make two alignment marks near the tip, as shown in Figure 10, to allow for proper tip orientation prior to fabrication of the tensile grip through FIB milling. Use a circular notch and linescribe as two alignment sources as the tip rotates during fabrication of the tensile grip geometry.
- FIB-mill the nanoindentation tip to make the tension grip.
- Place the marked tip on a SEM stub and align the markings as shown in Figure 10.
- Using the FIB, reduce the width of the indenter tip as shown in Figure 11A.
NOTE: Reducing the indenter tip width is helpful in the maneuverability and clearance of the final tensile grip during tension testing. - Remove the indenter tip from the SEM, use the alignment marks to rotate the tip at 90°. Use the FIB as shown in Figure 11B to reduce the thickness of the indenter tip.
- Remove the indenter tip from the SEM. Use the alignment marks back to 0° (front view) and create the final tensile grip geometry with the FIB as shown in Figure 11C. To reduce re-deposition of the removed material during the FIB process, remove the narrow tensile grip area before removing the wider grip area.
6. Micro-tensile test
- Mount the specimen and indenter tip on the nanoindenter device.
- Install the nanoindentation machine in the SEM following the manufacturer's recommendations. To ensure adequate imaging during in situ testing, avoid significant machine tilt.
NOTE: For this test, a tilt of 5° was used. Excessive tilting will result in a perspective view and make it difficult to align the tensile grip with the test sample. - To prevent an unexpected event during the tensile testing, perform the desired displacement-based tensile loading protocol in air, away from the sample.
NOTE: This air displacement test will preserve the fabricated tensile grip in the event of unexpected displacements during the protocol. - With caution, slowly approach the tip to the sample's surface.
- Move and align the tensile grip with the test sample, as shown in Figure 12.
- Perform the tensile test.
NOTE: The test performed in this study considered a displacement-controlled protocol at a rate of 0.004 µm/s (resulting in an applied strain rate of 0.001 µm/ µm/s for the 4 µm tall specimen), a maximum displacement of 2.5 µm, and a returning rate of 0.050 µm/s. To perform the tensile test in the transducer used for this test, a negative displacement indentation (-2.5 µm) and negative rate (-0.004 µm/s) was used.
Results
Loading...
$$\rightleftharpoonup{xx}$$
$$\longleftharp{xx}$$,
$$\longrightharp{xx}$$,
A material sample from an AM 17-4 PH stainless steel specimen (previously tested in low-cycle fatigue) was prepared and tested using the protocol described, to understand the fundamental material behavior of AM metals (independent of structural defect influence). Typical sample volumes used for material characterization can contain distributed fabrication/structural defects that make discerning between actual material behavior and structural fabrication effects difficult. Following the protocol described in sections 2 through 6 a micro specimen was fabricated and tested to failure in tension, successfully demonstrating the described techniques and producing material test data at scales free from volumetric defect influences. Prior to micro-mechanical testing, X-ray diffraction (XRD) spectra from the prepared steel surface (see Figure 13), show a mostly martensitic grain structure as would be expected from a previously strained material10.
Figure 14 shows the resulting load-displacement behavior of the micro-tensile AM 17-4PH steel sample, having a maximum tensile strength of 3,145 µN at a displacement of 418 nm. From in situ SEM observations during loading, fracture of the micro-specimen occurred along a single slip plane (typical of a ductile single crystal failure) and different from typical post-yield strain hardening behavior observed during macro-scale material tension testing of AM 17-4PH stainless steels. Frames 4-6 of Figure 14 show the single failure slip plane during tension testing of the fabricated micro specimen.
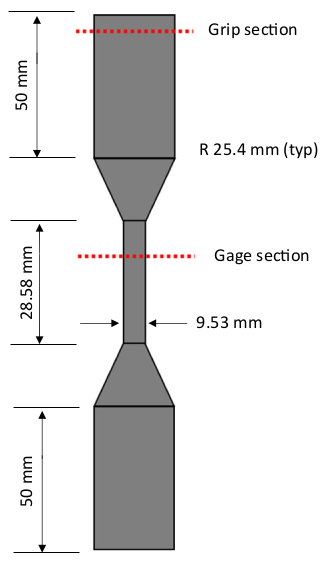
Figure 1: Bulk material where the sample was taken from. The material sample for micro-mechanical testing (~6 mm in thickness) was cut from the gage section of an AM 17-4 PH fatigue specimen. Please click here to view a larger version of this figure.
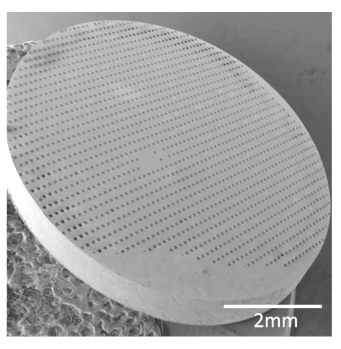
Figure 2: Material section having an array of squares (70 µm x 70 µm) patterned using photolithography. The 70 µm x 70 µm photoresist array allows for selective etching of the steel surface for bulk surface material removal. Please click here to view a larger version of this figure.
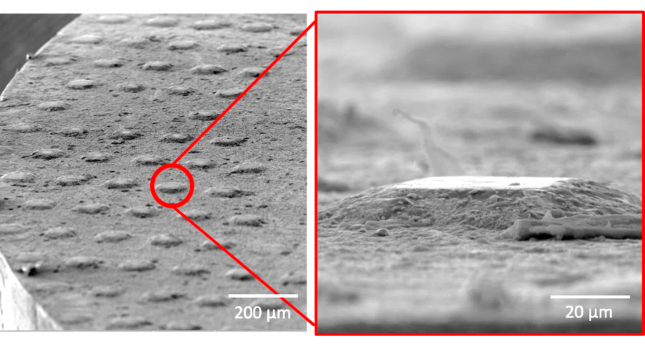
Figure 3: SEM images of the AM 17-4PH steel surface following etching. Surface high-relief locations created by the protective photoresist pattern following etching allow micro-specimen fabrication above the specimen surface elevation. Please click here to view a larger version of this figure.
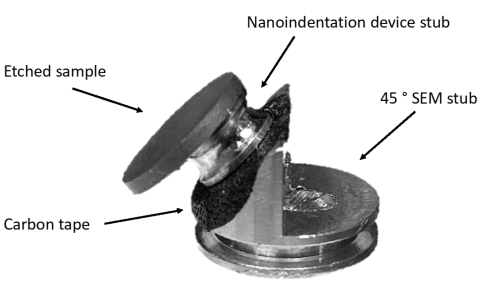
Figure 4: Sample holder set-up that helps the direct contact of the sample once the micro-tensile specimen is fabricated. The etched AM 17-4 PH sample is placed on the nanoindentation device stub before being mounted to a 45-degree SEM stub (using carbon tape) to reducing handling of the specimen after micro-specimen fabrication. Please click here to view a larger version of this figure.
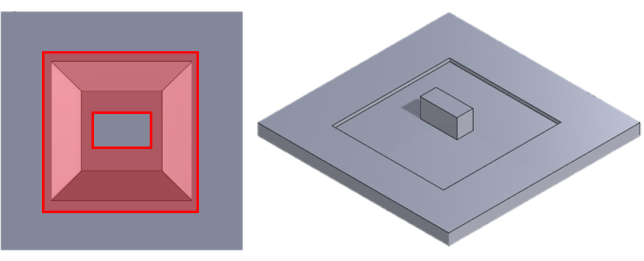
Figure 5: Illustration of first FIB milling step with area to be removed by FIB (left), and remaining material (right). The surface high-relief material remaining after etching is removed using FIB milling, leaving a rectangular volume of material. Please click here to view a larger version of this figure.
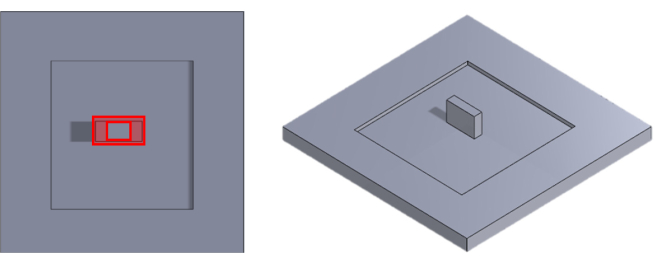
Figure 6: Illustration of second FIB milling step. The rectangular volume of material is further reduced using FIB milling, approaching the desired specimen outer dimension tolerances. Please click here to view a larger version of this figure.
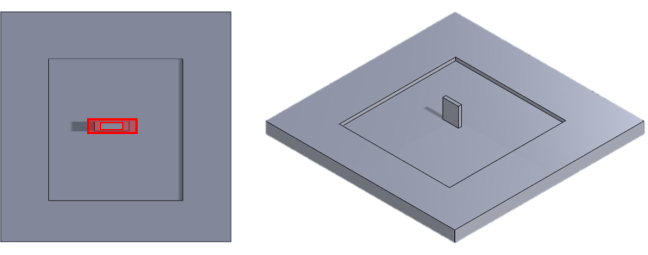
Figure 7: Illustration of third FIB milling step. The remaining material volume is refined using FIB milling to the desired specimen outer dimension tolerances. Please click here to view a larger version of this figure.
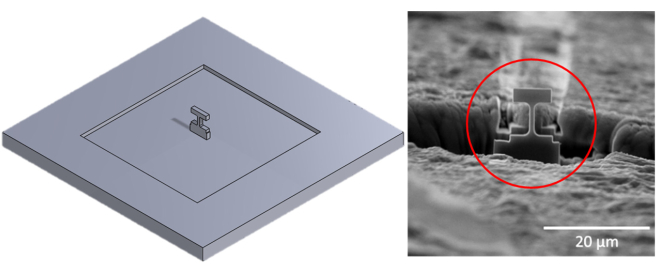
Figure 8: SEM image of a micro-tensile sample. Using FIB milling, the profile of the remaining material volume is reduced to create the final micro-tensile specimen geometry. Please click here to view a larger version of this figure.
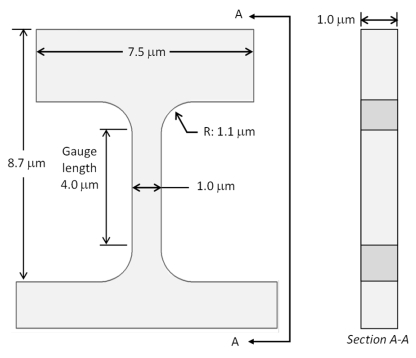
Figure 9: Micro-tensile specimen dimensions. Between the specimen grip areas, a reduced cross-sectional dimension measuring 1 μm by 1 μm is located within a 4μm gauge length. Please click here to view a larger version of this figure.
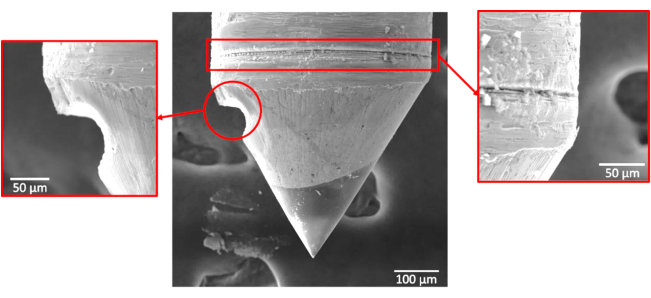
Figure 10: Alignment marks performed in the tip for reference. A semi-circular edge hole and circumferential scribe mark provide two sources of indenter tip alignment prior to fabrication of the tensile grip. Please click here to view a larger version of this figure.
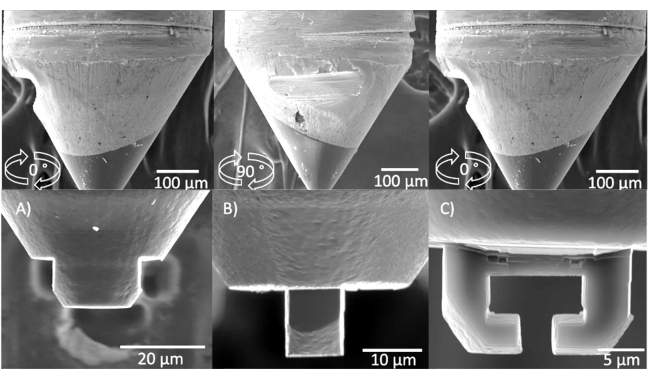
Figure 11: Sequential tensile grip fabrication steps. (A) Formation of tensile grip outer profile using FIB milling. (B) Reduction in tensile grip thickness following 90° rotation. (C) Formation of tensile grip inner profile from original orientation. Please click here to view a larger version of this figure.
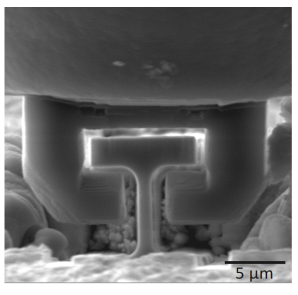
Figure 12: Grip and sample aligned to perform the tensile test. The fabricated tensile grip is positioned around the micro-tensile specimen such that an upward movement of the tensile grip will engage with the specimen. Please click here to view a larger version of this figure.
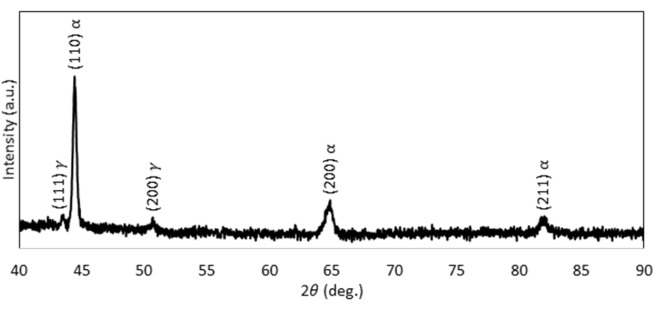
Figure 13: XRD spectra of tested sample. Shown is the relationship between X-ray scatter intensity and sample angle. Please click here to view a larger version of this figure.
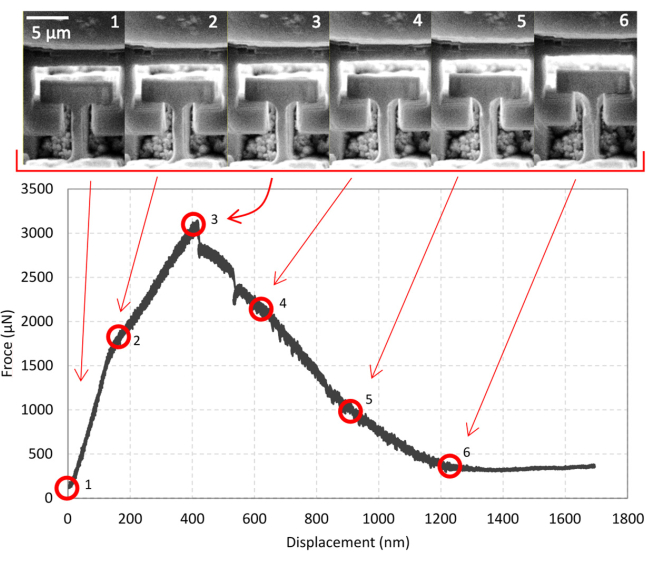
Figure 14: Tensile load-displacement curve of AM 17-4 PH Steel. (Top) Frame-by-frame progression of applied specimen displacement. (Bottom) Resulting sample behavior comparing measured load (in μN of force) and applied displacement (in nm), indicating a material ultimate strength of 3,145 μN at an applied displacement of 418 nm. Please click here to view a larger version of this figure.
| Process | Details | Time (s) |
| Acceleration | From 0 to 500 rpm at 100 rpm/s | 5 |
| Spin | 500 rpms | 5 |
| Acceleration | From 500 rpm to 3,000 rpm at 500 rpm/s | 5 |
| Spin | 3,000 rpm | 25 |
Table 1: Parameters used for the spin-coating. Process steps are to be performed consecutively.
| FeCl3 (wt%) | HCl (wt%) | HNO3 (wt%) |
| 10 | 10 | 5 |
Table 2: Chemical composition of the etchant used for AM 17-4PH Stainless Steel9. All solution chemical quantities are listed as percentage by weight.
Discussion
Loading...
$$\rightleftharpoonup{xx}$$
$$\longleftharp{xx}$$,
$$\longrightharp{xx}$$,
A verified methodology for AM 17-4PH stainless steel micro-specimen fabrication and tension testing were presented, including a detailed protocol for fabrication of a micro-tensile grip. Specimen fabrication protocols described result in improved fabrication efficiency by combining photolithography, wet-etching, and FIB milling procedures. Material etching prior to FIB milling helped to remove bulk material and reduce material re-deposition that often occurs during FIB use. The described photolithography and etching procedures allowed for fabrication of the micro-tensile specimens above the surrounding material surface, providing clear access for the tensile grip prior to testing. While this protocol was described and performed for micro-tensile testing, the same procedures would be helpful for micro-compression testing.
During the development of this process, variation within the photo-resist mask patterning was noticed, as shown in Figure 2. This is likely caused by surface inconsistencies created during dicing or poor adhesion of the photoresist to the sample surface. It was noticed that when wet etching was performed at room temperature, much of the photoresist was removed, due to under etching or poor adhesion; therefore, it is recommended to warm the sample before and during the etching process, as mentioned in the protocol. If significant under-etching (etching below the photoresist) is noticed, increasing the sample temperature may help. The provided protocol uses an SU-8 photoresist due to availability; however, other photoresist and etchant combinations may also be effective.
Tensile-grip-to-specimen alignment and sample engagement were the main challenges of micro-tensile testing. By reducing the indenter tip dimensions as described in the protocol, alignment and engagement between the tensile grip and specimen was improved. Due to SEM view perspective limitations, it was often difficult to tell whether the sample was within the tensile grip. Reducing the grip thickness will likely provide better perspective control.
Micro-specimen preparation and micro-tensile material testing is often a lengthy process, requiring several hours of FIB fabrication time and indenter alignment. The methods and protocols prepared herein serve as a verified guide for efficient micro-tensile fabrication and testing. Note that the micro specimen protocol allows for high throughput (rapid) specimen fabrication from bulk AM 17-4PH stainless steel volumes by combining photolithography, chemical etching, and focused ion beam milling.
Disclosures
Loading...
$$\rightleftharpoonup{xx}$$
$$\longleftharp{xx}$$,
$$\longrightharp{xx}$$,
The authors declare that they have no competing financial interests.
Acknowledgements
Loading...
$$\rightleftharpoonup{xx}$$
$$\longleftharp{xx}$$,
$$\longrightharp{xx}$$,
This material is based upon work supported by the National Science Foundation under Grant No. 1751699. In-kind support of AM material specimens provided by the National Institute of Standards and Technology (NIST) is also acknowledged and appreciated.
Materials
| Name | Company | Catalog Number | Comments |
|---|---|---|---|
| 45 ° SEM stub | TED Pella | 16104 | https://www.tedpella.com/SEM_html/SEMpinmount.htm |
| Acetone | VWR | CAS: 67-64-1 | https://us.vwr.com/store/product/4533063/acetone-99-5-acs-vwr-chemicals-bdh |
| Branson 1510 Ultrasonic Cleaner | Branson Ultrasonic | ||
| Carbon conductive tabs | PELCO image tabs | 16084-20 | https://www.tedpella.com/SEMmisc_html/semadhes.htm.aspx#16084-4 |
| CrystalBond | |||
| FEI Nova Nanolab 200 Dual-Beam Workstation | |||
| Ferric Chloride | VWR | CAS: 7705-08-0 | https://us.vwr.com/store/product/7516265/iron-iii-chloride-anhydrous-98-pure |
| Hydrochloric Acid (12.1M) | EMD | CAS: 7647-01-0, HX0603 | https://www.emdmillipore.com/US/en/product/Hydrochloric-Acid,EMD_CHEM-HX0603 |
| Hysitron PI-88 | Bruker | ||
| ISOMET Low Speed Saw | Buehler | 11-1180-160 | |
| Isopropanol | VWR | CAS: 67-63-0 | https://us.vwr.com/store/product/4549282/2-propanol-99-5-acs-vwr-chemicals-bdh |
| ISOTEMP Hot Plate | Fisher Scientific | https://www.fishersci.com/shop/products/fisherbrand-isotemp-hot-plate-stirrer-ambient-540-c-ceramic/p-9078002 | |
| Kapton Tape | |||
| Metaserv 2000 Grinder/Polisher | Buehler | ||
| Nitric Acid (68-70%) | VWR | CAS:7697-37-2MW, BDH3130 | https://us.vwr.com/store/catalog/product.jsp?catalog_number=BDH3130-2.5LP |
| PE-25 Serie Plasma System | Plasma Etch | PE-25 | https://www.plasmaetch.com/pe-25-plasma-cleaner.php |
| PGMEA | J.T. Baker | CAS: 108-65-6 | https://us.vwr.com/store/product/4539301/2-methoxy-1-methylethyl-acetate-pgmea-99-0-by-gc-stabilized-bts-220-j-t-baker |
| PhenoCure Compression Mounting Compound | Buehler | 20-3100-080 | https://shop.buehler.com/phenocure-blk-powder-5lbs |
| PI-88 Sample mount | Bruker | 5-2238-10 | |
| PI-FIB STOCK | Bruker | TI-0280 | |
| SimpliMet 4000 Mounting Press | Buehler | https://www.buehler.com/simpliMet-4000-mounting-press.php | |
| Spin Coater | Laurell Technologies Copr. | WS-650MZ-23NPPB | |
| SU-8 3025 | Kayaku Advanced Materials (MicroChem) | Y311072 0500L1GL | https://www.fishersci.com/shop/products/su-8-3025-500ml/nc0057282 |
| Tescan VEGA 3 SEM | |||
| Thinky AR-1000 Conditioning Mixer | Thinky | AR-100 | https://www.thinkymixer.com/en-us/product/ar-100/ |
References
Loading...
$$\rightleftharpoonup{xx}$$
$$\longleftharp{xx}$$,
$$\longrightharp{xx}$$,
- Ju-Young, K., Jang, D., Greer, J. R. Tensile and compressive behavior of tungsten, molybdenum, tantalum and niobium at the nanoscale. Acta Materialia. 58 (7), 2355-2363 (2010).
- Kihara, Y., et al. Tensile behavior of micro-sized specimen made of single crystalline nickel. Materials Letters. 153, 36-39 (2015).
- Julia, R. G., Kim, J. Y., Burek, M. J. The in-situ mechanical testing of nanoscale single-crystalline nanopillars. JOM: The Journal of Minerals, Metals & Materials Society. 61 (12), 19(2009).
- Kiener, D., et al. A further step towards an understanding of size-dependent crystal plasticity: In situ tension experiments of miniaturized single-crystal copper samples. Acta Materialia. 56 (3), 580-592 (2008).
- Sumigawa, T., et al. In situ observation on formation process of nanoscale cracking during tension-compression fatigue of single crystal copper micron-scale specimen. Acta Materialia. 153, 270-278 (2018).
- Kim, J. -Y., Julia, R. G. Tensile and compressive behavior of gold and molybdenum single crystals at the nano-scale. Acta Materialia. 57 (17), 5245-5253 (2009).
- Kiener, D., Minor, A. M. Source truncation and exhaustion: insights from quantitative in situ TEM tensile testing. Nano Letters. 11 (9), 3816-3820 (2011).
- Reichardt, A., et al. In situ micro tensile testing of He+ 2 ion irradiated and implanted single crystal nickel film. Acta Materialia. 100, 147-154 (2015).
- Nageswara Rao, P., Kunzru, D. Fabrication of microchannels on stainless steel by wet chemical etching. Journal of Micromechanics and Microengineering. 17 (12), 99-106 (2007).
- Okayasu, M., Fukui, H., Ohfuji, H., Shiraishi, T. Strain-induced martensite formation in austenitic stainless steel. Journal of Material Science. 48, 6157-6166 (2013).
Reprints and Permissions
Request permission to reuse the text or figures of this JoVE article
Request Permission