This protocol provides detailed steps for an object location task with four repetitions using the same cohort of rats. Weak and strong encoding can produce short- and long-term memories. The flexibility of the protocol with repetition can be beneficial for studies involving surgical operations by saving time and labor.
Method Article
A Within-Subject Experimental Design using an Object Location Task in Rats
* These authors contributed equally
In This Article
Summary
Abstract
Object place recognition is a prominent method used to investigate spatial memory in rodents. This object place recognition memory forms the basis of the object location task. This paper provides an extensive protocol to guide the establishment of an object location task with the option of up to four repetitions using the same cohort of rats. Both weak and strong encoding protocols can be used to study short- and long-term spatial memories of varying strength and to enable the implementation of relevant memory-inhibiting or -enhancing manipulations. In addition, repetition of the test with the counterbalancing presented here allows the combination of results from two or more tests for within-subject comparison to reduce variability between rats. This method helps to increase statistical power and is strongly recommended, particularly when running experiments that produce high variation in individual behavior. This directly refines the study by increasing the data obtained from each animal and reducing the overall number of animals needed. Finally, implementation of the repeated object location task increases the efficiency of studies that involve surgical procedures by saving time and labor.
Introduction
Spontaneous recognition tasks (e.g., object recognition, object place recognition) have been utilized to a great extent in the investigation of memory in rodents. These tests are unlike the variety of tests used for assessing memory that are based on either fear conditioning or reward motivation, in that spontaneous recognition tasks are based solely on spontaneous exploratory behavior towards new stimuli. This behavior, referred to as 'neotic preference'1, is inherent in rodents as well as in other mammalian species and some non-mammalians such as birds and fish2. Object place recognition, which depends on spatial memory, can be observed using the object location task (also known as spatial object recognition task)3. Lesion studies have shown that object place recognition requires an intact hippocampus4,5. Because of the relatively simple training protocol and the absence of any reinforcement, this task is preferable in many studies. The absence of both positive and negative reinforcement minimizes the additional parameters and brain regions that might drive the behavior. Hence, behavior here is neutral and is based on curiosity and spatial memory, allowing the investigation of mechanisms that are involved in encoding, consolidation, and retrieval of the spatial memory.
The protocol for object location task typically consists of habituation sessions followed by a single session of encoding and test trials, separated by a delay period, which varies from several minutes to hours. It is strongly recommended that rats are handled beforehand to minimize the stress level of the animals, and hence, behavior that could affect recognition memory, such as aversion towards novelty. Similarly, a well-designed habituation protocol plays an essential role in preventing stress that might hinder the natural behavior of the rat during the task. However, the extent of handling and habituation varies largely between laboratories and experimenters, which may contribute to low replicability6,7,8. In the encoding trial, the rat is given time to explore an arena with two identical objects located in two designated corners. In the test trial, which is delayed by a period, the rat is given time to explore the arena with the same pair of objects, but this time one of them has been moved to a novel location. The spontaneous preference exhibited by the rats and the resulting increase in time spent exploring the object at the novel location are indicative of spatial recognition and the memory of the object locations3. Modification of the encoding trial (duration and number of repetitions) influences the strength of the memory.
Depending on the aim of the study, the length of the delay between encoding and test trials can be modified to model protein-synthesis-independent short-term memory or protein-synthesis-dependent long-term memory. Hence, the object location task can be used for a wide variety of studies by adapting the protocol as needed. Further, implementation of experimental manipulations, such as pharmacological and optogenetic interventions, are also possible between these trials, as is in vivo imaging. There are several studies9,10 that report repeated iterations of the object location task within the same rat cohort. This contrasts the traditional use in which one animal has one session with no repetitions. However, the effectiveness of these paradigms has not been thoroughly investigated, nor are there any method papers describing these. To the best of our knowledge, this is the first reported description of a protocol that describes in detail an object location task with up to four repetitions using the same rat cohort, which also systematically compares the results from each repetition. Repetitions can be used to counterbalance experimental conditions to allow within-subject comparison with reduced variability between tests. The reliable repetition of the task allows data to be pooled, meaning that sufficiently large amount of data can be generated using a relatively small number of rats. Finally, repetitions using the same rat can be beneficial in experiments involving surgical operations and implantations by lowering the number of rats required that, consequently, saves time and labor costs.
This study presents an extensive protocol detailing how to perform an object location task in adult rats using strong and weak encoding trials followed by test trials with 1-h and 24-h delays. The strong encoding protocol produces statistically significant recognition memory when tested with 1-h and 24-h delays and can thus be used to study both short-term and long-term memories upon implementation of manipulations to inhibit these memories11. In contrast, the weak encoding protocol only produces significant short-term memory when tested with a 1-h delay. The absence of long-term memory can be used to study manipulations for enhancing the retention of memory11,12. This protocol also includes detailed handling and habituation sessions, which aim to increase the replicability of the object location task. This paper also demonstrates repetition of the task in four distinct contexts with the same cohort of rats using the weak encoding protocol, which is confirmed to produce replicable and consistent results each time.
Protocol
All methods described here have been approved by the Danish National Authorities (License number: 2018-15-0201-01405) in accordance with Danish and EU animal welfare legislations.
1. Experimental setup and preparation of distinct contexts
- Object location arena with context
NOTE: The setup below is demonstrated in an enclosed soundproof box (Figure 1B) with the light source located along the edges of the ceiling and the camera located at the center of the ceiling of the box. The arena, 60 cm x 60 cm with walls that are 100-cm high (Figure 1B), is placed inside the box and is fully isolated from the surrounding room. All spatial cues are inside the arena. This simplifies the process of creating distinct contexts. A similar level of isolation from the surrounding room can be achieved by enclosing a normal open-field arena with a uniform curtain around the walls.- Obtain a square arena made of opaque, non-porous hard plastic with a minimum 60-cm width and a minimum of 50-cm height. Choose a color for the floor contrasting with the color of the rat for successful recording of rat movements by the automated software (if applicable). Place the arena either inside a box (Figure 1B) or on a platform that is enclosed by a curtain.
- To create a context, obtain a second layer of insertable walls (e.g., wall covering made of the same material as the arena, or plastic wallpaper that can be easily cleaned) in different colors and/or patterns (e.g., black, white, stripes, or dots). Insert the second layer of walls in the arena such that they are distinct from each other.
- Obtain three-dimensional (3D) spatial cues (1-2 per context) with dimensions varying between 10 cm x 10 cm x 5 cm and 20 cm x 15 cm x 15 cm (width x length x height) and have (i) distinct geometric shapes and (ii) colors that contrast the wall color. Hang them on the walls high enough so that rats cannot reach these cues.
- Obtain different pairs of objects (as many as the context number) that are non-porous, non-chewable, and easy to clean. Aim to have distinct geometric shapes and textures for each new object. Choose objects that are between 5 to 15 cm in width and height (avoid any higher objects). See Figure 1D for examples of four distinct objects (cones, footballs, rectangular prisms, and triangular prisms).
NOTE: Each object should be of similar interest to rats, so that the total exploration times for all objects are comparable. - Find the best solution for attaching the objects on the floor of the arena (e.g., using sticky mats, double-sided tape, attaching a metal plate under the object and a pairing magnet underneath the arena etc.).
- When creating another context, re-create the walls such that they contrast the distribution of color and pattern of the walls from the previous context(s). Use new 3D spatial cues that are different from, and contrasting with, all previous cues. See Figure 1C for examples of four distinct contexts.
- Obtain a light source that will ensure a diffused and equal illumination within the arena and that has a dimmer option. Adjust the light intensity to approximately 100-120 lux at the corners of the arena after creating each context. Obtain a camera and place it at the center of the ceiling of the box.
NOTE: The light intensity can be adjusted to a lower level if automated scoring software is not being used.
- Object bucket
- Obtain a bucket (>50 cm in diameter). Do not choose a square shape to avoid any resemblance to the experimental arena. Fill it with bedding material.
- Obtain 5-10 objects of different shapes and sizes (different from the objects that are going to be used in the experiment) and randomly place them all in the bucket (Figure 1A).

Figure 1: The experimental setup, including four distinct contexts and objects. (A) The object bucket for object habituation. (B) The experiment apparatus (left), enclosing the object location arena, the camera, and the light source. The experimental box and arena before context setup (middle) and arena with context setup (right). (C) Four contexts (1-4) with distinct wall colors and patterns, as well as three-dimensional spatial cues. (D) Four objects that are used in contexts 1-4, respectively. Please click here to view a larger version of this figure.
- Camera and tracking software (optional)
- Obtain software that can be used to remotely control the camera recorder and that can track rat noses. Make the software adjustments for each specific context and rat strain before each experiment.
- Counterbalancing of object locations and experimental groups
- Prepare possible combinations of object locations for encoding and test trials, and name these as counters. Create the combinations such that they cover all corners as object locations, and object movement from adjacent to diagonal corners and vice versa (Figure 2A).
- Prepare a schedule for the specific experiment, matching each rat in one experimental group with a counter. Use each pair of the two paired counters (Figure 2A) within one group, if there are enough rats. Use the same set of counters for both experimental groups in a single encoding/test session (Figure 2B). Reassign counters for the following sessions (i.e., each new context).
NOTE: Run the rats in a mixed order during encoding/test sessions (e.g., do not run all rats in one cage one after another; instead, rotate cages to ensure a calm environment within a cage of more than one rat). - When using two or more contexts to counterbalance the experimental groups (e.g., 1-h memory versus 24-h memory groups), assign rats to each group, and change the groups in the following contexts (Figure 2B).
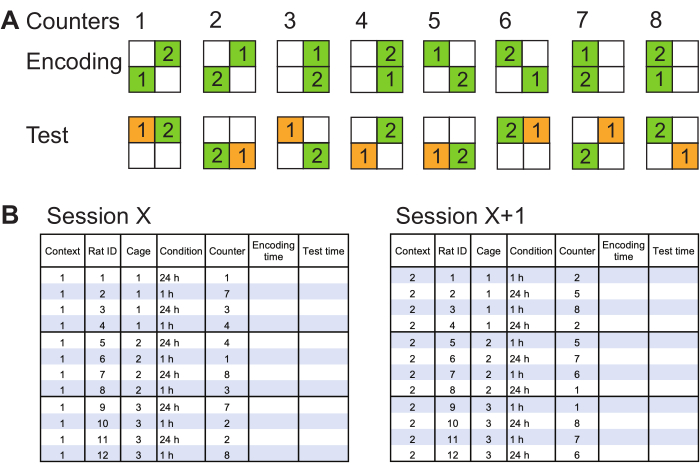
Figure 2: Representative counterbalancing methods. (A) Possible orientations of objects in the arena at encoding and test trials are named as counters. Object 1 is always the moving object. Every two counters are counterbalanced such that the location of the moving object changes. Each corner is occupied twice, and object 1 is moved from diagonal to adjacent and vice versa for an equal number of times. (B) Example of encoding/test schedule for two counterbalanced sessions (e.g., contexts 1 and 2). Rats are assigned to experimental conditions in context 1 (session X, left). A set of counter pairs (i.e., 1-2, 3-4, 5-6, and 7-8) are selected and assigned to each rat in one experimental group. The same set of counters is assigned to rats in both experimental groups. In the following session in context 2 (session X+1; right), the rats in the experimental groups are changed for counterbalancing, and a new set of counter pairs are assigned. The time at the beginning of encoding and test trials should be noted. Please click here to view a larger version of this figure.
NOTE: All handling, habituation, and encoding/test sessions in this protocol were optimized during the light phase of a 12-h light/dark cycle, and hence, it is recommended that experiments be performed during the light phase.
2. Handling and habituation
- Start handling rats beginning either from weaning (if the rats are bred in the home facility) or 2-3 weeks before the beginning of experiments (in the case that the rats are ordered from an external facility, after allowing them to acclimate for one week after arrival).
- Spend at least 10-15 min on each cage of 4 rats for 2 or 3 days a week until the rats are comfortable being touched and picked up by the experimenter. Adjust the time allocated per cage depending on the number of rats in a cage.
NOTE: It is important that all experimenters expecting to work with the rats are present during handling. - In cases where handling begins at weaning, reduce handling to a minimum (optional) once this level is reached. If beginning 2-3 weeks before the experiments, continue handling until the beginning of habituation sessions.
- Bring the rats in their cages to the experiment room to habituate the rats to the transport as well as to the experimental room. Allow rats to sit for at least 30 min to give them time to calm down and habituate. After this time, return the rats/cages to the housing room.
NOTE: Step 2.4 can be combined with handling and repeated as many times as needed. Additional habituation can be implemented at this step if the protocol includes any further manipulations (e.g., handling for the procedure of injections etc.). - Perform object habituation to habituate rats to interacting with objects and to reduce general stress levels stemming from the experience of new environments.
- For session 1, bring all home cages to the experiment room, and let the rats habituate to the room and settle for at least 30 min. Put rats (2-4 rats) from the same cage together in the bucket for 20 min. Clean the bucket by removing any fecal matter between each group of rats. Repeat the procedure for all cages. Put all rats in their home cages and return to the housing room.
- For session 2, on a separate day bring all cages to the experiment room and leave for at least 30 min. Put each rat individually in the bucket for 10 min. Place the rat back into the home cage and clean the bucket after each rat. Return all cages to the housing room.
- For session 3, repeat step 2.5.2 on a separate day.
- If the experimental apparatus is an enclosed box (Figure 1B), opt to perform empty box habituation to habituate the rats to the new experimental apparatus. In session 4, bring all cages to the experiment room and leave for at least 30 min. Place rats from the same cage together (2-4 rats) in the empty arena with no context or spatial cues (Figure 1B, middle) for 20 min. Place all rats back into the home cage, and wipe the arena with 70% ethanol after each group of rats.
NOTE: Steps 2.5 and 2.6 should be performed in a single week, preceding the context habituation week (step 2.7; see Figure 3). A break for a couple of days during these steps is acceptable. However, after starting step 2.7, each step should be performed on consecutive days as specified, until the end of test trial (step 2.9). - Perform context habituation to habituate rats to the context and 3D cues, to reduce general stress levels and to support the spatial learning of the environment.
- Modify the empty arena to create the first context as described in section 1.1, but do not put the objects in the arena. Prepare the recording equipment.
- For session 1, bring all cages to the experiment room and leave for at least 30 min. Start the recorder if doing this manually. Place the first rat in the center of the arena, and allow the rat to explore the arena for 10 min. Then, stop the recorder (if manual),and place the rat back into the home cage. Wipe the arena thoroughly with 70% ethanol after each rat, and return all cages to the housing room when finished.
- For sessions 2 and 3, repeat step 2.7.2 for each rat over two consecutive days such that there are 3 sessions of context habituation per rat in total.
NOTE: Consider shuffling the order in which rats go into the arena, especially when dealing with a large group. This avoids running specific rats repeatedly at the same time of the day.

Figure 3: The design of the behavioral experiment including handling, habituation, and object location task protocols. Rats should be handled regularly starting from few weeks prior to the habituation week. In week 0, object and experimental box habituations are carried out over 4 sessions with at least 24-h intervals in between. In week 1, context habituation is carried out over 3 consecutive sessions with 24-h intervals in between, followed by encoding and test trials. There should be a minimum of 48 h and up to 1 week interval before proceeding with the following session (e.g., begin habituation to the next context in week 2 or 3). Abbreviation: Hab., habituation. Please click here to view a larger version of this figure.
- Encoding trial (Session 4)
NOTE: In the case of pharmacological manipulations, a reasonable time to administer an agent can be either before or immediately after the encoding trial(s) and/or before the test trial depending on the nature of the pharmacological agent.- Bring all cages to the experiment room and leave for at least 30 min. Using the schedule prepared beforehand (Figure 2B), place the first identical pair of objects in the designated locations (at 2 corners and a distance of >10 cm from each respective wall; an L-shaped piece of cardboard can be used to maintain the same distance each time) by using sticky mats or double-sided tape.
- Start the recorder (if manual). Place the first rat in the arena facing a wall or a corner that is not occupied by any object (equal distance to each object).
NOTE: Follow the steps below for either weak or strong encoding. - For weak encoding (1 trial), allow the rat to explore the arena and objects for 20 min. Then, stop the recorder (if manual), and place the rat back into the home cage. Remove the objects, and wipe both the objects and the arena thoroughly with 70% ethanol.
- Repeat step 2.8.3 for all rats so that each rat receives 1 encoding trial of 20 min.
- For strong encoding (3 trials), allow the rat to explore the arena and objects for 5 min. Then, stop the recorder (if manual), and place the rat back into the home cage. Do not remove the objects. Wipe the arena and objects with 70% ethanol.
- Repeat step 2.8.5 two more times with the same rat such that there are 3 trials in total. Place the rat back into the home cage when the time is up. Remove the objects for thorough cleaning, and wipe the objects and the arena with 70% ethanol.
NOTE: Inter-trial interval for a rat should be approximately 1-2 min. - Repeat steps 2.8.5-2.8.6 for each rat.
- If the delay time is shorter than 24 h, keep the cages in the experiment room until the test trial. If not, return all cages to the housing room when completed.
- Test trial (Session 4)
NOTE: The delay period should be counted from the beginning of the encoding trial.- In case of a 24-h delay (or any delay that requires the test trial to be performed the following day), bring all cages to the experiment room, leaving sufficient time ahead of the first test so that the rats can be left for at least 30 min. According to the schedule, place the objects in the designated locations (one of the objects at a new location).
- When it is time, start the recorder (if manual). Place the first rat in the arena facing a wall or a corner that is not occupied by any object (equal distance to each object).
- Allow the rat to explore the arena and objects for 5 min. Then, stop the recorder (if manual). Place the rat back into the home cage. Remove the objects, and wipe both the objects and the arena thoroughly with 70% ethanol.
- Repeat the steps 2.9.2-2.9.3 for each rat. Return all cages back to the housing room.
NOTE: In each following encoding/test session, start the habituation protocol from step 2.7 (context habituation) after an interval of at least 48 h and up to 1 week.
3. Data analysis
- For each rat, score the exploration time for each object in both the encoding and test trials by using software designed for this purpose or using a manual setup. Score encoding trials for the whole duration. Score test trials for 2 min for best discrimination performance3. If using automated online software scoring, export the scoring data from the software.
- Count exploration time when the rat is in contact with the object, sniffing the object or facing the object at a distance less than 2 cm. Include climbing and sitting on the object as exploration unless the attention of the rat appears to be somewhere other than the object (e.g., looking away from the object).
- Calculate the total exploration time for both objects for each rat. Consider excluding any rat that has a total exploration time of less than 10 s in the test trial (for 2 min scoring) from this test, as it may reflect unreliable exploration.
- Calculate the percentage of exploration for each object (equation 1)or the discrimination index (DI) for each rat (equation 2), and calculate mean values for the groups.
 (1)
(1)

NOTE: If % exploration is 50% or DI is 0, it means that the performance is at the chance level, and the rat has no preference for either object. The mean percentage exploration and DI during encoding trials should be ~50% or 0, respectively. Any rat showing a preference higher than [mean ± (2 × SD)] for either object in the encoding trial should be excluded from the analysis of the respective test. This allows for reliable interpretation of preference in the test trial as the memory of the stable object location. This value can be calculated for an individual test or for combined encoding data from several tests. - Analyze the data by the method best fitting the experimental setup. Use a one-sample t-test for detecting a significant preference above the chance level.
- While using more than one context with counterbalancing, combine the results of the same experimental condition across contexts.
NOTE: This will result in groups that consist of the same rats, enabling within-subject comparison using a paired t-test for two groups and using repeated measures analysis of variance (ANOVA) for more than two groups.
Results
Shown here are the representative results for both the strong and weak encoding protocols described using male tyrosine hydroxylase (Th)-Cre transgenic rats13 with Long-Evans strain backcrossed four times to Lister Hooded strain and wild-type Lister Hooded rats. Th-Cre transgenic rats were used as this rat line will be used in future studies involving optogenetics. Using each protocol, memory was tested with delays of 1 and 24 h. Tests at 1 h demonstrate short-term memory, while 24-h tests demonstrate long-term memory. The exclusion value for encoding preference was calculated as described in the protocol, using the combined data from five tests (strong and weak encoding protocols) as [50.8% ± (2×10.8%)]. Rats that had an encoding preference above and below these values were excluded from the analyses of the respective tests.
For strong encoding experiments, 16 rats were used, and for weak encoding experiments, 19 rats were used. During the strong encoding trials (3 × 5 min encoding; Figure 4A), there was no significant preference for either object (52.0 ± 1.9%, n = 16, t15 = 1.1, p = 0.29; one-sample t-test versus chance level). This strong encoding protocol led to preference for the object at the novel location, as shown in terms of mean percentage exploration, which was significantly higher than the chance level (50%) in tests with both 1-h and 24-h delays (1-h memory, 77.9 ± 2.4%, n = 8, t7 = 11.8, p < 0.001; 24-h memory, 65.2 ± 5.3%, n = 8, t7 = 2.8, p = 0.025; one-sample t-test versus chance level). There was no significant difference between 1-h and 24-h memory (p = 0.056; unpaired Welch's t-test).
During the weak encoding trials (20 min encoding; results pooled from four contexts; Figure 4B), there was no significant preference for either object (51.1 ± 1.0%, n = 66, t65 = 1.2, p = 0.24; one-sample t-test versus chance level). This weak encoding protocol produced a significant increase in the preference for the object at the novel location compared to chance level in tests with a 1-h delay, but not 24-h delay (combined data from all four contexts; 1-h memory, 66.7 ± 2.0%, n = 32, t31 = 8.2, p < 0.001; 24-h memory, 49.6 ± 2.6%, n = 34, t33 = 0.16, p = 0.87; one-sample t-test versus chance level). There was a significant difference between the performance in tests with 1-h and 24-h delays (1-h memory: n = 32, 24-h memory: n = 34, t61.5 = 5.2, p < 0.001; unpaired Welch's t-test).
Memory at the group level was not observed in the 24-h delay test as indexed by chance-level performance, but showed individual variations. This higher variation for weak to no-memory conditions (e.g., 24-h test) was commonly observed due to more random exploration of the objects. Hence, it is important not to interpret the performance of rats individually. Instead, distribution of individual data points can be used along with the group average as the reliable outcome of the test. The stronger the encoding, the more uniform the behavior of the rats becomes, and the fewer the number of rats needed for reaching statistical significance, as can be observed in Figure 4A for the strong encoding protocol. In contrast, larger groups are needed for obtaining reliable results for weak conditions (Figure 4B).
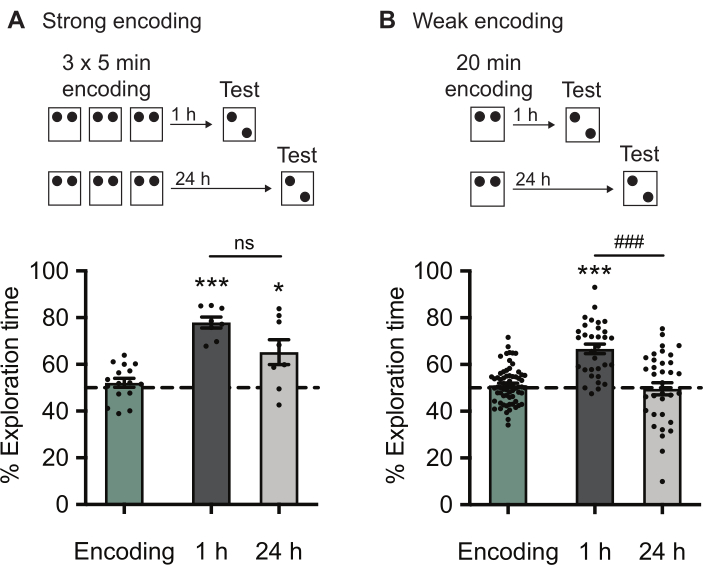
Figure 4: Memory performance after strong and weak encoding. (A) The strong encoding trial (3 × 5 min encoding) followed by either 1-h or 24-h test trials. There was no significant preference for either object during encoding trials (n = 16). The strong encoding produced significantly increased preference for the object at the novel location in the tests with both 1-h and 24-h delays compared to chance level (1-h and 24-h memory: n = 8 in each group). There was no significant difference between groups. (B) The weak encoding trial (20 min encoding) followed by either 1-h or 24-h test trials. There was no significant preference for either object as a group during encoding trials (n = 66). The weak encoding produced significantly increased preference for the object at the novel location in the test with a 1-h, but not 24-h delay, compared to chance level (1-h memory: n = 32; 24-h memory: n = 34). There was a significant difference between the performance in tests with 1-h and 24-h delays. The results were pooled from four contexts. Individual data points are presented as dots. All bars show the percentage of exploration of the object at novel location as mean ± SEM. *p < 0.05, ***p < 0.001; one-sample t-test versus chance level (50%, dashed line). ###p < 0.001; ns, not significant; unpaired Welch's t-test. Please click here to view a larger version of this figure.
A significant advantage of this established protocol is that it can be performed four times using four distinct contexts (Figure 1C) with the same cohort of rats. The results shown in Figure 5 demonstrate one possible way of using counterbalancing with two experimental groups (1-h and 24-h memory groups). The two groups were counterbalanced over two contexts (contexts 1 and 2), and this was repeated in two additional contexts (contexts 3 and 4; Figure 5A). The results from the four contexts are presented individually in Figure 5B,D, where the memory for each experimental group was assessed by comparing the preference to chance level in each context (1-h memory: Context 1, 69.9 ± 3.6%, n = 9, t8 = 5.5, p < 0.001; Context 2, 65.6 ± 3.9%, n = 9, t8 = 4.0, p = 0.004; Context 3, 65.2 ± 3.8%, n = 7, t6 = 4.0, p = 0.007; Context 4, 65.3 ± 5.6%, n = 7, t6 = 2.7, p = 0.035; 24-h memory: Context 1, 45.1 ± 6.4%, n = 9, t8 = 0.77, p = 0.46; Context 2, 49.1 ± 4.9%, n = 9, t8 = 0.18, p = 0.86; Context 3, 57.2 ± 4.1%, n = 8, t7 = 1.7, p = 0.12; Context 4, 47.6 ± 4.7%, n = 8, t7 = 0.52, p = 0.62; one-sample t-test versus chance level).
In contexts 1, 2, and 4, between-subject comparison of the groups revealed significant differences between 1-h and 24-h memory (1-h memory versus 24-h memory: Context 1, t12.7 = 3.4, p = 0.005; Context 2, t15.2 = 2.6, p = 0.019; Context 3, t13.0 = 1.4, p = 0.17; Context 4, t12.2 = 2.4, p = 0.032; unpaired Welch's t-test). For a better representation and within-subject comparison of the data, the results from two counterbalanced contexts were combined (Figure 5C,E). The combined experimental groups were compared to chance level individually again (Contexts 1 and 2 combined: 1-h memory, 67.8 ± 2.6%, n = 18, t17 = 6.7, p < 0.001; 24-h memory, 47.1 ± 3.9%, n = 18, t17 = 0.74, p = 0.47; Contexts 3 and 4 combined: 1-h memory, 65.3 ± 3.3%, n = 14, t13 = 4.7, p < 0.001; 24-h memory, 52.4 ± 3.2%, n = 16, t15 = 0.73, p = 0.48; one-sample t-test versus chance level). Then, the experimental groups were compared to each other.
In both context pairs, there were significant differences between groups as revealed by within-subject comparisons (1-h memory versus 24-h memory: Contexts 1 and 2 combined, t16 = 3.5, p = 0.003; Contexts 3 and 4 combined, t13 = 2.4, p = 0.032; paired t-test). Comparable results were obtained with wild-type Lister Hooded rats, too, in the weak encoding protocol using contexts 1 and 4 for the two counterbalanced sessions (data not shown). The replicability and reliability of the results were validated by comparing each data set using one-way ANOVA. No significant difference was detected among the four contexts (1-h memory: F3,28 = 0.31, p = 0.81; 24-h memory: F3,30 = 0.99, p = 0.41). Therefore, the object location test can be repeated reliably with minimum influence of repetitions, given that the instructions in this protocol are followed.

Figure 5: Different ways of presenting and analyzing the results of the weak encoding protocol with two experimental groups counterbalanced over two sessions. (A) The experimental design for counterbalancing with two experimental groups (1-h and 24-h memory groups) over two sessions (contexts 1 and 2). The counterbalancing was repeated in two additional sessions (contexts 3 and 4). (B and D) The results from each context and the experimental groups were individually compared to chance level and to each other. In all four contexts, the preference for the object at the novel location in tests with a 1-h delay was significantly increased compared to chance level [Context 1 and 2: n = 9 per group (B); Context 3 and 4: n = 7 per group (D)]. In 24-h delay tests, the preference for the object at the novel location did not differ from chance (Context 1 and 2: n = 9 per group; Context 3 and 4: n = 8 per group). There was a significant difference between the preferences of experimental groups in contexts 1, 2, and 4, but not context 3, as revealed by between-subject comparison. *p < 0.05, **p < 0.01, ***p < 0.001; one-sample t-test versus chance level (50%, dashed line). #p < 0.05; ##p < 0.01; ns, not significant; unpaired Welch's t-test. (C and E) The results are presented after combining the experimental groups from the two counterbalanced contexts [Contexts 1 and 2 combined, n = 17 per group (C); Contexts 3 and 4 combined, n = 14 per group (E)]. The preference for the object at the novel location was significantly increased compared to chance level in tests with a 1-h, but not 24-h delay, in both context pairs. The within-subject comparison of the experimental groups revealed significant differences between the preferences for the object at the novel location in tests with 1-h and 24-h delays in both context pairs. ***p < 0.001; one-sample t-test versus chance level (50%, dashed line). #p < 0.05, ##p < 0.01; paired t-test. Individual data points are presented as dots. All bars show the percentage of exploration of the object at the novel location as mean ± SEM. Please click here to view a larger version of this figure.
Discussion
The object location task can be used in a variety of studies to investigate spatial memory as described earlier. The flexibility of the setup enables the modeling of short-term and long-term memory of different strengths, and it can be easily implemented at a low cost. However, as there are many parameters in the protocol that can influence results, and different studies vary slightly in these parameters6, one might face difficulties successfully implementing the task for the first time. The above protocol is intended to guide readers through this process smoothly. Further crucial steps that might be significant in the successful implementation of the task with high replicability will be discussed below.
Although the encoding/test session often is the focus when running object location experiments, handling and habituation protocols have a profound effect on the outcome of these kind of behavioral tests where the outcome depends on undisturbed natural rat behavior14,15. As such, the steps preceding the encoding/test session should be designed with caution, as they can influence rat behavior and memory and consequently, influence the end results. A good level of handling and habituation such that rats become familiar with the experimenter and the task will minimize the effect of stress factors whilst increasing the likelihood of exhibiting natural behavior8. As mentioned in the protocol, handling can begin as early as weaning of pups if the rat strain is maintained in the home facility. Based on previous experience (data not shown) and from that of several previous studies16,17, this early handling results in low anxiety and enhanced curiosity in the months that follow.
As the object location task depends solely on the intrinsic exploratory drive of the rats, expected behavior can be easily hindered if rats are not eager to explore or reluctant to approach novelty, which is referred as 'neophobic behavior'1. As such, it is highly recommended to include a thorough handling and habituation protocol according to the specific needs of the study. This protocol can be used as a minimum requirement guide, and further steps can be implemented (e.g., if the study is to include injections at a later stage, habituation to injection procedures and specific holding position are required). The strain and the age of the experimental rats are two other influential factors and should be considered before planning an experiment to avoid suboptimal results. Different rat strains can have different behaviors and baseline anxiety levels18,19,20 and therefore, specific adjustment to the protocol may be required depending on strain used.
This protocol is confirmed to work well with Th-Cre transgenic rats with Long-Evans strain backcrossed four times to Lister Hooded strain and wild-type Lister Hooded rats. A logically ideal starting age for rats in behavioral experiments is around 12 weeks20, but inter-strain variability and the specific requirements of the task should be accounted for. It could also be possible to use developing rats if it is of interest for the study, though adjustments to the protocol may be required and are not covered here. However, it is important to consider whether the rat at a given age has developed the cognitive functions required to successfully perform this task. A study21 investigating this has reported that only the adolescent rats at postnatal day 38 and not before, showed allocentric spatial memory reflected in preference for object at the novel location, as observed in adult rats. The protocol presented here was successful using rats that were 15-16 weeks old at the beginning of the first encoding/test session. Previously, the same strong encoding protocol produced suboptimal to negative results when using 23-week-old rats that had not reached the optimal level of habituation due to lack of handling and habituating at a young enough age. These rats either failed to perform differently from chance level or in fact, exhibited aversion towards novelty as observed in terms of preference for the stable objects instead of the displaced objects (data not shown). These results provide evidence that the age and the timing of the handling habituation can have an impact on the effectiveness of habituation and as a result, contribute to the observation of anxious and neophobic behavior in the tests.
Here, two different protocols are outlined, ensuring strong or weak encoding in the object location task. During the establishment of these protocols, it was observed that interest in the objects declined after 5-10 min of exploration during single long trials (e.g., 20 min encoding), and rats eventually stopped exploring. This results in weaker memory of the object locations. An encoding protocol that interleaves encoding trials with short rest periods (e.g., 3 x 5 min encoding) overcomes this and leads to high exploration throughout the trials. Thus, the active exploration time and the different layout of these two encoding protocols influences the strength of the memory, which is stronger after 3 x 5 min encoding than after 20-min encoding protocols. Similar results can also be achieved using slightly different durations with single trial versus interleaved trial protocols, and adjustments can be made to suit the needs of the study and the rat strain.
As opposed to protocols using a plain white open field with only external cues in the room, the protocol presented here uses an arena with distinct contexts and intra-maze cues that likely requires more time to learn. Hence, the addition of a context habituation step in the protocol prior to the encoding trial is recommended. This will allow rats to form a spatial map of each context during habituation and decrease the duration of the following encoding trial, as the rats will only need to encode the locations of the objects in relation to this map. Furthermore, context habituation will allow rats to habituate to any possible distractor within each context, such as the 3D spatial cues, minimizing behaviors other than object exploration in the encoding/test session to follow. With the implementation of a thorough counterbalancing method consisting of several levels (i.e., a wide range of object location combinations (counters) and direction of the object displacement), unwanted preferences that may rise due to variations in light intensity and wall colors/patterns at the corners of the arena are minimized.
Several factors should be considered when repeating the task to increase the replicability between encoding/test sessions and minimize the influence of repetition. First, distinct contexts (as many as the number of repetitions of encoding/test sessions) need to be designed to avoid the accumulation of spatial memory that might be caused by performing the repeated sessions using the same context. To achieve this, an apparatus with replaceable walls of different colors and patterns was used (Figure 1B,C). The distinct walls and 3D objects (such as toys or small everyday items of distinct colors and shapes, see protocol and Figure 1C) hung on the walls are the spatial cues and landmarks that the rats potentially use to learn object locations in relation to their contexts. In the case that a test fails to produce preference for the moved object, changing these parameters of the context (wall design and spatial cues) can be considered. Alternatively, a rectangular- or circular-shaped arena can be used for object location tasks instead of a square arena as in this protocol. Circular arenas are reported to eliminate corner preferences22 that is often observed in arenas with corners, and hence, it can be beneficial when dealing with a particularly high-anxiety rat or mouse strain. While the requirements of creating four distinct contexts in this protocol works most optimally with a quadrangular shape, a circular arena can also be made functional following some adjustments.
Second, the intervals between each encoding/test session should be determined such that rats retain the same level of interest each time, while avoiding the risk of cumulative learning resulting from a dense schedule of repetitions. Usually, an interval of at least double the length of the delay time between encoding and test trials is sufficient, with longer intervals being more favorable for more than two repetitions. This means, while a minimum of 48-h interval after a 24-h test is sufficient for one or two repetitions, using a 1-week interval is recommended for four repetitions. As the results in Figure 5 and the comparison using ANOVA show, the task can be successfully repeated four times. Based on this, the established protocol can be used to counterbalance up to four experimental conditions. The number of experimental groups determines the number of repetitions of encoding/trial sessions in distinct contexts. The results in Figure 5 represent one possible way of using the protocol with two experimental groups. The groups were counterbalanced in two sessions, and the same conditions were repeated in two additional sessions (for validation purposes). The second set of counterbalanced sessions could also be used to counterbalance new conditions. Similarly, three or four experimental conditions can be compared using three or four counterbalanced sessions, respectively.
In these cases, the contexts should be designed to accommodate contrasting characteristics described in the protocol. It is noteworthy that the counterbalanced design may not be suitable for experiments in which additional manipulations, such as a pharmacological intervention that might leave a long-lasting effect or damage, are to be used. To maintain the effectiveness and replicability of the tests, the experiment should be designed accordingly. The data from repeated tests can be presented and analyzed in several ways, as demonstrated in Figure 5. For an initial analysis, the experimental groups in each context can be individually compared to chance level using one-sample t-test to determine any significant preference (Figure 5B,D). This can be helpful to get a quick understanding of the data, but it ensures only an indirect comparison of the groups. So, for comparing two or more groups, the data should be analyzed using two-sample t-tests (paired or unpaired) or ANOVA, respectively. This can be in the form of between-subject comparison of the groups within a single encoding/test session (Figure 4A and Figure 5B,D) or within-subject comparison of the groups from two (or more) counterbalanced contexts (Figure 5C,E). The latter method is strongly recommended, especially when dealing with weak memory conditions, which, as explained previously, results in high variance due to randomness in behavior.
Combining the counterbalanced contexts leads to larger groups that are required to reliably visualize the behavior of the group with minimal variation. Using a protocol with repetitions in counterbalanced sessions, one can expect a decrease in the number of rats to around one third of the number that would be required using a single test with the same statistical power. Usually, sample sizes in a range of 7 to 15 rats (total) for counterbalanced sessions and in a range of 20 to 50 rats (10 to 25 per group) for a single session with an effect size and power both larger than 0.8 are sufficient. The decrease in the number of animals needed and the increase in the information we obtain from each animal using this protocol both refines the study and serves the 3R principles of ethical uses of animals in research. It is important at this step to keep in mind that random rat behavior, which is not accompanied with a strong memory, may result in individual strong preferences both below and above chance, but the group average should yield a preference not significantly different from chance. Individual data should be interpreted carefully. The distribution of individual data points within a group can also be informative for interpreting results. As seen in Figure 4 and Figure 5, the distribution changes depending on the strength of the memory. Overall, the protocol presented here can be followed easily to implement the object location task with repetitions to model short-term and/or long-term spatial memory. The simple and flexible training protocol and the possibility of implementing further manipulations make this task a popular choice. These modifications to the protocol enable the investigation of particular steps such as memory acquisition, consolidation, and recall.
Disclosures
The authors have nothing to disclose.
Acknowledgements
We would like to thank Antonios Asiminas, Dorothy Tse, Kiichi O'Hara, and David Bett for insightful comments and suggestions. This study was supported by Erasmus+ (to G.B. and L.N.); the Graduate School of Health, Aarhus University (to K.H.); Novo Nordisk Foundation Young Investigator Award 2017 (NNF17OC0026774), Lundbeckfonden (DANDRITE-R248-2016-2518) and PROMEMO - Center for Proteins in Memory, a Center of Excellence funded by the Danish National Research Foundation (DNRF133) (to T.T.).
Materials
| Name | Company | Catalog Number | Comments |
|---|---|---|---|
| Open-field/experimental box | O'Hara & Co (Japan) | OF-3001 | Open-field box for the object location task |
| Object 1: cones | O'Hara & Co (Japan) | ORO-RR | |
| Object 2: footballs | O'Hara & Co (Japan) | ORO-RB | |
| Object 3: rectangular blocks | O'Hara & Co (Japan) | ORO-RC | Rectangular blocks were modified after purchase |
| Object location task apparatus | O'Hara & Co (Japan) | SPP-4501 | Sound attenuating box that contains the open-field box for the object location task |
| Tracking software | O'Hara & Co (Japan) | TimeSSI | For movement tracking and automated camera functions |
| Wild-type Lister Hooded rats | Charles River | 603 |
References
- Hughes, R. N. Neotic preferences in laboratory rodents: issues, assessment and substrates. Neuroscience and Biobehavioral Reviews. 31 (3), 441-464 (2007).
- Blaser, R., Heyser, C. Spontaneous object recognition: a promising approach to the comparative study of memory. Frontiers in Behavioral Neuroscience. 9, 183(2015).
- Dix, S. L., Aggleton, J. P. Extending the spontaneous preference test of recognition: evidence of object-location and object-context recognition. Behavioral Brain Research. 99 (2), 191-200 (1999).
- Barker, G. R., Warburton, E. C. When is the hippocampus involved in recognition memory. Journal of Neuroscience. 31 (29), 10721-10731 (2011).
- Mumby, D. G., Gaskin, S., Glenn, M. J., Schramek, T. E., Lehmann, H. Hippocampal damage and exploratory preferences in rats: memory for objects, places, and contexts. Learning & Memory. 9 (2), 49-57 (2002).
- Gulinello, M., et al. Rigor and reproducibility in rodent behavioral research. Neurobiology of Learning and Memory. 165, 106780(2019).
- Rudeck, J., Vogl, S., Banneke, S., Schonfelder, G., Lewejohann, L. Repeatability analysis improves the reliability of behavioral data. PLoS One. 15 (4), 0230900(2020).
- Gouveia, K., Hurst, J. L. Optimising reliability of mouse performance in behavioural testing: the major role of non-aversive handling. Scientific Reports. 7, 44999(2017).
- Migues, P. V., et al. Blocking synaptic removal of GluA2-containing AMPA receptors prevents the natural forgetting of long-term memories. Journal of Neuroscience. 36 (12), 3481-3494 (2016).
- Maingret, N., Girardeau, G., Todorova, R., Goutierre, M., Zugaro, M. Hippocampo-cortical coupling mediates memory consolidation during sleep. Nature Neuroscience. 19 (7), 959-964 (2016).
- Chao, O. Y., de Souza Silva, M. A., Yang, Y. M., Huston, J. P. The medial prefrontal cortex - hippocampus circuit that integrates information of object, place and time to construct episodic memory in rodents: Behavioral, anatomical and neurochemical properties. Neuroscience and Biobehavioral Reviews. 113, 373-407 (2020).
- Takeuchi, T., et al. Locus coeruleus and dopaminergic consolidation of everyday memory. Nature. 537 (7620), 357-362 (2016).
- Witten, I. B., et al. Recombinase-driver rat lines: tools, techniques, and optogenetic application to dopamine-mediated reinforcement. Neuron. 72 (5), 721-733 (2011).
- Costa, R., Tamascia, M. L., Nogueira, M. D., Casarini, D. E., Marcondes, F. K. Handling of adolescent rats improves learning and memory and decreases anxiety. Journal of the American Association for Labaratory Animal Science. 51 (5), 548-553 (2012).
- Schmitt, U., Hiemke, C. Strain differences in open-field and elevated plus-maze behavior of rats without and with pretest handling. Pharmacology Biochemistry and Behavior. 59 (4), 807-811 (1998).
- Kosten, T. A., Kim, J. J., Lee, H. J. Early life manipulations alter learning and memory in rats. Neuroscience and Biobehavioral Reviews. 36 (9), 1985-2006 (2012).
- Denenberg, V. H., Grota, L. J. Social-seeking and novelty-seeking behavior as a function of differential rearing histories. Journal of Abnormal and Social Psychology. 69 (4), 453-456 (1964).
- Clemens, L. E., Jansson, E. K., Portal, E., Riess, O., Nguyen, H. P. A behavioral comparison of the common laboratory rat strains Lister Hooded, Lewis, Fischer 344 and Wistar in an automated homecage system. Genes, Brain, and Behavior. 13 (3), 305-321 (2014).
- Ennaceur, A., Michalikova, S., Bradford, A., Ahmed, S. Detailed analysis of the behavior of Lister and Wistar rats in anxiety, object recognition and object location tasks. Behavioral Brain Research. 159 (2), 247-266 (2005).
- Deacon, R. M. Housing, husbandry and handling of rodents for behavioral experiments. Nature Protocols. 1 (2), 936-946 (2006).
- Contreras, M. P., Born, J., Inostroza, M. The expression of allocentric object-place recognition memory during development. Behavioral Brain Research. 372, 112013(2019).
- Yaski, O., Eilam, D. How do global and local geometries shape exploratory behavior in rats. Behavioral Brain Research. 187 (2), 334-342 (2008).
Reprints and Permissions
