This protocol presents the slide preparation and automated scoring of the γ-H2AX foci assay on peripheral blood lymphocytes. To illustrate the method and sensitivity of the assay, isolated lymphocytes were irradiated in vitro. This automated method of DNA DSB detection is useful for fast and high-throughput biological dosimetry applications.
Method Article
An Automated Microscopic Scoring Method for the γ-H2AX Foci Assay in Human Peripheral Blood Lymphocytes
Shankari Nair1 , Samantha Cairncross2 , Xanthene Miles1 , Monique Engelbrecht3 , Peter du Plessis1 , Julie Bolcaen1 , Randall Fisher1 , Roya Ndimba1 , Charnay Cunningham4 , Wilner Martínez-López5 , Christian Schunck6 , Charlot Vandevoorde1
1Radiation Biophysics Division, Nuclear Medicine Department, iThemba LABS, 2Department of Biotechnology, University of the Western Cape, 3Department of Medical Biosciences, University of the Western Cape, 4Division of Medical Physiology, Department of Medicine and Health Sciences, Stellenbosch University, 5Biodosimetry Service, Instituto de Investigaciones Biológicas Clemente Estable and Academic Unit on Radiation Protection, Faculty of Medicine, University of the Republic, 6MetaSystems Hard & Software GmbH
Opens in a new tab
In This Article
Summary
Loading...
$$\rightleftharpoonup{xx}$$
$$\longleftharp{xx}$$,
$$\longrightharp{xx}$$,
Abstract
Loading...
$$\rightleftharpoonup{xx}$$
$$\longleftharp{xx}$$,
$$\longrightharp{xx}$$,
Ionizing radiation is a potent inducer of DNA damage and a well-documented carcinogen. Biological dosimetry comprises the detection of biological effects induced by exposure to ionizing radiation to make an individual dose assessment. This is pertinent in the framework of radiation emergencies, where health assessments and planning of clinical treatment for exposed victims are critical. Since DNA double strand breaks (DSB) are considered to be the most lethal form of radiation-induced DNA damage, this protocol presents a method to detect DNA DSB in blood samples. The methodology is based on the detection of a fluorescent labelled phosphorylated DNA repair protein, namely, γ-H2AX. The use of an automated microscopy platform to score the number of γ-H2AX foci per cell allows a standardized analysis with a significant decrease in the turn-around time. Therefore, the γ-H2AX assay has the potential to be one of the fastest and sensitive assays for biological dosimetry. In this protocol, whole blood samples from healthy adult volunteers will be processed and irradiated in vitro in order to illustrate the usage of the automated and sensitive γ-H2AX foci assay for biodosimetry applications. An automated slide scanning system and analysis platform with an integrated fluorescence microscope is used, which allows the fast, automatic scoring of DNA DSB with a reduced degree of bias.
Introduction
Loading...
$$\rightleftharpoonup{xx}$$
$$\longleftharp{xx}$$,
$$\longrightharp{xx}$$,
Since its discovery, ionizing radiation (IR) has become an indispensable tool in current medical and industrial practices, as well as in agricultural and military applications. However, the wide use of IR also increases the risk of radiation overexposure for both professional radiation workers as well as members of the public. IR is a well-known physical carcinogen that can induce DNA damage in a direct or indirect manner, leading to significant health risks 1,2. Therefore, it is important to perform a dose assessment, since the degree of exposure forms an important initial step in the management of the radiation accident 1.
In the event of large scale nuclear or radiological emergencies, the number of dose assessments that need to be performed can range from a few to thousands of people depending on the size of the accident3. In these scenarios, physical dosimetry may also be ambiguous (e.g., if the dosimeter is not worn properly) or unavailable, when members of the public are involved. While clinical symptoms could be used for triage, they are not necessarily radiation specific and can result in a false diagnosis. Therefore, it is advisable to use biological dosimetry alongside physical dosimetry and clinical assessments. This method allows the analysis of radiation-induced changes at cellular level and enables the unequivocal identification of exposed individuals who require medical treatment4. The physician can then use this biological dose assessment to complement physical dose reconstructions and other clinical diagnoses, in order to prescribe the appropriate medical care5. The need for biological dosimetry will be especially high for triage and medical management of casualties when the exposure scenario is not well known and when the victims are members of the public. The main purpose of triage is to effectively distinguish "worried well' persons, who could have prodromal symptoms but who did not receive a high dose, from exposed persons needing immediate medical help and specialized care. The threshold level of radiation dose that can cause radiation sickness is approximately 0.75 - 1.00 Gy. Then, those individuals who receive > 2 Gy of exposure are at higher risk for acute radiation syndrome and should receive prompt medical treatment6,7. Timely and accurate biological dose estimates for victims caught in the crossfire of such disasters are critical. Additionally, it can also comfort and reassure minimally exposed victims8.
Radiation protection authorities use various biodosimetry markers, which are mainly based on the detection of cytogenetic damage, such as dicentric chromosomes or micronuclei, in cultured human lymphocytes9. The detection of cytogenetic damage can also be performed by the fluorescent in situ hybridization (FISH) translocation assay10. However, the major drawback of the conventional cytogenetic methods is the long turnaround time to obtain the results in an emergency situation8.
One of the earliest steps in the DNA DSB recognition process is the phosphorylation of the histone variant H2AX, leading to the formation of γ-H2AX, and the subsequent recruitment of repair factors. Over the past decade, the detection of radiation-induced γ-H2AX foci in peripheral blood lymphocytes using immunofluorescence microscopy has received growing attention as a reliable biological dosimetry tool11,12,13,14,15. Depending on the radiation quality and cell type, the maximum yield of γ-H2AX foci is detected within 0.5 - 1 hour after irradiation16,17. It is anticipated that there is a close correlation between the number of DNA DSB and γ-H2AX foci, as well as between the disappearance of foci and DSB repair. Laser scissor experiments with a pulsed laser microbeam have demonstrated that γ-H2AX foci localize to the sites of DNA DSB18. While it remains a topic of active debate, one of the earliest studies with 125I suggested a one-to-one correlation between the calculated number of disintegrations per cell (representable for the number of radiation-induced DNA DSB) and the number of γ-H2AX foci that was scored19,20.
Over the past decade, the European Union funded the MULTIBIODOSE (Multi-disciplinary biodosimetric tools to manage high scale radiological casualties) and RENEB (Realizing the European Network of Biodosimetry) projects to create a sustainable network in biological and retrospective dosimetry21,22. This project included various laboratories throughout Europe to evaluate the emergency response capabilities in the event of a radiological emergency14,21,22. The γ-H2AX foci assay has a number of considerable advantages, such as a rapid processing time, the potential for batch processing allowing for high throughput, as well as its high sensitivity if used within a few hours after exposure13,23,24. The high sensitivity of the assay in the low dose range resulted in a number of studies where the γ-H2AX foci assay was used as an indicator of the effect of medical radiation exposure, both in radiotherapy as well as in diagnostic imaging applications25,26,27,28,29,30. These characteristics make the γ-H2AX foci assay a highly competitive alternative to other methods for early triage in large nuclear accidents to separate the critically exposed from low risk individuals. Several optimization experiments have illustrated that it is feasible to perform the γ-H2AX foci assay with small volumes of blood, such as the study of Moquet et al. who reported that it is feasible to perform the γ-H2AX foci assay with only a drop of blood (finger prick)31. A similar approach was used in the development of the fully automated high-throughput RABIT (Rapid Automated Biodosimetry Tool) system which was optimized to measure γ-H2AX yields from fingerstick-derived samples of blood32,33. Overall, the results of the MULTIBIODOSE and RENEB inter-comparison studies suggest that the γ-H2AX foci assay could be a very useful triage tool following a recent (up to 24 hours) acute radiation exposure12,13,14. In a low-dose range inter-comparison study, a dose as low as 10 mGy could be distinguished from the sham-irradiated control samples, highlighting the sensitivity of the assay in the low dose range34. It is important to note that the high sensitivity of the assay is particularly true for lymphocytes, which makes them one of the most suitable cell types for the evaluation of low-dose exposures. Lymphocytes are mainly non-cycling cells and represent a synchronous population. The latter avoids expression of γ-H2AX is associated with DNA replication, which significantly reduces the assay's sensitivity to detect radiation-induced DSB during G2 and S-phase of the cell cycle35. In addition to its sensitivity to low doses for lymphocytes, the turnaround time of the γ-H2AX foci assay is significantly faster than cytogenetic techniques such as the dicentric and micronucleus assay, since it does not require the stimulation of lymphocytes. Therefore, results can be obtained within a few hours compared to a couple of days for cytogenetic techniques. A major drawback of the assay is the fast disappearance of the γ-H2AX foci signal, which will normally be reduced to baseline levels within days after the radiation exposure depending on the DNA repair kinetics36. Therefore, the most suitable application of the assay in a biodosimetry context is for initial triage purposes and to prioritize more time-consuming cytogenetic biological dosimetry follow-up for certain victims. However, for precise retrospective biodosimetry and long-term effects, one has to rely on cytogenetic techniques such as three-color FISH analyses for the detection of stable chromosomal aberrations in case the exposure took place several years ago10.
As part of several biodosimetry initiatives, multiple assays have been evaluated for triage purposes next to the γ-H2AX foci assay to triage people in large-scale radiological emergencies; such as the dicentrics assay, the cytokinesis-block micronucleus assay, electron paramagnetic resonance (EPR), serum protein assay (SPA), skin speckle assay (SSA), optically stimulated luminescence (OSL), as well as gene expression analysis 37,38. The γ-H2AX foci assay can be used quantitatively for the evaluation of DNA DSB formation and repair39. However, the assay is time-dependent as the level of γ-H2AX foci varies with time after irradiation due to the DNA DSB repair kinetics40. A comparative study illustrated that microscopic scoring with z-stage capacity offers the most accurate results after 1 Gy of irradiation, while flow cytometry only gives reliable results at higher doses of IR41. There are many reports of the development of image analysis solutions for use in automated scoring42,43,44,45,46. In this protocol, an automated, high-throughput fluorescent microscopy platform is used to analyze γ-H2AX foci in peripheral blood lymphocytes. The use of an automatic scoring system avoids both inter-laboratory and inter-observer scoring bias, while it still allows enough sensitivity to detect doses below 1 Gy47. The primary advantage of this system compared to free open-source software for foci scoring is the fact that the complete process from the scanning of slides to capturing and scoring is automated. The concept of user-definable and storable classifiers guarantees reproducibility which adds an unbiased degree of quality to the results. Therefore, this work illustrates how γ-H2AX foci results can be obtained using an automated microscopic scanning and scoring method which can be used when blood samples from potentially over-exposed individuals are received by radiobiology laboratories for biological dosimetry purposes.
Protocol
Loading...
$$\rightleftharpoonup{xx}$$
$$\longleftharp{xx}$$,
$$\longrightharp{xx}$$,
This study was approved by the Biomedical Research Ethics Committee of The University of Western Cape Ethics Committee - Code BM18/6/12.
1. Preparation of Solutions48
- Cell fixation solution (3% PFA in PBS)
- Wear the appropriate personal protective equipment (PPE) and working in a fume hood, add 20 g of paraformaldehyde to 200 mL of distilled H2O. Heat the mixture to 60 °C to aid dissolution.
- Once the PFA is dissolved, add 40 drops of 5 N NaOH carefully over 30 minutes and to cool to room temperature. Adjust to pH 7 using 1 M HCl and make up to a final volume of 250 mL with distilled H2O (aliquots can be stored at -20 °C for 1 year). Add 25 mL from this solution to 41.7 mL PBS to afford a 3% PFA solution.
- 1% Bovine Serum Albumin (BSA) solution: Add 10 g of BSA to 1000 mL of PBS and mix until dissolved. Store at 4 °C until use (maximum 72 hours).
- Triton-X Solution in a concentration of 1:500: Add 1 µL of Triton-X to 500 µL of PBS, store at 4 °C until use (maximum 24 hours).
- Antibody Solutions
- Primary antibody - Anti-γ-H2AX in concentration of 1:500: Add 1 µL of anti-γ-H2AX to 500 µL of 1% BSA solution, store at 4 °C until use (maximum 24 hours).
- Secondary antibody - DAM-TRITC in concentration of 1:1000: Add 1 µL of DAM-TRITC to 1000 µL of 1% BSA solution, store at 4 °C until use (maximum 24 hours).
- Complete Roswell Park Memorial Institute (cRPMI) Media
- Add filtered Fetal Bovine Serum (FBS) and Penicillin-Streptomycin to RPMI 1640 media in a sterile bottle to give a final concentration of 10% FBS and 1% Penicillin-Streptomycin.
2. Preparation of Samples
NOTE: For this protocol, peripheral whole blood samples are collected by venipuncture in lithium-heparin collection tubes from healthy adult volunteers (with informed consent - BM18/6/12 Biomedical Research Ethics Committee of The University of Western Cape Ethics Committee). Before beginning, ensure that the blood and the density medium of 1.077 g/mL are acclimated to room temperature.
- In a prepared biosafety cabinet, dilute the peripheral whole blood in a 1:1 volume with PBS and gently layer the diluted blood on an equal volume to two-volumes of medium with a density of 1.077 g/mL. It is important to gradually layer the blood on the density medium by holding the tube slanted at 45°, ensuring that the blood and density medium do not mix.
- Carefully transfer the suspension to a centrifuge and spin at 900 x g for 20 minutes. Thereafter, pipette the 'cloudy' layer only to a new sterile conical tube and fill the tube with PBS and centrifuge for 10 minutes at 1000 x g. Thereafter, aspirate the supernatant with a pipette, being cautious to not disturb the pellet, resuspend the PBMC pellet carefully in 1 mL PBS and fill the tube with PBS.
- Repeat the above washing step two more times to get to a total of three washes.
- Count the number of PBMCs using a hemocytometer, aware that each mL of peripheral blood from an adult donor will result in a rough average of 1 - 1.5 x 10⁶ PBMCs49. After counting, dilute the PBMC pellet to a concentration of 8 x 10⁵ lymphocytes in 1 mL of cRPMI. Then add approximately 2 x 10⁶ PBMCs or 2.5 mL from the isolated PBMC solution into a sterile, conical tube for irradiations.
3. Sample irradiations
CAUTION: Handle the radiation unit according to Radiation Protection guidelines and wear a physical dosimeter at all times. Ensure that the irradiation system used is calibrated and set up such that the correct expected doses are achieved.
- Irradiate PBMCs at room temperature using a 60Co source. Calibrate (TRS-398 protocol) with a Farmer 117 chamber for which a chamber calibration factor obtained from the National Metrology Institute of South Africa (NMISA)50.
- For this assay, place the conical tubes between a 5 mm acrylic sheet (used for beam entry build-up) and 50 mm backscatter material with the current 60Co source dose rate of 0.57 Gy/min for a 300 mm × 300 mm homogenous field size at 750 mm Source to Surface Distance.
- Irradiate the PBMCs with graded doses of 0.125, 0.500, 1.000, 1.500 and 2.000 Gy, and maintain the sham-irradiated control samples, in the control room, receiving only ambient radiation exposure.
- Incubate the irradiated samples for 1 hour at 37 °C in a humidified 5% CO2 incubator in order to reach the maximum number of γ-H2AX foci.
NOTE: Incubation time can be modified according to experimental design.
4. Slide preparation
NOTE: See Figure 1 for slide setup.
- Prepare 3 slides (technical repeats) using slides coated with a positively charged surface to improve adhesion per irradiation condition (or per conical tube). Place the slide into the clip holder, add the filter card on top of it, and finally the funnel. Secure the slide clips and place into the cytocentrifuge.
- Add 250 µL of the cell suspension to the funnel (200,000 cells/slide) and spin for 30 x g for 5 minutes using a cytocentrifuge.
- After cytocentrifugation, remove the slide from the clip holder and using a hydrophobic pen, draw a circle around the spot with the cells in order to retain the immunofluorescent stain on the bound cells during the staining process.
5. Fixation and immunofluorescence γ-H2AX staining
NOTE: All solutions are carefully added directly onto the cell area which is marked by a hydrophobic circle. Staining solutions are dispensed slightly above the slide without allowing the pipette tip to disrupt the cells. Solutions are NOT added to the whole slide.
- Fix the slides in freshly prepared 3% PFA for 20 minutes.
NOTE: The slides can be stored in PBS containing 0.5% PFA at 4 °C for a maximum of 2 days before immunostaining is performed. Thereafter, wash slides in a Coplin jar with PBS for 5 minutes, then cover the cells with 100 µL of the cold Triton-X solution for 10 minutes to allow permeabilization. - Tip the Triton-X solution off on tissue paper and wash the slides three times in 1% BSA solution for 10 minutes. This is done to prevent unwanted background by blocking nonspecific antibody binding.
- Incubate slides at room temperature with 100 µL of the 1:500-diluted primary anti-γ-H2AX antibody for 1 hour in a humidifying chamber, easily accomplished by adding wet tissue paper at the base of a rectangular slide storage box.
- Tip the antibody solution off on tissue paper and perform three washes with 1% BSA solution for 10 minutes in a Coplin jar to remove unbound primary antibody and to prevent non-specific binding of the secondary antibody.
- Incubate slides with 100 µL of the 1:1000-diluted secondary DAM-TRITC antibody solution for 1 hour in the humidifying chamber. Tip the antibody solution off on tissue paper and wash the slides in PBS for 10 minutes three times.
- Finally dry the slides outside the hydrophobic circle with soft, dust-free tissue paper and add 1-2 drops of DAPI resolved in an aqueous mounting medium and gently cover the slide with a 24 x 50 mm cover slip, ensuring that there are no trapped air bubbles and place in the fridge at 4 °C overnight. Slides can be stored at 4 °C for a maximum of 2 weeks before scanning.
6. Automated Scanning and Scoring of slides
NOTE: The scanning system needs to have a fluorescent microscope, a high-resolution CCD (charged coupled device) camera connected to a frame grabber for real-time digitization of video images, a scanning stage, trackball for manual movements, 3D mouse, fast PC and monitor, and hard drive for archiving (Figure 2).
- Classifier setup
NOTE: The classifier is a set of parameters defining how the system detects cells. It results from the training based on pre-classified image fields. A classifier is specific for a microscope magnification, cell type, and laboratory. Classifiers may therefore require modifications in the following parameters to adapt them to the current conditions. It is recommended to test the settings with a reference slide before evaluation.- Image acquisition: Use a 40x dry objective for imaging. To achieve comparable image quality in all cells, set the camera integration time to automatic mode. Set the maximum integration time to at least 1 second for both color channels (camera gain 4.0). The signal channel is acquired with 10 focus planes and 14/40 µm between the planes.
- Cell selection: PBMCs within a range of 20.00 µm2 and 76.00 µm2 are detected. Set the maximum concavity depth to 0.05 and the maximum aspect ratio to 1.4. Set the relative gray level threshold to 20%.
- Cell processing: Process the DAPI counterstain channel with a histogram maximum algorithm to reduce the background. The signal channel is processed with a TopHat filter (strength 7, smoothing factor 0) to reduce the background and to enhance the signals.
- Signal counting: Count foci using the Object Count feature of the device. To avoid false-positive evaluation of remaining background signals, only those signals which show at least 30% of the intensity when compared to the brightest object in the cell are counted.
- Insert/Place slides onto the automated scanning platform or slide stage, after gently cleaned with 70% ethanol, to remove any dust.
- Slide Setup - Open Slide Setup Dialogue Menu (Figure 3)
- Select the correct Data Path, this specifies where the slide files resulting from the search are stored.
- Give the slide a name, each slide must be given a unique name. If a series of slides are entered in the form of an enumerated list, the '?' can be used as a wildcard for the slide number.
- Select the appropriate classifier, as described in section 1.1 - 1.4 (Figure 4).
- Select the Search Window and select Predefined if a search window definition matching the cytocentrifuge cell circle exists, select the respective definition in the Size column, or select Manual if there is no predefined search window definition available. In this case, the Size column does not have to be set.
- Select Maximum Cell Count and add the maximum number of cells required to be scanned. The search is terminated even if the selected search window has not yet been scanned completely as soon as the Max Cell Count is reached. For biodosimetry applications, automated scoring of 1000 cells per slide is sufficient, considering that 3 slides per blood sample are prepared. Click OK to confirm the settings.
- Slide Scanning Setup
- Click the Search button on the side bar. If the setting Manual Search Window was selected in slide setup, a dialogue will open allowing for determination of the scan area (Figure 5). By using the 10x objective, select the rectangular search area on the slide interactively by fixing two corners of the search field by left click of the mouse. This can be confirmed with the OK button. If the search window is referring to a predefined search window, this step will be omitted.
- The user is prompted to adjust a focus start position. A reference object will then be selected automatically, the software will prompt the user to focus and center a reference nucleus (using the 40x objective) for each slide and to confirm settings with OK. The system will automatically move to all slides sequentially. If necessary, adjust Live Image Setup - Integration Time for this step (Figure 5).
- Check all microscope settings and confirm the system prompt with OK. The system will start the automated focusing and scanning procedure. Once scanning is completed the data is saved to the computer for analyses. The scanning system automatically switches off after the scan is complete.
NOTE: Make sure that the lever of the microscope tube is in a position that diverts all light to the camera. - Search End, the search is terminated if the whole search has been scanned, if the maximum cell count has been reached or if the search has been canceled.
- Slide Analysis
NOTE: The completed scan is represented in Figure 6.- When the scan is completed, click the Gallery button on the side bar. Review the gallery, which consists of small images of detected cells. In this window (Figure 7), specify if the cells stored in the gallery by a criterion to be chosen from a drop-down menu. Cells are generally displayed in the order in which they have been detected.
- Click on Quality Histogram/Feature Value Diagram (Figure 8) to give the distribution of the quality measure for the detected cells, as well as the means, and the standard deviation of foci scored.
Results
Loading...
$$\rightleftharpoonup{xx}$$
$$\longleftharp{xx}$$,
$$\longrightharp{xx}$$,
For this protocol, human peripheral blood mononuclear cells (PMBCs) were isolated from whole blood of four healthy adult volunteers and were exposed to radiation doses of 0.125, 0.250, 0.500, 1.000 and 2.000 Gy. Thereafter, the samples were incubated for 1 hour at 37 °C in a humidified 5% CO2 incubator. Following fixation and immunofluorescence staining, the slides are automatically scanned and scored. Figures 6, 7, and 8 give a representation of what the software outputs to the user. An analysis window appears once the scan is completed, giving an overview of the foci scored. The gallery gives all foci scored with an interactive menu that can delete outliers and finally a histogram with a detailed data summary is given.
The γ-H2AX foci yield after exposure to γ-rays are presented in Figure 9. There was a gradual increase in the number of γ-H2AX foci with increasing dose. This graph does not only illustrate the dose dependence and sensitivity of the assay, but the fit can also be used to perform a dose estimation when a sample is received from an individual who has been exposed to an unknown dose. It is important to note that one will not have sham-irradiated control or background foci levels for this individual. Therefore, Figure 9 includes the 0 Gy value of the sham-irradiated control samples, which was 0.57 ± 0.23 Gy for the four adult donors in this study.
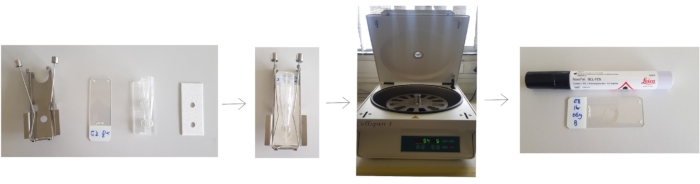
Figure 1: Preparation of slides for cytocentrifugation. Place the slide into the clip holder, add the filter card on top of it, and finally the funnel. Secure the slide clips and place into the cytocentrifuge. After cytocentrifugation, remove the slide from the clip holder and draw a circle around the spot with the cells using a hydrophobic pen. Please click here to view a larger version of this figure.
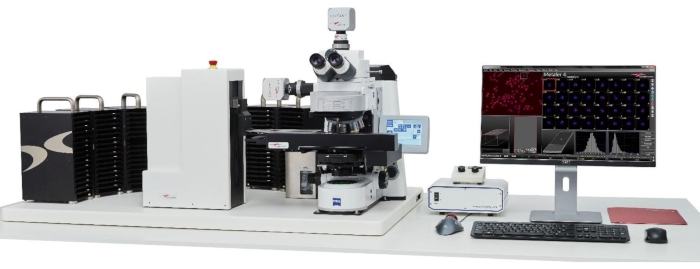
Figure 2: The automated scanning platform that was used in this protocol, containing an automated scanner attached to a fluorescent microscope. Please click here to view a larger version of this figure.
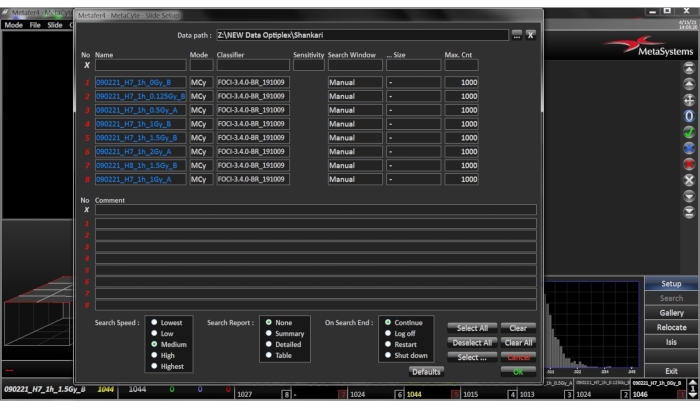
Figure 3: Menu for slide setup. Open the dialogue by clicking the SETUP button in the sidebar. Select or enter the target directory for the result files Please click here to view a larger version of this figure.
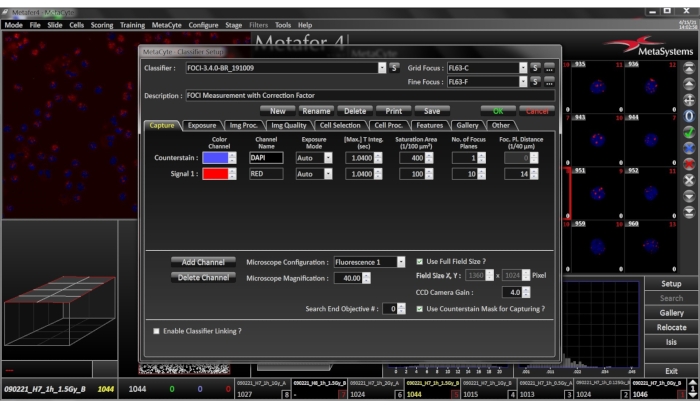
Figure 4: Classifier Setup Menu. Ensure that the selected classifier settings match the current cell type, preparation conditions, and staining patterns of the sample. Please click here to view a larger version of this figure.
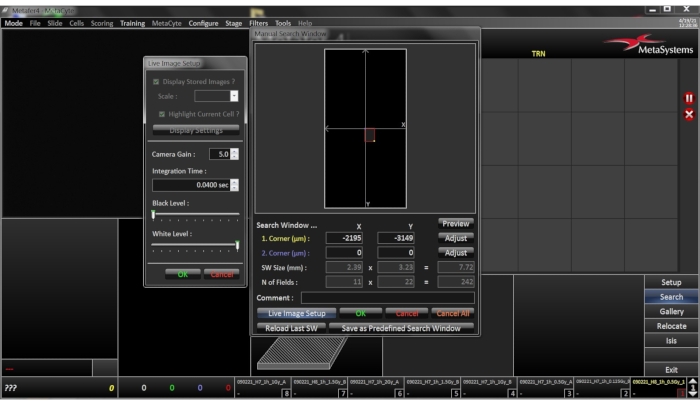
Figure 5: Setup menu for Manual Search Window. Window was selected in slide setup; a dialogue will open allowing for determination of the scan area. By using the 10x objective, the rectangular search area on the slide is selected interactively by fixing two corners of the search field by left click of the mouse. Please click here to view a larger version of this figure.
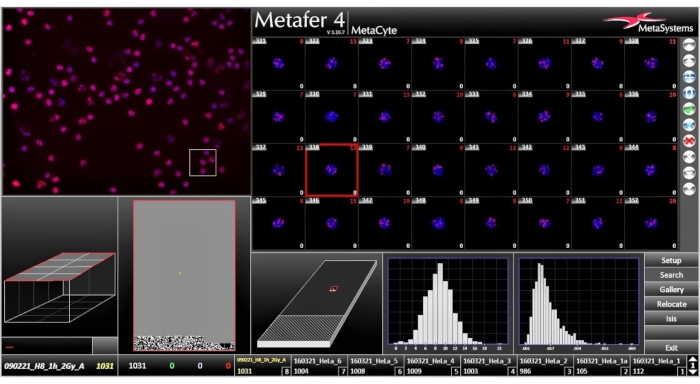
Figure 6: Analysis Window, once the scan is completed, the analysis window shows the results of the scan. Please click here to view a larger version of this figure.
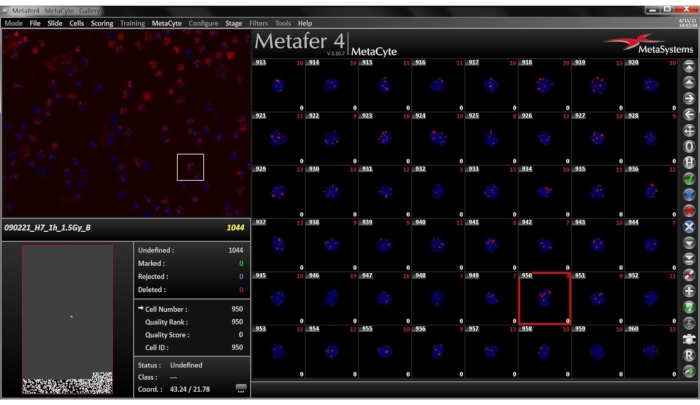
Figure 7: Gallery View for the selected slide. The Gallery tab is found on the side bar. The image gallery consists of small images of the cells detected, displayed as a combined DAPI-TRITC image. In the lower left and right corner of each image the direct foci count and the corrected foci counts are displayed. Please click here to view a larger version of this figure.
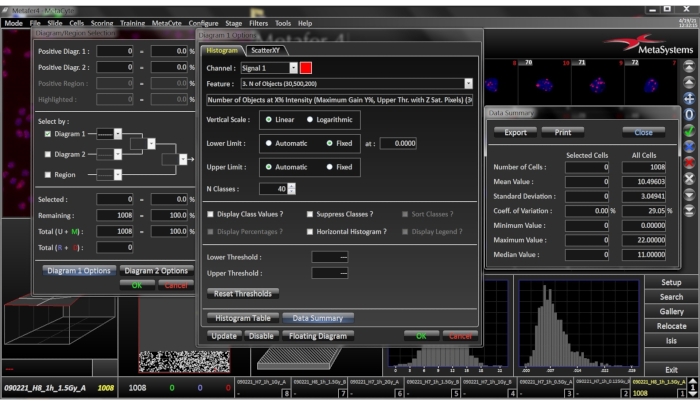
Figure 8: Histogram images for the selected slide. This window is opened by right clicking the histogram. By clicking on the histogram, the histogram tab sheet provides a data summary which lists the mean, standard deviation, coefficient of variation, minimum, maximum and median values of the analyzed cells. Please click here to view a larger version of this figure.
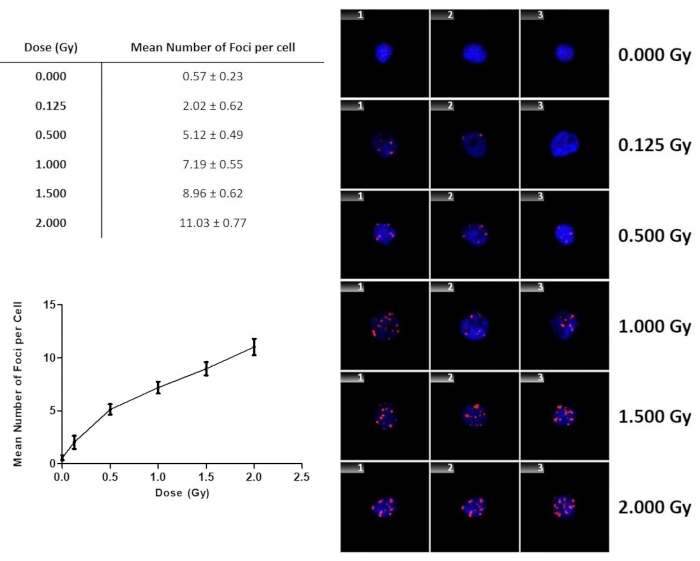
Figure 9: The number of γ-H2AX foci as a function of dose for lymphocytes exposed to 60Co γ-rays. The error bars are the standard deviations representing the interindividual variation among the donors. Data represents the mean number of γ-H2AX foci ± standard deviation of four healthy volunteers. Please click here to view a larger version of this figure.
Discussion
Loading...
$$\rightleftharpoonup{xx}$$
$$\longleftharp{xx}$$,
$$\longrightharp{xx}$$,
This protocol describes a stepwise procedure for the automated fluorescent microscopy-based scoring of the γ-H2AX foci assay. It illustrates the utility of the foci assay as a time efficient method for analyzing the number of radiation-induced DNA DSB in peripheral blood lymphocytes to perform a biological dose assessment in a radiation accident scenario where individuals might be exposed to unknown levels of IR.
In this specific protocol, PBMCs were irradiated in vitro to mimic an in vivo radiation exposure. Once the irradiation and the incubation time of one hour is completed, slides are made using a cytocentrifuge to create a concentration spot of cells on the slide. The use of a cytocentrifuge is vital to achieve standardized conditions for automated scoring. When completed, a hydrophobic pen is used to make a circle around the cells, to reduce wastage of reagents by allowing the user to localize the staining reagents. This type of pen can be used in various immunostaining techniques such as on paraffin sections, frozen sections and cytology preparations. Furthermore, it is important to select a hydrophobic pen which is compatible with enzyme and fluorescent-based detection systems. Following slide preparation, the fixation and immunofluorescence γ-H2AX staining occurred. In this protocol, the cells are fixed using 3% PFA in a PBS solution for 20 minutes. For immunostaining to succeed, it is essential that the morphology of the cells is retained and that the antigenic sites are accessible to the detection reagents being used. PFA is a relatively gentle agent for fixation and stabilizes cells while preserving protein structures51. Optimization experiments with higher PFA concentrations and longer fixation times resulted in a negative impact on the slide quality, but further storage (overnight) in 0.5% PFA up to 24 hours yielded good results.
The primary, 2F3 monoclonal antibody used in this protocol reacts to histone variant H2AX when phosphorylated at Serine 139 after DNA DSB induction. The antibody is able to bind to the phosphorylated residue with no cross reactivity with other phosphorylated histones52. Since this is a primary mouse monoclonal antibody, a secondary antibody was selected against the host species of the primary antibody while raised in an alternative host, namely donkey-anti-mouse (DAM)-TRITC. While immunofluorescent staining is based on specific antibody-epitope binding, several intermolecular forces can also result in non-specific background staining. In order to reduce non-specific binding, it is important to use a blocking reagent in immunofluorescent staining protocols53; we used a BSA solution. Furthermore, sufficient time should be allocated to this blocking step by leaving the slides in the solution for at least 20 minutes prior to primary and secondary antibody staining. In addition, the BSA solution should also be used as diluent for the primary and secondary antibodies. Depending on the anti-γ-H2AX and secondary antibody that is used for the staining, one should consider testing different antibody dilutions in order to determine the optimal concentration. For more precise scoring, a double staining can be conducted, by adding additional DNA DSB repair protein antibodies.
A major disadvantage of this type of analysis is the need to acquire blood samples as soon as possible after exposure, as the maximum number of foci is known to decrease back to normal levels within 48 hours post irradiation. Therefore, when the time of radiation accident and subsequent blood sampling is known, it could be useful to work with different calibration curves that have been established at different time points after in vitro irradiation (e.g., 4, 8, 12 and 24 hours). However, as already mentioned in the introduction section of the manuscript, the strength of the γ-H2AX foci assay lies in initial, fast triage purposes and it should be used to prioritize more time-consuming cytogenetic biological dosimetry. A combined scenario where multiple biodosimetry biomarkers are used in parallel, will generate the most reliable dose estimation and various biodosimetry laboratories worldwide have joined forces to set up nationwide networks that can be activated and used to allow multiple, parallel biodosimetry assessments by laboratories with different expertise37,54,55. In addition, developments are ongoing for superfast analysis such as a mobile laboratory on or near the accident site56. New, promising biodosimetry methods are constantly being developed, which will hopefully result in even faster and more reliable throughput in the future57.
For the automated image analysis system, slides are inserted or placed on the automated scanning platform or slide stage. Thereafter, name and save the slide details in the appropriate folder on the attached computer. For this experiment, automated nuclei and foci detection is based on the respective classifier settings. On creating a classifier, ensure that the selected classifier settings match the current cell type, preparation conditions, and immunofluorescent staining of the sample. Appropriate fluorescent channels matching the excitation spectrum of the primary and secondary antibodies are set in the classifier. The classifier allows for setting additional scoring parameters if required (e.g., nucleus size, fluorescent intensity, as described in Section 6.1). If two or more DNA repair proteins (e.g., γ-H2AX and 53BP1) are combined in an experiment, the system is also capable of detecting co-localizations of signals. First, the system acquires DAPI images, applies image processing, and identifies nuclei using morphological criteria set in the classifier. The TRITC signals are acquired using 10 z-stacks with a step size of 0.35 mm between the focal planes47. The classifier used the Direct Foci Count, where the number of distinct TRITC signals within the nucleus are scored. Here, it is important to take into consideration that with increasing radiation dose, foci signals tend to merge into larger objects, resulting in an underestimation of the actual foci number if objects are counted directly. It was not required for the analysis described here, but an additional step with Corrected Foci Count can be implemented to solve this problem. The latter allows the system to obtain the sizes of the detected signals and weighs them accordingly. Using both counting methods can provide a more realistic estimation of the actual number of foci at higher doses.
To begin automated scanning, the scan area is determined by using the 10x objective of the microscope to make a rectangular search area by fixing two corners of the search field by left click of the mouse (Figure 5), followed by focusing the start position. The reference object is selected automatically, and the software prompts the user to focus and center a reference nucleus (using the 40x objective) for each slide. After the search has begun, the system will move to the center of the search window of the first selected slide and will request to center and focus the reference object. This object will later be used as a position reference to correct any shift in the cell's positions. The second purpose of the reference field is the automatic light adjustment, in transmitted light mode the light is adjusted until the optimum light level is reached. In fluorescence mode the light level is fixed, but the integration time of the CCD camera can be increased until the required signal is measured. To enable a correct light adjustment, the reference should contain objects with typical staining. It is important to not use a field which has artifacts with very high staining intensity. Following the light adjustment, the system starts the grid autofocus at the grid position closest to the reference field. It continues to focus fields on a regular grid, moving in a meander towards the front and the back of the search window. Scanning begins when the grid autofocus is completed. The stage is moved in a meander pattern field after field to capture data. When a cell is detected, its position and gallery image are stored and displayed on the screen and the cell count is updated. If a microscope, stage or feeder error occurs, the search is automatically canceled. The only step where there is a manual intervention from the operator, is during the slide scanning set-up. This is also the point where a quick quality control check takes place (air bubbles, low cell numbers, fading of the fluorescent signal staining artefacts) and where it can be decided to abort the scanning of a slide of inferior quality. A search is terminated if the whole slide has been scanned, if the maximum cell count has been reached, or if the search has been canceled. Once the scan is completed, the data is presented as seen in Figure 6. To view scanned cells, the Gallery window is opened and each cell can be viewed (Figure 7). This is another point where the operator can perform a quality control by checking the focus of the gallery images and the total number of cells that have been scored. If too many cells are out of focus or too little cells were detected by the system to make a realistic dose estimation (e.g., 100 cells instead of the intended 1000 cells), then the decision should be made to exclude the slide and the automatic score from the final evaluation. All data are summarized in histograms (Figure 8), together with information on the distribution, the means, and the standard deviation of foci scored for each cell. The histograms can also be used to select and display sub-populations of nuclei based on the automated findings for review. Statistical analyses on the results are performed after the distribution, mean, and the standard deviation of the number foci per cell have been recorded manually. The graph can be used as a calibration curve for making a dose estimation of a biodosimetry sample. This can be done using the equation of the trend line to make an approximate estimation of the dose received. Moreover, Figure 9 illustrates that the automated scanning is sensitive enough to detect foci induced at low doses. Furthermore, the results show a clear linear increase of the number of foci per cell with dose. It should be noted that the results are only representative for the used classifier, results will differ for different classifier parameters. Therefore, in case of a biodosimetry analysis, it is important that the same classifier and slide preparation are used for the biodosimetry samples as the ones that have been used to establish the calibration curve that is used to perform the dose estimation. While it was out of the scope of this study, it is important to note that the γ-H2AX foci assay can also be used to determine partial body irradiations. Most accidental radiation exposures are inhomogeneous or partial body exposures, where only a localized region of the body received a high dose exposure. Several studies illustrated that it is possible to use the γ-H2AX foci assay to estimate the fraction of the body that has been irradiated and the dose to the irradiated fraction42. When a whole-body irradiation takes place, there will be random induction of DNA DSB in all cells and one can expect to find a Poisson distribution. Similar to cytogentic methods where the induction of chromosomal aberrations tends to be over dispersed in peripheral blood lymphocytes where there is a high abundance of cells with multiple aberrations and cells with normal metaphases, dispersion analysis of γ-H2AX foci using a contaminated Poisson method suggested over dispersed foci distributions58. The latter was also confirmed in in vivo experiments with minipigs and a rhesus macaque59.
Disclosures
Loading...
$$\rightleftharpoonup{xx}$$
$$\longleftharp{xx}$$,
$$\longrightharp{xx}$$,
C. Schunck is an employee of MetaSystems Hard & Software GmbH, Altlussheim, Germany.
Acknowledgements
Loading...
$$\rightleftharpoonup{xx}$$
$$\longleftharp{xx}$$,
$$\longrightharp{xx}$$,
The authors would like to thank the study participants for their blood donations, as well as Nurse V. Prince for blood sample collection. The financial assistance of the South African National Research Foundation (NRF) towards this research is hereby acknowledged. Opinions expressed, and conclusions arrived at, are those of the authors and are not necessarily to be attributed to the NRF. This work was financially supported by the International Atomic Energy Agency (IAEA), through a Technical Cooperation Project (number: URU6042) to support W. Martínez-López, as well as the Coordinated Research Project E35010 (contract number: 22248).
Materials
| Name | Company | Catalog Number | Comments |
|---|---|---|---|
| Bovine serum albumin - BSA | Merck | A3059 | |
| Coplin Jar | Sigma | S6016 | |
| Cover Slips (Size 24 x 50 mm) | Lasec | Glass2C29M2450Rec | |
| Cryogenic Vials (1.2 mL) | WhiteSci | 607101 | |
| Cytospin | Healthcare Technologies | JC370-12-L | |
| Cytospin Clips | Healthcare Technologies | JC302 | |
| Cytospin filter cards | Healthcare Technologies | JC307 | |
| Cytospin Funnels | Healthcare Technologies | JC372 | |
| DAM-TRITC | Invitrogen | A16022 | |
| DAPI-Fluroshield | Sigma/Merck | F6057 | |
| Ethanol | Kimix | ETD901 | |
| Filter tips | WhiteSci | 200ul (312012) and 1000ul (313012) | |
| Hydrochloric acid- HCl | Merck | ||
| Histopaque | Sigma/Merck | 10771 | |
| lithium–heparin collection tubes | The Scientific Group | 367526 | |
| MetaSystems - Metafer | Metasystems | Azio Imager Z2: 195-041848 | |
| NaOH | Merck | 221465 | |
| NovoPen | Leica Biosystems | NCL-PEN | |
| Paraformaldehyde | Sigma/Merck | 158127 | |
| Phosphate-buffered saline Tablets | Separations | SH30028,02 | |
| Pipettes | WhiteSci | P11037 and P1033 | X-tra Clipped Corner Slides are clipped at 45° angles to help reduce glass breakage. |
| Purified anti-H2A.X Phospho (Ser139) Antibody | Biolegend | 613402 / 100 μg | |
| RPMI medium | WhiteSci | BE12-702F | |
| Triton X-100 (Octoxinol 9) | Sigma/Merck | T-9284 | |
| Tubes (15ml) | WhiteSci | 601002 | |
| X-Tra adhesive slides – corner clipped | SMM Technologies | 3800200E |
References
Loading...
$$\rightleftharpoonup{xx}$$
$$\longleftharp{xx}$$,
$$\longrightharp{xx}$$,
- Barnes, J. L., et al. Carcinogens and DNA damage. Biochemical Society Transactions. 46 (5), 1213-1224 (2018).
- Little, J. B. Radiation carcinogenesis. Carcinogenesis. 21 (3), 397-404 (2000).
- Barquinero, J. F., et al. Lessons from past radiation accidents: Critical review of methods addressed to individual dose assessment of potentially exposed people and integration with medical assessment. Environment International. 146, 106175(2021).
- International Atomic Energy Agency. Radiotherapy in Cancer Care: Facing The Global Challenge. International Atomic Energy Agency. , IAEA. Vienna. (2017).
- Achel, D. G., et al. Towards establishing capacity for biological dosimetry at Ghana Atomic Energy commission. Genome Integrity. 7 (1), 1-5 (2016).
- Sullivan, J. M., et al. Assessment of biodosimetry methods for a mass-casualty radiological incident: Medical response and management considerations. Health Physics. 105 (6), 540-554 (2013).
- Rea, M. E., et al. Proposed triage categories for large-scale radiation incidents using high-accuracy biodosimetry methods. Health Physics. 98 (2), 136-144 (2010).
- Swartz, H. M., et al. A critical assessment of biodosimetry methods for large-scale incidents. Health Physics. 98 (2), 95-108 (2010).
- International Atomic Energy Agency. Cytogenetic Dosimetry: Applications in Preparedness for and Response to Radiation Emergencies. International Atomic Energy Agency. , IAEA. Vienna. (2011).
- Grégoire, E., et al. Twenty years of FISH-based translocation analysis for retrospective ionizing radiation biodosimetry. International Journal of Radiation Biology. 94 (3), 248-258 (2018).
- Moroni, M., et al. Evaluation of the gamma-H2AX assay for radiation biodosimetry in a swine model. International Journal of Molecular Sciences. 14 (7), 14119-14135 (2013).
- Rothkamm, K., et al. Laboratory Intercomparison on the γ-H2AX Foci Assay. Radiation Research. 180 (2), 149(2013).
- Barnard, S., et al. The first gamma-H2AX biodosimetry intercomparison exercise of the developing european biodosimetry network RENEB. Radiation Protection Dosimetry. 164 (3), 265-270 (2015).
- Moquet, J., et al. The second gamma-H2AX assay inter-comparison exercise carried out in the framework of the European biodosimetry network (RENEB). International Journal of Radiation Biology. 93 (1), 58-64 (2017).
- Vinnikov, V., et al. Clinical Applications of Biomarkers of Radiation Exposure: Limitations and Possible Solutions Through Coordinated Research. Radiation Protection Dosimetry. 186 (1), 3-8 (2019).
- Mariotti, L. G., et al. Use of the γ-H2AX assay to investigate DNA repair dynamics following multiple radiation exposures. PLoS ONE. 8 (11), 1-12 (2013).
- Ivashkevich, A. N., et al. γH2AX foci as a measure of DNA damage: A computational approach to automatic analysis. Mutation Research - Fundamental and Molecular Mechanisms of Mutagenesis. 711 (1-2), 49-60 (2011).
- Rogakou, E. P., et al. Megabase chromatin domains involved in DNA double-strand breaks in vivo. Journal of Cell Biology. 146 (5), 905-915 (1999).
- Sedelnikova, O. A., et al. Quantitative Detection of 125 IdU-Induced DNA Double-Strand Breaks with γ-H2AX Antibody. Radiation Research. 158 (4), 486-492 (2002).
- Han, J., et al. Quantitative analysis reveals asynchronous and more than DSB-associated histone H2AX phosphorylation after exposure to ionizing radiation. Radiation Research. 165 (3), 283-292 (2006).
- Jaworska, A., et al. Operational guidance for radiation emergency response organisations in Europe for using biodosimetric tools developed in EU multibiodose project. Radiation Protection Dosimetry. 164 (1-2), 165-169 (2015).
- Kulka, U., et al. Realising the european network of biodosimetry RENEB - status quo. Radiation protection dosimetry. 164 (1), 42-45 (2015).
- Sánchez-Flores, M., et al. γH2AX assay as DNA damage biomarker for human population studies: Defining experimental conditions. Toxicological Sciences. 144 (2), 406-413 (2015).
- Raavi, V., et al. Potential application of γ-H2AX as a biodosimetry tool for radiation triage. Mutation Research/Reviews in Mutation Research. 787, 108350(2020).
- Lassmann, M., et al. In vivo formation of γ-H2AX and 53BP1 DNA repair foci in blood cells after radioiodine therapy of differentiated thyroid cancer. Journal of Nuclear Medicine. 51 (8), 1318-1325 (2010).
- Vandevoorde, C., et al. γ-H2AX foci as in vivo effect biomarker in children emphasize the importance to minimize x-ray doses in paediatric CT imaging. European Radiology. 25 (3), 800-811 (2015).
- Beels, L., et al. γ-H2AX foci as a biomarker for patient X-ray exposure in pediatric cardiac catheterization: Are we underestimating radiation risks. Circulation. 120 (19), 1903-1909 (2009).
- Bogdanova, N. V., et al. Persistent DNA double-strand breaks after repeated diagnostic CT scans in breast epithelial cells and lymphocytes. Frontiers in Oncology. 11, 1-14 (2021).
- Schumann, S., et al. DNA damage in blood leukocytes of prostate cancer patients undergoing PET/CT examinations with [68Ga]Ga-psma. Cancers. 12 (2), 1-14 (2020).
- Ivashkevich, A., et al. Use of the γ-H2AX assay to monitor DNA damage and repair in translational cancer research. Cancer Letters. 327 (1-2), 123-133 (2012).
- Moquet, J., et al. Gamma-H2AX biodosimetry for use in large scale radiation incidents: Comparison of a rapid "96 well lyse/fix" protocol with a routine method. PeerJ. 2014 (1), 1-11 (2014).
- Turner, H. C., et al. Adapting the γ-H2AX Assay for Automated Processing in Human Lymphocytes. Radiation Research. 175 (3), 282-290 (2008).
- Sharma, P. M., et al. High Throughput Measurement of γ H2AX DSB Repair Kinetics in a Healthy Human Population. PLoS ONE. 10 (3), 0121083(2015).
- Vandevoorde, C., et al. EPI-CT: In vitro assessment of the applicability of the γ-H2AX-foci assay as cellular biomarker for exposure in a multicentre study of children in diagnostic radiology. International Journal of Radiation Biology. 91 (8), 653-663 (2015).
- MacPhail, S. H., et al. Cell cycle-dependent expression of phosphorylated histone H2AX: Reduced expression in unirradiated but not X-irradiated G1-phase cells. Radiation Research. 159 (6), 759-767 (2003).
- Barnard, S., et al. The shape of the radiation dose response for DNA double-strand break induction and repair. Genome Integrity. 4 (1), 1(2013).
- Kulka, U., et al. Biodosimetry and biodosimetry networks for managing radiation emergency. Radiation Protection Dosimetry. 182 (1), 128-138 (2018).
- Macaeva, E., et al. Gene expression-based biodosimetry for radiological incidents: assessment of dose and time after radiation exposure. International Journal of Radiation Biology. 95 (1), 64-75 (2018).
- Khanna, K. K., et al. DNA double-strand breaks: Signaling, repair and the cancer connection. Nature Genetics. 27 (3), 247-254 (2001).
- Rothkamm, K., et al. γ-H2AX as protein biomarker for radiation exposure. Annali dell'Istituto Superiore di Sanita. 45 (3), 265-271 (2009).
- Borràs, M., et al. Comparison of methods to quantify histone H2AX phosphorylation and its usefulness for prediction of radiosensitivity. International Journal of Radiation Biology. 91 (12), 915-924 (2015).
- Horn, S., et al. Gamma-H2AX-based dose estimation for whole and partial body radiation exposure. PLoS ONE. 6 (9), 1-8 (2011).
- Costes, S. V., et al. Imaging Features that Discriminate between Foci Induced by High- and Low-LET Radiation in Human Fibroblasts. Radiation Research. 165 (5), 505-515 (2006).
- Leatherbarrow, E. L., et al. Induction and quantification of γ-H2AX foci following low and high LET-irradiation. International Journal of Radiation Biology. 82 (2), 111-118 (2006).
- Mistrik, M., et al. Low-dose DNA damage and replication stress responses quantified by optimized automated single-cell image analysis. Cell Cycle. 8 (16), 2592-2599 (2009).
- Oeck, S., et al. The Focinator - a new open-source tool for high-throughput foci evaluation of DNA damage. Radiation Oncology. 10 (1), 1-11 (2015).
- Vandersickel, V., et al. Early increase of radiation-induced γH2AX foci in a humanku70/80 knockdown cell line characterized by an enhanced radiosensitivity. Journal of Radiation Research. 51 (6), 633-641 (2010).
- Sambrook, J., et al. Molecular cloning : a laboratory manual. , Cold Spring Harbor Laboratory. Cold Spring Harbor, N.Y. (2001).
- Rifai, A., et al. B and T lumphocytes. Recent Advances in IgA Nephropathy. (6), 193-210 (2009).
- Andreo, P., et al. Absorbed dose determination in external beam radiotherapy: An international code of practice for dosimetry based on absorbed dose to water. International Atomic Energy Agency. , Technical Report Series No. 398 (2001).
- Jamur, M. C., et al. Cell fixatives for immunostaining. Methods in Molecular Biology. 588, 55-61 (2010).
- Rogakou, E. P., et al. DNA Double-stranded Breaks Induce DNA Double-stranded Breaks Induce Histone H2AX Phosphorylation on Serine 139. Journal of Biological Chemistry. 273 (10), 1-12 (1998).
- Kyuseok, I. An introduction to Performing Immunofluorescence Staining. Methods in Molecular Biology. 1897, 299-311 (2019).
- Ainsbury, E. A., et al. Multibiodose radiation emergency triage categorization software. Health Physics. 107 (1), 83-89 (2014).
- Ainsbury, E. A., et al. Dose estimation software for radiation biodosimetry. Health Physics. 98 (2), 290-295 (2010).
- Turner, H. C., et al. The RABiT: High-throughput technology for assessing global DSB repair. Radiation and Environmental Biophysics. 53 (2), 265-272 (2014).
- Wang, Q., et al. Development of the FAST-DOSE assay system for high-throughput biodosimetry and radiation triage. Scientific Reports. 10 (1), 1-11 (2020).
- Rothkamm, K., et al. Leukocyte DNA damage after multi-detector row CT: A quantitative biomarker of low-level radiation exposure. Radiology. 242 (1), 244-251 (2007).
- Redon, C. E., et al. an analysis method for partial-body radiation exposure using γ-H2AX in nonhuman primate lymphocytes. Radiation Measurements. 46 (9), 877-881 (2011).
Reprints and Permissions
Request permission to reuse the text or figures of this JoVE article
Request Permission