This paper presents a detailed stepwise protocol on how to utilize an integrated multi-functional and user-programmable system that enables automatic multi-channel imaging and mechanobiological analysis to elucidate the mechano-sensitivity of Yes-associated protein (YAP).
Method Article
All-optical Mechanobiology Interrogation of Yes-associated Protein in Human Cancer and Normal Cells using a Multi-functional System
* These authors contributed equally
In This Article
Summary
Abstract
Long-term multi-functional imaging and analysis of live cells require streamlined, functional coordination of various hardware and software platforms. However, manual control of various equipment produced by different manufacturers is labor-intensive and time-consuming, potentially decreasing the accuracy, reproducibility, and quality of acquired data. Therefore, an all-in-one and user-programmable system that enables automatic, multi-functional, and long-term image acquisition and is compatible with most fluorescent microscopy platforms can benefit the scientific community. This paper introduces the complete operating protocols of utilizing a novel integrated software system that consists of (1) a home-built software program, titled "Automatic Multi-functional Integration Program (AMFIP)," which enables automatic multi-channel imaging acquisition, and (2) a suite of quantitative imaging analysis and cell traction computation packages.
This integrated system is applied to reveal the previously unknown relationship between the spatial-temporal distribution of mechano-sensitive Yes-associated protein (YAP) and the cell mechanics, including cell spreading and traction, in CRISPR/Cas9-engineered human normal cells (B2B) and lung cancer cells (PC9). Leveraging this system's capability of multi-channel control and readout, the result shows: (1) B2B normal cells and PC9 cancer cells show a distinct relationship between YAP expression, traction, and cell dynamics during cell spreading and migration processes; and (2) PC9 cancer cells apply noticeable peri-nuclear forces on substrates. In summary, this paper presents a detailed stepwise protocol on how to utilize an integrated user-programmable system that enables automatic multi-functional imaging and analysis to elucidate YAP mechano-sensitivity. These tools open the possibility for detailed explorations of multifaceted signaling dynamics in the context of cell physiology and pathology.
Introduction
The overall goal of this method is to enable all-optical multi-functional imaging and analysis of living cells. An all-in-one imaging program that enables the automatic coordination of multi-functional optoelectronic devices will reduce labor-intensive and error-prone manual operations and is essential for researchers to conduct long-term live-cell imaging1,2,3,4. However, most existing public programs in the biomedical research community either only apply to limited optoelectronic devices or require additional hardware for the coordination of different equipment5,6,7,8,9. Recently, an open-source and software-based program has been developed, titled "Automatic Multi-functional Integration Program (AMFIP)," enabling multi-channel and time-lapse imaging. Based on Java language and the Application Programming Interface (API) of µManager11,12, AMFIP was developed as a plugin in µManager that executes customized Java scripts to accomplish software-based communications of multiple optoelectronic hardware and software platforms, including but not limited to those from Nikon. The establishment of AMFIP opens the possibility for programmable and multi-functional interrogation of cell behaviors. An integrated experimental and computational system is developed in this paper and combines AMFIP with digital imaging analysis and cell traction force microscopy. The system enables the elucidation of the distinct YAP mechanobiology in CRISPR/Cas9-engineered human normal B2B (Figure 1) and lung cancer PC9 (Figure 2) cell lines. The system provides the scientific community a comprehensive solution that avoids the demand of purchasing additional controlling devices that may not be available for and/or compatible with every imaging system.
The protocols presented in this paper introduce how to (1) apply AMFIP to conduct automatic long-term imaging for both CRISPR/Cas9-engineered cell lines that express mNEonGreen2-tagged YAP; and (2) combine Fiji ImageJ, MATLAB, and Origin for the quantitative analysis of YAP nuclear/cytoplasm (N/C) ratio based on their fluorescent intensity (Figure 3 and Figure 4), cellular displacement field (Figure 1C and Figure 2C), and cellular traction field (Figure 1D and Figure 2D). The results suggest that (1) during the first 10 h of cell spreading on the substrates that have physiologically relevant mechanical stiffness13,14,15,16,17,18, the YAP N/C ratio of single B2B cells shows more noticeable time-dependent variation and fluctuation compared to that of single PC9 cells (Figure 5 and Figure 6); and (2) PC9 cancer cells generate noticeable traction in their peri-nuclear regions (Figure 7). The integrated system and methodologies described in this protocol transcend the specific types of cells and optogenetic molecules. Researchers can apply the protocols to customize their specific live-cell interrogation experiments and elucidate multifaceted signaling dynamics in the context of cell physiology and pathology.
Protocol
1. Generation of stable CRISPR/Cas9-edited human lung cancer cell line (PC9) and human bronchial epithelial cell line (Beas2B) that endogenously express mNeonGreen21-10/11-tagged YAP protein
- Perform polymerase chain reaction (PCR) to amplify the DNA sequence coding the 11th strand of the fluorescence protein, mNeonGreen2, using the high-fidelity DNA polymerase (see the Table of Materials).
- Knock-in the amplified DNA sequence into the YAP genomic locus of the PC9 and B2B cell lines using the CRISPR-Cas9 gene-editing system.
NOTE: This DNA sequence complements strands 1-10 of mNeonGreen2 to emit fluorescence. The genomic sequence map of YAP-mNeonGreen21-10/11 is shown in Supplemental Figure S1. The map contains the labeled genomic, donor, and mNeonGreen2 sequences. - Check the CRISPR/Cas9-engineered mNeonGreen2 expression using an epifluorescence microscope (see the Table of Materials). Because the mNeonGreen2 is tagged to YAP whenever the cells express YAP in the context of its native gene regulatory network, check the presence of the fluorescence intensity in both CRISPR/Cas9-engineered cells and compare it to that in the parental cells (control).
NOTE: To follow this protocol, use (1) a 488 nm laser (47.5 mW/mm2) for excitation, (2) a 40x objective (numerical aperture (NA) = 0.95) and a band-pass emission filter (ET525/50 nm) for fluorescence measurement, and (3) ImageJ software to measure, quantify, and compare the fluorescence intensities. - Confirm the correct integration of mNeonGreen211 by extracting genomic DNA from the CRISPR/Cas9-edited cell lines; perform PCR using primers flanking the genomic insert and sequencing to confirm the insertion at the correct genomic loci19,20.
- Knock down the mNeonGreen211 using the CRISPR/Cas9 gene-editing system, and check the fluorescence intensity reduction in cells using the same microscope systems and imaging parameters described in step 1.3.
NOTE: This step confirms the correct integration of mNeonGreen211 by the comparison of fluorescence intensities. The CRISPR/Cas9-engineered cells without knock-down and parental cells are used as control. - Collect the cells with the tagged protein of interest through fluorescence-activated cell sorting (FACS) sorting.
- To prepare cells for FACS sorting, trypsinize them and resuspend them in phosphate-buffered saline (PBS).
- Collect cells with mNeonGreen2 fluorescence above the background level of the parental cell lines in two enriching rounds of FACS sorting.
NOTE: The timeline to generate the CRISPR/Cas9-edited cell lines described here is on the order of 1-2 months. All cell lines are made publicly available upon request so other research laboratories can reproduce the results.
2. Maintenance of PC9 and B2B cells
- Maintain both cell lines in humidified tissue-culture incubators with 5% CO2 at 37 °C.
- Culture 106 endogenously tagged PC9 and Beas2B cells in 75 cm2 flasks with 12 mL of RPMI-1640 medium supplemented with 10% fetal bovine serum and 100 µg/mL penicillin-streptomycin. Subculture both cell lines when the cell confluency reaches ~80%.
- Test both cell lines for mycoplasma every 3 months using a mycoplasma detection kit, following all manufacturer's recommended protocols strictly.
- Store the cell lines in a -80 °C freezer.
- Use the cell lines that are <20 passages from thaw for all the experiments.
3. Setup of hardware and software environment
- Hardware environment setup of the experiment
- Connect the confocal controller and the inverted microscope to the computer (see the Table of Materials).
- Install the software platform (Table of Materials).
- Turn on the confocal controller and the inverted microscope. Next, launch Elements.
- Open the control panels of the confocal, laser, and the inverted microscope in Elements. Next, check whether the three panels function properly by testing the movement of the motorized stage, the switching of the microscope objectives, and the spatial scanning of the laser lines.
- Software environment setup of AMFIP
- Install IntelliJ, Java Development Kit 14.0, µManager version 2.0 gamma, and Fiji ImageJ on the computer.
- Open the AMFIP project downloaded from GitHub (link: https://github.com/njheadshotz/AMFIP) in IntelliJ.
- Click on Settings | Compiler | Annotation Processors and check Enable annotation processing.
- Click on Project Structure | Artifacts and create a JAR file. Set the output directory to mmplugins under the µManager directory.
- Click on Project Structure | Libraries and add mmplugins and plugins under the µManager directory.
- Click on add Configuration under the Run drop-down menu and create an application.
- Enter ij.ImageJ into the Main class.
- Enter -Xmx3000m -Dforce.annotation.index=true into VM option.
- Set the µManager directory to the Work directory.
- Click on Run to activate µManager with the AMFIP plugin.
- Connect µManager with the inverted microscope.
- Add the adaptive driver of the inverted microscope21 to the µManager directory.
- Open µManager. Click on Devices | Hardware Configuration Wizard and create a new configuration.
- Add the Ti2 driver under Available Devices.
- Select all peripheral devices and save the new configuration file.
- Restart µManager and select the configuration file in step 3.2.4 in Micro-Manager Startup Configuration.
4. Gel preparation
- Treat the glass coverslip with 3-aminopropyltrymethoxysilane for 7 min at room temperature (24 °C).
- Use deionized (DI) water to rinse the glass coverslip and dry the coverslip for 20 min at 160 °C.
- Treat the glass coverslip with 0.5% glutaraldehyde for 30 min and rinse with DI water.
- Mix acrylamide solution, N,N′-methylenebisacrylamide (bis) solution, and fluorescent beads suspended in 10 mM HEPES-buffered saline. Use 10% (w/v) ammonium persulfate solution and N,N,N′,N′-tetramethylethylenediamine (TEMED) as initiators of polymerization. Change the percentage of each component to achieve the desired mechanical stiffness of polyacrylamide (PAA) hydrogels following established protocols described previously13,14.
NOTE: In this protocol, 2 kPa gel: acrylamide = 12.5% and bis-acrylamide = 6.5%; 5 kPa gel: acrylamide = 12.5% and bis-acrylamide = 21.5%; and 40 kPa gel: acrylamide = 12.5% and bis-acrylamide = 31.5%. All % listed are volume percentage. - After 35 min, peel the glass coverslip from the solidified PAA hydrogel and wash the hydrogel with 50 mM HEPES-buffered saline twice (5 min each time).
- Treat the hydrogel surface with a hydrazine-hydrate solution for 6 h.
- Rinse the hydrogel with acetic acid for 30 min. Remove the acetic acid and rinse with PBS for 30 min.
- Oxidize the fibronectin solution (50 µg/mL in PBS) with sodium periodate for 30 min.
- Coat the hydrogel surface with the oxidized fibronectin solution and wait for 35 min.
- Add PBS to immerse the hydrogel and store at 4 °C. Cover all the Petri dishes that contain the hydrogels with aluminum foil to avoid any light exposure to the hydrogels.
5. Cell culture
NOTE: Perform cell culture using aseptic technique.
- Bond the glass coverslips with the PAA hydrogels to the 35 mm glass-bottom Petri dish to avoid physical drift of gels during the cell seeding and imaging processes.
- Using sterilized clean tweezers, lift the coverslip (with the PAA hydrogel on top) from the Petri dish containing the prepared gels.
- Use a dry wipe to clean up water droplets on the bottom surface of the glass coverslip.
- Use the sterilized tweezers to hold the glass coverslip.
- Place small droplets (1-5 µL) of cyanoacrylate glue at the two diagonal corners on the bottom surface.
- Use sterilized wipes to remove excess glue.
- Use the sterilized tweezers to replace the coverslip in the glass-bottom Petri dish. Slightly press the corners of the coverslip to ensure that the glue droplets make full contact with the surface of the Petri dish.
- Place the lid back onto the Petri dish to minimize the evaporation of PBS in the PAA hydrogels. Wait for 3 min to allow the glue to solidify and dry in the Petri dish.
- Fill the Petri dish with 4 mL of PBS.
- Repeat the above steps 5.1.1-5.1.8 for the remaining PAA hydrogel samples in the Petri dishes used for imaging.
- Use 75% ethanol to sterilize the outer surface of all the Petri dishes and transfer them to the tissue culture biosafety cabinet. Turn on the ultraviolet light for 5 min and sterilize the samples.
- Seed the cells onto the top surface of the gel.
- Turn off the ultraviolet light. Take out the flask (containing B2B/PC9 cells) from the 37 °C incubator into the biosafety cabinet. Use a pipette connected to a vacuum pump to aspirate all the culture medium and add 5 mL of PBS to wash the flask.
- Add 2 mL of 0.05% trypsin to detach the cells from the bottom of the flask.
- Place the flask in the incubator. Wait for 5 min.
- Transfer the flask to the biosafety cabinet. Add 8 mL of fresh culture medium to the flask and pipette up and down several times to suspend the cells homogeneously.
- Transfer all the 10 mL of the cell suspension to a 15 mL tube and centrifuge at 300 × g for 5 min.
- Check the cell pellet at the bottom of the tube. Slowly tilt the tube horizontally and use the aspirating pipette to remove all the culture medium from the tube without touching the cell pellet. Next, add 8 mL of fresh culture medium and pipette up and down several times until all the cells are mixed homogeneously with the medium.
- Deposit 100 µL of the cell suspension (150 cells/µL) onto the gel surface and wait for 5 min. Next, slowly add 4 mL of fresh culture medium to the Petri dishes; avoid adding the fresh medium directly onto the gel.
- Place the Petri dish in the 37 °C incubator. Wait to allow the cells to attach to the gel surface (B2B: 0.5-1 h; PC9: 4-5 h).
6. Cell imaging
NOTE: AMFIP enables automatic, multi-channel, and long-term imaging by coordinating with different hardware and software systems: (1) AMFIP manipulates µManager to automatically move the motorized stage of the Ti2-E microscope to multiple fields-of-view (FOVs) and acquire bright-field images through a monochrome camera (Table of Materials); and (2) AMFIP activates multiple macro files inside Elements with a customized Java script to accomplish automatic operations for confocal z-stack imaging and the switching of different laser channels (405 nm and 488 nm).
- Set the environment for long-term imaging.
- Place the environment chamber onto the motorized stage of the inverted microscope. Set the CO2 flow rate to 160 mL/min and adjust the temperature of the chamber (top: 44 °C; bath: 42 °C; stage: 40 °C). Next, add 40 mL of purified water into the bath of the chamber.
- Take out the glass-bottom Petri dish with cells from the incubator and place it into the environment chamber.
- Turn on the confocal controller and the inverted microscope. Switch the light path to the right and observe the cells attaching using µManager. If sufficient cells have attached to the gel, transfer the Petri dish back to the incubator. If not enough cells have attached to the gel, continue the cell incubation for another 30 min for B2B and 60 min for PC9 cells.
- Cut two small pieces of adhesive tape and stick them on the chamber around the circular hole. Next, apply a little adhesive glue onto the tape (only on the area that the Petri dish will cover).
- Take out the Petri dish from the incubator. Next, slowly place the Petri dish in the chamber and let the bottom of the dish make contact with the glue.
- Press the lid of the Petri dish for 1 min to allow the glue to make full contact with the Petri dish and solidify. Next, gently push the Petri dish horizontally to confirm that the Petri dish is unmovable in the chamber.
- Close the lid of the chamber.
- Set the image acquisition parameters for bright-field imaging.
- Open IntelliJ and set a parameter T1 (e.g., 120 s) in line 93 of the file Elements_script. java. Ensure that this value is larger than the running time of the macro in Elements used for the confocal imaging of one field of view (FOV). Click on the Run button to start the AMFIP IntelliJ project.
- Click Live and Multi-D Acq. button on the main interface of µManager. Next, switch the light path of the inverted microscope to the right for bright-field imaging, switch to the 10x objective, and open the light-emitting diode (LED) light (the light source for bright-field imaging; intensity: 5%).
- Click on the light path, microscope objective, and LED lamp button in the Elements Ti2 Panel or manually press the corresponding buttons on the microscope.
- Adjust the XY joystick and the knob of the Z-plane to find the correct position and the in-focus plane of the gel on the Petri dish. Use a 10x objective to find the appropriate FOVs of multiple single cells attached to the gel.
- Check the Multiple Positions (XY) box on the Multi-Dimensional Acquisition window. Click on the Edit Position List... button and observe the Stage Position List window that pops up. Next, change the objective to 40x, increase the intensity of the LED light to 15%, re-adjust the XY-motorized stage to locate the FOVs, and record the coordinates by clicking on the Mark button on the Stage Position List window.
- Record 67 desired FOVs. Click on the Save As... button on the Stage Position List window to record the coordinates. Input T1 (the parameter, e.g., 120 s, defined in step 6.2.1) into the time interval of imaging acquisition to T1 in the Time Points section in the Multi-Dimensional Acquisition window.
- Set the image acquisition for 2D-YAP and bead images.
- Open Elements, change the light path to the right for confocal imaging and turn off the LED light. Next, click on the Remove Interlock button and turn on the FITC laser channel (for YAP imaging) by checking the FITC box.
- Adjust the scanning speed to 1 frame per 2 s by clicking the 1/2 button and spin the knob of the Z-plane to find the Z-position of the attached cells quickly. Record the lower and upper limits for the Z-stack.
- Click on Macro on the top ribbon, select Macro Editor under the Macro drop-down menu, and input the values from step 6.3.2 into a macro file.
- Turn on the 4′,6-diamidino-2-phenylindole (DAPI) laser channel (for bead imaging) by checking the DAPI box to find and record the focused Z-position of beads. Go to Macro editor and input the recorded values into the macro file.
- Set the task of moving the motorized stage using AMFIP.
- Go to µManager and click on Plugins | Automation to open the graphical user interface (GUI) of AMFIP. Click on Add Point or Remove point buttons to acquire the exact number of FOVs selected. Input the recorded coordinates of FOVs into the Coordinates Panel.
- Define the total experiment time in the Total Experiment Time text field.
- Click on the Additional Time Configuration button and define the time interval T2 (e.g., 30 min) of moving the motorized stage to each FOV.
- Maximize the window size of Elements and drag the GUI of AMFIP to the right side of the screen to avoid the GUI disturbing the automatic operations of the cursor.
- Click on the Enter button. After the first macro finishes, click on the Acquire! button in the Multi-Dimensional Acquisition window .
- Dissolve the cells after the image acquisition.
- After finishing the long-term imaging, stop the AMFIP task by clicking on the Pause button in the automation plugin window and the Stop button in the Multi-Dimensional Acquisition window.
- Open Elements and set Z-stack imaging by clicking the Top and Bottom buttons in the ND Acquisition window (set the Z-range to be larger than the Z-range of the beads). Switch the light path to the right and open the LED light (intensity: 15%).
- Slowly and carefully remove the lids of the chamber and the Petri dish. Meanwhile, monitor the bright-field view for any drift of the FOV.
- Using a plastic pipette to take up 0.5 mL of sodium dodecyl sulfate (SDS) solution, carefully hold the plastic pipette a little above the culture medium in the Petri dish and add 1-2 droplets of the SDS solution into the culture medium.
- Once the cells in the bright-field view are dissolved, switch the light path to the left, close the LED light, click on the Remove Interlock button.
- Run the Z-stack imaging. Save the image stack and name it as Reference_N (N is the sequence number of each FOV).
- Click on the Multiple Positions (XY) button on the Multi-Dimensional Acquisition window. Next, select the next FOV and click on the Go to button to move the motorized stage to the second FOV.
- Repeat step 6.5.7 for each FOV.
7. Measurement of the YAP N/C ratio
- Perform image analysis to measure the YAP N/C ratio using the Fiji ImageJ software (Figure 4).
- Open Fiji ImageJ. Import the bright-field image stack for all FOVs acquired by µManager.
- Open the Image drop-down menu and select Stacks | Tools | Slice Keeper. Next, export the bright-field image stack for each FOV.
- Import the fluorescence image of the FITC channel and overlay it with the bright-field image for the same FOV. To do this, choose the fluorescent image and select Overlay | Add Image... (Image to add: the bright-field image; X and Y location depends on the size of the bright-field image acquired by different cameras; Opacity: 60-70).
- Open the Analyze drop-down menu and select Set Measurements…. Select Area; Integrated density and Mean gray value.
- Click on the Freehand selections button on the main interface of ImageJ.
- Draw the outline of the cell body and the nucleus desired. Next, click on Analyze | Measure or press the M button on the keyboard.
- Observe the Results window that pops up. Note that the values under the Area column represent the area of the selected region (µm2) and the values under the IntDen column represent the fluorescence intensity of the selected region.
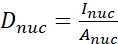
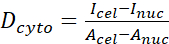
- Calculate the YAP N/C ratio using the following formulae (1), (2), and (3):
 (1)
(1)
 (2)
(2)
 (3)
(3)
Where Inuc and Icel represent the relative intensity of the nucleus and the cell body, and Anuc and Acel represent the area of the nucleus and the cell body. R is the YAP N/C ratio. - Save the outlines for future calculation of dipole traction force and peri-cell/peri-nuclear displacement. To do this, click on Analyze | Tools | Save XY Coordinates...
8. Measurement of traction field
- Apply traction force microscopy through Fiji ImageJ plugins22,23.
- Open Fiji ImageJ.
- Import the image stack of beads for a FOV.
- Select the slice that shows the clearest distribution of beads and extract it by clicking on Images | Stacks | Tools | Slice Keeper.
- Import the image stack of the reference for the same FOV.
- Choose the slice with the same brightness and contrast as the slice in step 8.1.3. Next, extract it as a reference image.
- Select Images | Stacks | Tools | Concatenate to combine the two slices from steps 8.1.3 and 8.1.5 (select the reference image as the first slice).
- Select Plugins | Template Matching | Align slices in stack or Plugins | Image Stabilizer to align the two slices.
- Select Image | Stacks | Stack to Images. Next, select Image | Lookup Tables | Green to convert the color of the first slice to green and select Image | Lookup Tables | Red to convert the color of the second slice to red.
- Select Image | Color | Merge Channels to merge the two images.
- Overlap the image with the bright-field image from the same FOV and use this overlapped image to observe bead displacement.
- Select Plugins | PIV | iterative PIV(Basic).... Set the interrogation window size to 128/256; 64/128; 32/64 (at least four beads per interrogation window). Set the correlation threshold to 0.6.
- Click on OK. After the calculation finishes, save the text file with the raw data of bead displacement into an ordinary folder created by the user.
- Select Plugins | FTTC | FTTC and choose the text file in step 8.1.9.
- Input the pixel size (µm), the Young's modulus of the gel (Pascal), and the plot width and height based on the experiment and the image of beads.
- Click on OK to automatically save the text file containing the raw data of traction force in the same directory as the text file in step 8.1.12.
- Use graphing software (Table of Materials) to plot the traction field with the same scale for multiple cells (Figure 1B,C and Figure 2B,C).
- Insert the text file that contains the raw data of traction into a spreadsheet.
- Create a new sheet, input the Y coordinates of traction into the first row (arrange from high values to low values) and the X coordinates into the first column (arrange from low to high).
- Input the value of traction to each coordinate from the raw data.
- Save the sheet in step 8.2.2 as a *.csv file.
- Open Origin.
- Click on File | Open and import the *.csv file in step 8.2.4. Select all the cells and click on Plot | Contour| Contour - Color Fill.
- In the Plotting: plotvm window, select Y across the columns to automatically set the Y values to the first row and X values to the first column. Next, name the title and click on OK.
- In the graph window that pops up, double-click on the heatmap.
- Click on Levels in the Colormap/Contours window. Next, change the scale level to a reasonable range (0300 in this analysis) and click on OK.
- Click on Lines, uncheck Show on Major Levels Only, and check Hide All. Next, click on OK.
- Right-click on the graph and select Export Graphs…. Save the image to the specified path.
- Use MATLAB to calculate the dipole cell traction.
- Save the traction raw data text file (from step 8.1.12) and cell boundary region of interest (ROI) coordinates file (from step 7.1.9) in the same folder defined in step 8.1.12. Transfer all the MATLAB files that are in place in the AMFIP package into this folder.
- Open MATLAB. Open the folder defined in step 8.1.12 and open the dipole traction calculation function file absdipole.m transferred into this folder in step 8.3.1.
- Read the two text/csv files in step 8.3.1 into the MATLAB working space and assign a matrix to two variables (e.g., traction and roi).
- Run the function absdiple (traction,roi).
NOTE: The first column of the output is the dipole traction force in nN (nano-Newton). The second column of the output is the angle of the dipole traction force with respect to the horizontal axis.
Results
Distinct YAP distribution and dynamics in CRISPR/Cas9-engineered PC9 cancer and B2B normal cells during cell spreading
Representative fluorescence images of YAP distribution in single B2B and PC9 cells on 2, 5, 40 kPa PAA gels and glass coverslip are shown in Figure 1A and Figure 2A. The nuclear localization of YAP in B2B cells increased with increasing substrate stiffness (Figure 1A), whereas PC9 cells showed similar YAP concentration in the nucleus and cytoplasm on substrates of varying stiffness (Figure 2A). Representative fluorescence images of YAP distribution in single, spreading B2B and PC9 cells on the 5 kPa hydrogel substrate (from the 0th h to the 10th h after the cells attached to the substrates) are shown in Figure 1B and Figure 2B, respectively. The B2B cell monotonically increased the spread area over time along with a decrease in the YAP N/C ratio (Figure 1B), while the PC9 cell maintained a comparatively unchanging cell spread area, orientation, and YAP N/C ratio throughout the 10 h spreading process (Figure 2B). During the 10 h duration of early spreading, the representative B2B cell constitutively deformed the substrate surface and applied time-evolving cell traction across the whole cell area (Figure 1C and Figure 1D).
In contrast, the representative PC9 cell only developed displacement and traction at the two ends of the cell body and its traction diminished after 7.5 h (Figure 2C and Figure 2D). More time-lapse images and traction measurements of B2B and PC9 cells at the early spreading stage are provided in Supplemental Figure S2 and Supplemental Figure S3. Other modes of PC9 cell dynamics were also observed (Figure 6). In parallel to these different spreading characteristics, B2B and PC9 cells showed distinct YAP distribution and dynamics (Figure 3). On a 5 kPa gel, YAP in B2B cells was concentrated in the nucleus at the 0th h and became more homogeneously distributed across the cell body at the 10th h. However, PC9 cells showed a more homogeneous distribution of YAP in the nucleus and the cytoplasm throughout the entire 10 h of the spreading process. To quantitatively analyze the YAP activity and translocation in B2B and PC9 cells, the YAP N/C ratio was calculated using the algorithm described in Figure 4.
To further investigate the distinct YAP dynamics, temporal changes in YAP N/C ratio, cell/nucleus area, and traction of multiple single B2B cells (n = 10) and PC9 cells (n = 5) were compared (Figure 5). It was found that the average YAP N/C ratio of B2B cells decreased from 2.54 ± 0.22 to 1.79 ± 0.21 (n = 10; p = 0.0022**; Figure 5A), while the average YAP N/C ratio of PC9 cells changed from 1.92 ± 0.26 to 1.57 ± 0.07 (n = 5; p = 0.187 (not significant (ns)); Figure 5A). The average dipole traction of B2B cells changed from 256.17 ± 123.69 nN to 287.44 ± 99.79 nN (p = 0.7593 (ns); Figure 5B). The average dipole traction of PC9 cells changed from 141.19 ± 33.62 nN to 168.52 ± 73.01 nN (p = 0.7137 (ns); Figure 5B). The average cell spread area of B2B cells increased from 613.89 ± 102.43 µm2 to 942.51 ± 226.71 µm2 (p = 0.0512 (ns); Figure 5C).
The average cell spread area of PC9 cells changed from 495.78 ± 97.04 µm2 to 563.95 ± 89.92 µm2 (p = 0.5804 (ns); Figure 5C). The average nucleus spread area of B2B cells increased from 181.55 ± 36.18 µm2 to 239.38 ± 43.12 µm2 (p = 0.1217 (ns); Figure 5D) and the average nucleus spread area of PC9 cells changed from 133.31 ± 30.05 µm2 to 151.93 ± 22.49 µm2 (p = 0.5944 (ns); Figure 5D). These results suggest that (1) B2B cells show a constitutively substrate-stiffness-dependent YAP N/C ratio; (2) the traction of B2B cells is higher than that of PC9 cells; and (3) in contrast to B2B cells, PC9 cells show a limited increase in cell area and changes in YAP N/C ratio during the 10 h spreading process.
Correlation of YAP distribution and dynamics to the migration states of B2B cells
YAP N/C ratio and dipole traction of all B2B (n=10) and PC9 (n=5) cells as a function of cell spread area and nucleus spread area were compared. The YAP N/C ratio and dipole traction of PC9 cells did not clearly correlate with their small cell and nucleus spread area ranges (Figure 6). In contrast, the YAP N/C ratio and dipole traction of B2B cells appeared to follow two distinct trends (Figure 6A and Figure 6C), suggesting that there might be two groups of B2B cells that co-exist in this experiment. In the first group, the YAP N/C ratio and dipole traction increase along with the enlargement of the cell spread area and reach their maxima at ~ 1000 µm2 (Figure 6C and Figure 6D, indicated by the yellow dashed line). In the second group, the YAP N/C ratio and dipole traction increase at a slower rate with the enlargement of the cell spread area and maintain nearly constant values when the cell spread area continues to increase (Figure 6C,D, indicated by the green dashed line).
PC9 cancer cells generate tractions in peri-nuclear regions
Single, spreading PC9 cells displace the substrates at the peri-nuclear regions, starting from the 6th h of culture (Figure 7C). To visualize the peri-nuclear displacement caused by cell traction, we overlapped the images of fluorescent beads taken before (red) and after (green) the removal of the cells from the substrates (see the protocol section for details). The beads that do not have any displacement will appear yellow in the overlapped images, i.e., the addition of red and green colors. In contrast, the beads that are displaced from their resting positions due to cell traction will show separated green and red colors.
Notably, in both PC9 (Figure 7C,D) and B2B (Figure 7E) cells, bead displacement was observed in the cytoplasm and within the nucleus, in addition to those at the cell boundary. To highlight the peri-nuclear displacement, the Boussinesq equation from linear-elasticity theory is used to predict the 2D theoretical displacement generated by a hypothetical dipole force at the cell boundary (black dashed line in Figure 7B)24. Comparing this theoretical curve with the real substrate displacement measured along the same axis (white dashed line in Figure 7D), the real displacements within the nucleus were found to be 1.5-8-fold-larger than the theoretical value (Figure 7B), indicating the existence of traction force at the peri-nuclear regions.
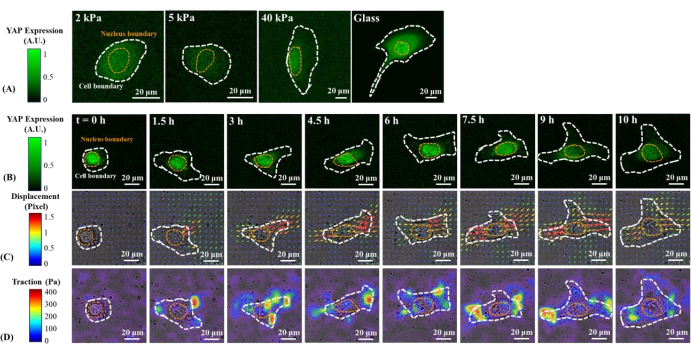
Figure 1: Changes in YAP expression/distribution, substrate displacement field, and traction field of a B2B normal cell on substrates of varying stiffness and during early spreading. (A) The YAP expression of a B2B cell seeded on 2, 5, and 40 kPa PAA gels and a glass coverslip after 60 h from initial cell-substrate attachment. (B) The B2B cell was seeded on a 5 kPa PAA gel and imaged over 10 h after initial cell-substrate attachment. YAP expression is represented by green fluorescence intensity. Note: The YAP intensity inside the nucleus gradually decreases but remains higher than that in the cytoplasm over time. The color bars indicate the levels of YAP expression (green = high expression; black = low expression) in (A) and (B). (C) Substrate deformation (overlapped with the bright-field image) at cell location is represented by the displacement field at each time point. Displacement direction and magnitude are shown by the arrow direction and color, respectively. The displacement becomes larger at the ends of the B2B cell body as the cell spread area increases. The color bar indicates displacement magnitude (crimson = high magnitude; black = low magnitude). (D) Traction field (overlapped with the bright-field image) calculated from the displacement field. The traction is concentrated on the boundary of the B2B cells. The white and yellow dotted outlines delineate the boundaries of the cell and nucleus, respectively. The color bar indicates traction magnitude (crimson = high magnitude; black = low magnitude). Scale bars = 20 µm. Abbreviations: YAP = Yes-associated protein; PAA = polyacrylamide. Please click here to view a larger version of this figure.
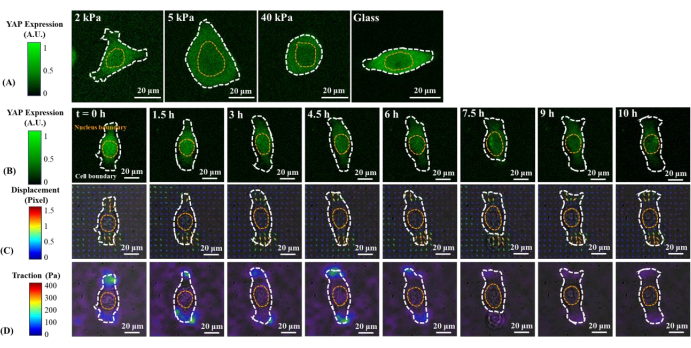
Figure 2: Changes in YAP expression/distribution, substrate displacement field, and traction field of a PC9 cancer cell on substrates of varying stiffness and during early spreading. (A) The YAP expression of a PC9 cell seeded on 2, 5, and 40 kPa PAA gels and glass coverslip after 65 h from initial cell-substrate attachment. (B) The PC9 cell was seeded on a 5 kPa PAA gel and imaged over 10 h after initial cell-substrate attachment. YAP expression is represented by green fluorescence intensity. Note: The YAP intensity plateaus from 1.5 h onwards. The color bars indicate the levels of YAP expression (green = high expression; black = low expression) in (A) and (B). (C) Substrate deformation (overlapped with the bright-field image) at cell location is represented by fluorescent bead displacement field at each time point. Displacement direction and magnitude are shown by the arrow direction and color, respectively. The displacement field caused by PC9 cells is smaller than that caused by the B2B cell. Throughout the 10 h spreading process, the area of PC9 cells remains nearly constant. The color bar indicates displacement magnitude (crimson = high magnitude; black = low magnitude). (D) Traction field (overlapped with the bright-field image) calculated from displacement field. The traction generated by this representative PC9 cell gradually decreases from the 6th h to the 10th h. The white and yellow dotted outlines delineate the boundaries of the cell and nucleus, respectively. The color bar indicates traction magnitude (crimson = high magnitude; black = low magnitude). Scale bars = 20 µm. Abbreviations: YAP = Yes-associated protein; PAA = polyacrylamide. Please click here to view a larger version of this figure.
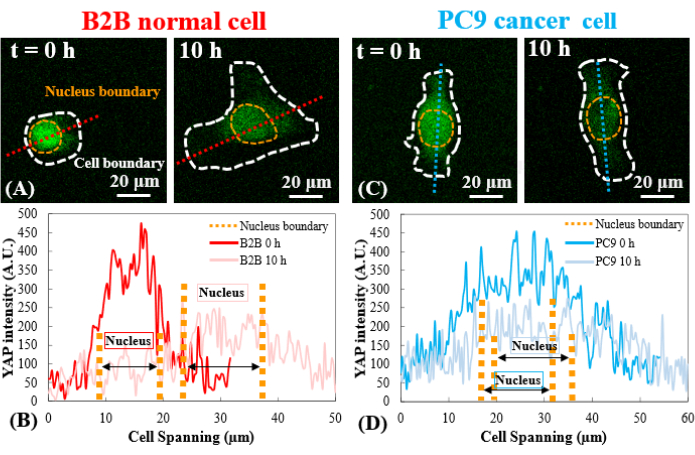
Figure 3: YAP distribution in B2B and PC9 cells at the early spreading stage. (A) YAP intensity of the B2B cell is measured along the assigned red axis at the 0th and the 10th h. (B) At the 0th h, YAP intensity shows dramatic concentration differences between the nucleus and the cytoplasm. At the 10th h, YAP intensity becomes more homogenous across the whole cell body. (C) YAP intensity of the PC9 cell is measured along the assigned blue axis at the 0th and the 10th h. (D) At the 0th h, YAP intensity in the nucleus appears higher than that in the cytoplasm, although the difference is not as remarkable as that in B2B cells. At the 10th h, YAP intensity in the nucleus still appears slightly higher than that in the cytoplasm, with a variation trend similar to that at the 0th h. Scale bars = 20 µm (A, C). Abbreviation: YAP = Yes-associated protein. Please click here to view a larger version of this figure.
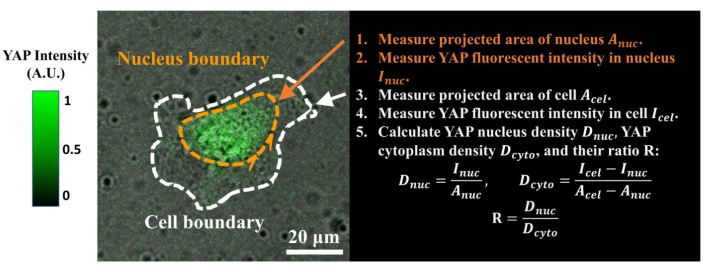
Figure 4: Measuring the YAP N/C ratio. (1) Apply Fiji ImageJ to draw the outline of the nucleus and measure its 2D projected area Anuc. (2) Measure the fluorescence intensity inside the nucleus Inuc. (3) Draw the outline of the cell body and measure its projected area Acel. (4) Measure the fluorescence intensity inside the cell Icel. (5) Calculate the YAP nucleus density Dnuc, YAP cytoplasm density Dcyto, and their ratio R: Dnuc=Inuc/Anuc; Dcyto=(Icel-Inuc)/(Acel-Anuc); R=Dnuc/Dcyto. The color bar indicates the levels of YAP expression (green = high expression; black = low expression). Scale bar = 20 µm. Abbreviations: YAP = Yes-associated protein; N = nucleus; C = cytoplasm. Please click here to view a larger version of this figure.
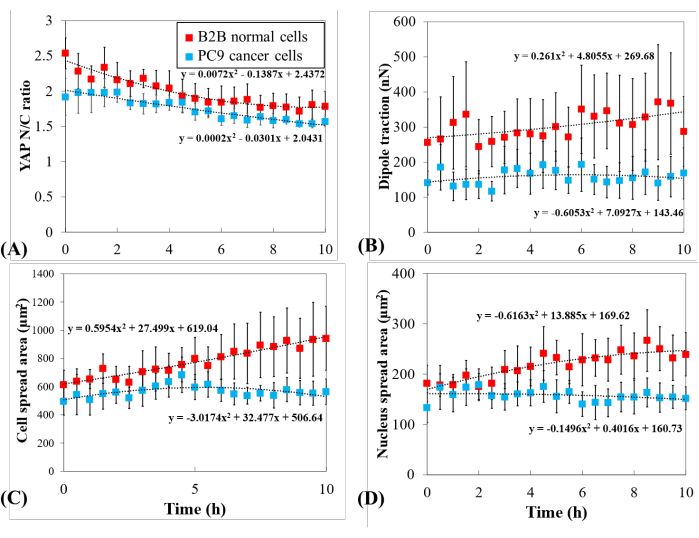
Figure 5: Distinct YAP expression, cell/nucleus morphology, and cellular traction in PC9 cancer and B2B normal cells during cell spreading. (A) YAP N/C ratio change during the first 10 h of single-cell spreading. Average YAP N/C ratio of B2B cells (red column; n = 10) changed from 2.54 ± 0.22 to 1.79 ± 0.21 (n = 10; p = 0.0022**) while the average YAP N/C ratio of PC9 cells (blue column; n = 5) changed from 1.92 ± 0.26 to 1.57 ± 0.07 (p = 0.187 (ns)). (B) The average dipole traction as a function of time. The average dipole traction of B2B cells changed from 256.17 ± 123.69 nN to 287.44 ± 99.79 nN (p = 0.7593 (ns)) and the average dipole traction of PC9 cells changed from 141.19 ± 33.62 nN to 168.52 ± 73.01 nN (p = 0.7137 (ns)). (C) The average cell area as a function of time. The average cell spread area of B2B cells increased from 613.89 ± 102.43 µm2 to 942.51 ± 226.71 µm2 (p = 0.0512 (ns)) and the average cell spread area of PC9 cells changed from 495.78 ± 97.04 µm2 to 563.95 ± 89.92 µm2 (p = 0.5804 (ns)). (D) The average nucleus area as a function of time. The average nucleus spread area of B2B cells increased from 181.55 ± 36.18 µm2 to 239.38 ± 43.12 µm2 (p = 0.1217 (ns)) and the average nucleus spread area of PC9 cells changed from 133.31 ± 30.05 µm2 to 151.93 ± 22.49 µm2 (p = 0.5944 (ns)). Abbreviations: YAP = Yes-associated protein; N = nucleus; C = cytoplasm; ns = not significant. Please click here to view a larger version of this figure.
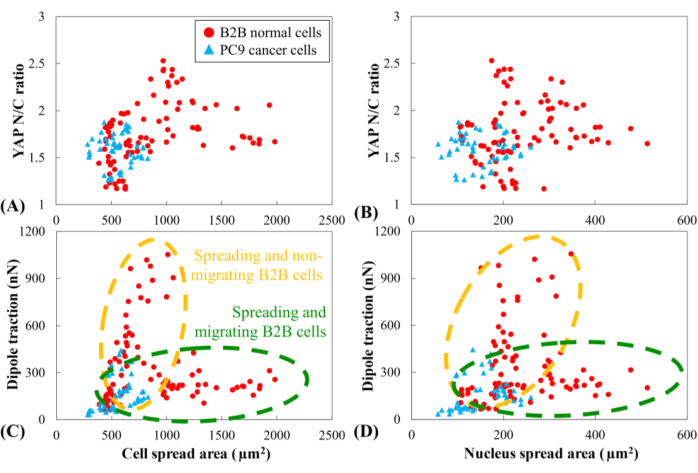
Figure 6: YAP N/C ratio and dipole traction force as a function of spread area of cell and nucleus. YAP N/C ratio and dipole traction of B2B cells (n=10) and PC9 cells (n=5) are calculated from the 6th h to the 10th h after attaching to substrate. (A) YAP N/C ratio as a function of the cell spread area. The YAP N/C ratios of B2B cells vary from 1.16 to 2.53, while the YAP N/C ratios of PC9 cells vary from 1.27 to 1.88. The cell spread area of B2B cells varies from 391.94 µm2 to 1986.40 µm2. The cell spread area of PC9 cells ranges from 284.46 µm2 to 830.12 µm2. (B) YAP N/C ratio as a function of nucleus spread area. The nucleus spread area of B2B cells varies from 107.09 µm2 to 514.28 µm2. The nucleus spread area of PC9 cells ranges from 58.03 µm2 to 259.65 µm2. Dipole traction of B2B cells as a function of the cell spread area (C) and the nucleus spread area (D). Spreading and non-migrating B2B cells show higher traction (from 47.50 nN to 1051.48 nN) with lower cell and nucleus area. While spreading and migrating, B2B cells show lower traction (from 105.80 nN to 310.28 nN) with larger ranges of cell and nucleus area. Abbreviations: YAP = Yes-associated protein; N = nucleus; C = cytoplasm. Please click here to view a larger version of this figure.
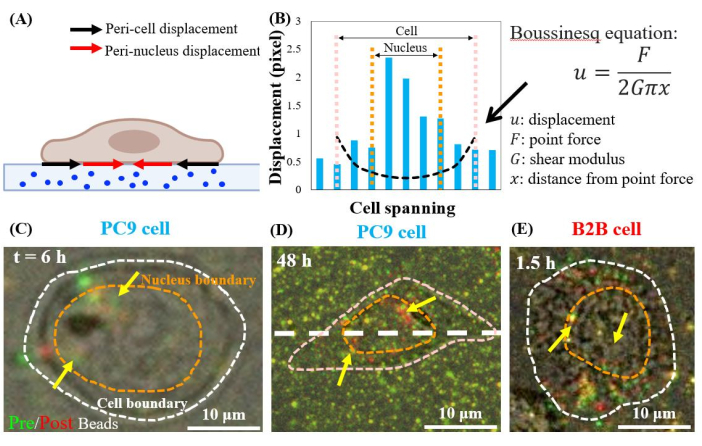
Figure 7: Peri-nuclear displacement in normal B2B and cancer PC9 cells. (A) Schematic side-view diagram of peri-nuclear and peri-cell displacement measured from bead displacement in the substrate. (B) Substrate displacement underneath the PC9 cell is measured along the cell axis (white dashed line in 7D). The theoretical displacement generated by the dipole force at the cell boundary is shown by the Boussinesq equation (black dashed curve). (C) and (D) Overlapped fluorescent bead images with (red) and without (green) cells for the PC9 cells at the 6th h after attaching (Top view). Yellow (exact overlap of red and green colors) beads indicate no displacement. The separated green and red beads (pointed by yellow arrows) represent the peri-nuclear displacement. Yellow arrows indicate these contracted peri-nucleus spots located at the periphery of the nucleus. (E) Peri-nuclear displacement generated by the B2B cell at 1.5th h after cell-substrate attachment. Scale bars = 10 µm (C–E). Please click here to view a larger version of this figure.
Supplemental Figure S1: The genomic sequence map of YAP-mNeonGreen21-10/11. Please click here to download this File.
Supplemental Figure S2: Changes in YAP expression/distribution, substrate displacement field, and traction field of B2B normal cells during early spreading. (A, D, G, J, M) The B2B cell was seeded on a 5 kPa PAA gel and imaged over 10 h after the initial cell-substrate attachment. YAP expression is represented by green fluorescence intensity. Note: The YAP intensity inside the nucleus gradually decreases but remains higher than in the cytoplasm over time. The color bars indicate the levels of YAP expression (green = high expression; black = low expression) in (A, D, G, J, M). (B, E, H, K, N) Substrate deformation (overlapped with the bright-field image) at cell location is represented by the displacement field at each time point. Displacement direction and magnitude are shown by the arrow direction and color, respectively. The displacement becomes larger at the periphery of the B2B cell body as the cell spread area increases. The color bars indicate displacement magnitude (crimson = high magnitude; black = low magnitude) in (B, E, H, K, N). (C, F, I, L, O) Traction field (overlapped with the bright-field image) calculated from the displacement field using Traction Force Microscopy. The traction is concentrated at the periphery of B2B cells. The color bars indicate traction magnitude (crimson = high magnitude; black = low magnitude) in (C, F, I, L, O). Scale bars = 20 µm. Abbreviations: YAP = Yes-associated protein; PAA = polyacrylamide. Please click here to download this File.
Supplemental Figure S3: Changes in YAP expression/distribution, substrate displacement field, and traction field of PC9 cancer cells during early spreading. (A, D, G, J) The PC9 cell was seeded on a 5 kPa PAA gel and imaged over 10 h after the initial cell-substrate attachment. YAP expression is represented by green fluorescence intensity. Note: The YAP intensity inside the nucleus gradually decreases but remains similar to or slightly lower than that in the cytoplasm over time. The color bars indicate the levels of YAP expression (green = high expression; black = low expression) in (A, D, G, J). (B, E, H, K) Substrate deformation (overlapped with the bright-field image) at cell location is represented by the displacement field at each time point. Displacement direction and magnitude are shown by the arrow direction and color, respectively. The displacement becomes larger at the periphery of the PC9 cell body as the cell spread area increases. The color bars indicate displacement magnitude (crimson = high magnitude; black = low magnitude) in (B, E, H, K). (C, F, I, L) Traction field (overlapped with the bright-field image) calculated from the displacement field. The traction is concentrated at the periphery of PC9 cells. The color bars indicate traction magnitude (crimson = high magnitude; black = low magnitude) in (C, F, I, L). Scale bars = 20 µm. Abbreviations: YAP = Yes-associated protein; PAA = polyacrylamide. Please click here to download this File.
Discussion
The imaging process (step 6.3) is critical to ensure that the fluorescence images are of sufficiently good quality to yield valid quantification results. The z-stack images of fluorescent protein or beads should have a z-range that is large enough to include the in-focus images for all the Z-positions that the sample spans. Another critical step is collecting the reference images of fluorescent beads after dissolving the cells (step 6.5). Because the reference images need to be taken at the same positions in step 6.3, no relative displacement should be induced between the Petri dish, environment chamber, and the microscope. The investigators performing the dissolving step must be careful to remove the lid of the Petri dish and ensure that the applied mechanical perturbation is not large enough to alter the location of the dish in the environment chamber.
Solutions are provided below to resolve some errors that might occur during experiments. If no macro is activated after clicking Enter in step 6.4, it is most likely because the left bottom area of the screen is occupied by a non-Element window. In such a case, the left bottom area of the window needs to be cleared so that macros can be activated in Elements. Another common error is that the bright-field images appear black. This issue is caused by an insufficient time interval between the acquisitions of fluorescence and bright-field images. Slight delays in the fluorescence imaging time counting can accumulate over time and cause considerable delays and interfere with the bright-field imaging. One solution is to adjust the duration of one imaging cycle of all the positions to be less than (not equal to) the time interval between the start of consecutive motions. This operation refreshes the time counting and eliminates the cumulative error at the beginning of each imaging cycle.
This all-optical interrogation technology supports (1) a wide range of hardware/software, including but not limited to Nikon, (2) diverse types of validated hydrogel systems, including gelatin, PEG, Matrigel, and collagen I gels, and (3) the programmable customization based on different needs of researchers. However, if any of the bottom-level control functions are not available from a commercial microscope, customization of the functions using AMFIP becomes challenging. Another limitation of this technique is the spatial drift of the sample in both the XY and focus (Z) planes. Although this limitation can be overcome during the post-processing of the images, it is essential to improve the auto-focus function to correct the real-time drift of the samples. This improvement will increase the throughput of the imaging process and reduce the potential error caused by the drift during experiments.
Mechanotransducers, such as YAP, may serve as new therapeutic targets for the development of promising cancer therapies25,26,27. Emerging data suggest that YAP promotes the proliferation and invasion of cancer cells. Mechanics-induced YAP translocation from the cytoplasm to the nucleus activates the transcription of genes related to cell migration, proliferation, invasion, and apoptosis, leading to aberrant cell behaviors28,29,30,31. This work aimed to explore the potential correlation of the YAP N/C ratio and cell mechanics in two typical human lung cancer and normal cell lines. During the 10 h cell spreading period, PC9 cells show similar YAP concentrations in the nucleus and cytoplasm (Figure 3D and Figure 5A). B2B cells show a higher YAP concentration in the nucleus than in the cytoplasm (Figure 3C and Figure 5A). This relationship found during the early spreading stage is different from the majority of published findings that compare YAP concentration in the nucleus between normal and cancer cells. Although not necessarily at the early spreading stage, most published findings show that YAP is more concentrated in the nucleus of cancer cells than in the nucleus of normal cells27,28. Only one study on breast cancer reported an exception32 that shows YAP is more concentrated in the cytoplasm, which agrees with our current observations made in lung cancer PC9 cells. To the best of the authors' knowledge, this work is the first to show a lower YAP N/C ratio in a human lung cancer cell line. The authors hypothesize that the reason for a stable YAP N/C ratio in PC9 cells might be due to the low variation in the cell/nucleus spread area and traction in PC9 cells at the early spreading stage. The dissection of the underpinning molecular mechanisms of low YAP N/C ratio in PC9 and B2B cells is ongoing.
During the first 10 h of spreading, these two cell lines show a distinct relationship between the YAP N/C ratio, cell traction, and spread area (Figure 5). For B2B cells, a higher YAP N/C ratio is correlated with a higher cell and nucleus spread area (Figure 6A,B), which is consistent with the reported data of other normal cells33. Interestingly, although the developmental trend of this relationship is generally found in all B2B cells recorded, two different degrees (high and low) of this relationship are found. B2B cells that spread and migrate simultaneously show lower traction and higher cell and nucleus spread area with a higher YAP N/C ratio (2.05 ± 0.32). For B2B cells that spread and remain at the same location, they show higher traction and lower cell and nucleus spread area with a lower YAP N/C ratio (1.74 ± 0.21). These two degrees of relationships are demonstrated in the bifurcated scattered data groups (Figure 6C,D). As reported in the literature, stationary normal cells, such as embryonic fibroblast NIH 3T3 cells, have higher traction than migratory cells34. The data reported in this paper suggest that the spreading and non-migrating B2B cells applied higher traction than spreading and migrating B2B cells, likely suggesting that high traction is needed for non-migrating cells to stabilize on the substrate.
In addition, these data show that stationary normal B2B cells generate a higher peri-nuclear force, whereas previous research conducted by other researchers reported only higher cell traction generated at the periphery of stationary cells34,35,36,37. The authors think that the difference in the intrinsic tendency of migration in the experiments might cause these contradictory results. In the published experiments, square-shaped micropatterning had been used to confine single cells from spreading and inhibit migration; whether the cells had the tendency to migrate is unknown. As migratory cells often show high traction force at the periphery of the cells38, it is likely that cells with the tendency to migrate will still maintain high periphery traction even though their migration is restricted. In this present study, the stationary cells are not restricted by any micropattern but do not migrate, indicating that the cells tend to maintain their non-migrating state. Another possibility is that the cell shape defined by the micropattern may affect the distribution of focal adhesions and traction forces39. The results in this study were generated without any confining micropatterning and represent the force distribution of stationary cells in their original shape.
To the best of the authors' knowledge, only one publication to date specifically reported the finding of peri-nuclear forces in normal cells (mouse embryonic fibroblasts), potentially caused by the actin cap spanning across the nucleus40. YAP cytoplasm-to-nucleus translocation is correlated with the increase in peri-nuclear force40. A thorough search of the relevant literature did not yield any publicationsthat report a peri-nuclear force or the actin cap in cancer cells. An indirect study on melanoma cancer cells demonstrated that the actin rim (another peri-nuclear actin organization located around but not covering the nucleus) reduces cell migration rates41, indirectly suggesting the existence of a peri-nuclear force. However, no direct experimental data are reported. In this study, the authors found that both PC9 and B2B cells show peri-nuclear displacement and traction. The mechanisms of the generation of the peri-nuclear forces and their effects remain controversial. In normal cells, the actin cap was reported to play a role in regulating nucleus morphology and chromatin organization42, transmitting mechanical signals from focal adhesions into the nucleus through linkers of nucleoskeleton and cytoskeleton (LINC) complex43, and regulating cell migration44. Lamin A/C is related to the formation and disruption of the actin cap40,41,42,43,44. However, the report that claimed that the actin cap generates a peri-nuclear force did not consider the potential role of the actin rim40. In cancer cells, overexpression of Lamin A facilitates the formation of an actin rim and restricts cancer cell migration. Overexpression of Lamin B reduces actin rim formation and promotes migration. The peri-nuclear force might be involved in this process due to the existence of peri-nuclear actin organization and the effect of Lamin A. However, the results of this study did not show any evidence of measured peri-nuclear forces or the behavior of the actin cap. Therefore, the discovery of peri-nuclear forces in PC9 cells in this present study is the first report showing peri-nuclear forces and displacements in lung cancer cells. The authors are currently investigating the molecular mechanisms and functions of peri-nuclear forces in CRISPR/Cas9-engineered PC9 and B2B cells.
Beyond the all-optical mechanobiology interrogation that is demonstrated in this paper, the integrated multi-functional system can be applied to optically probe a myriad of other essential physiological and pathobiological signals in living systems. For example, the authors' laboratory has recently established multiple stably transduced human cancer cell lines that co-express three light-responsive membrane proteins: membrane voltage indicator QuasAr2 (excitation: 640 nm; emission: 660 nm-740 nm), membrane voltage depolarizer CheRiff (excitation: 488 nm), and membrane voltage hyperpolarizer eNpHR3 (excitation: 590 nm). These three functional proteins can be activated by spectrum-orthogonal laser lines in a crosstalk-free manner, enabling all-optical two-way signaling communications (readout and control) of membrane electrophysiology. Using an integrated opto-electronics system and a manual patch-clamp, the authors have validated the all-optical control and readout of the membrane voltage (Vm) in single human cancer cells and multicellular tumor spheroids. The all-optical electrophysiology interrogation opens the possibility for detailed explorations of previously inaccessible bioelectricity in cancer cells, which may help advance tumor biology from a new axis.
Disclosures
There are no conflicts of interest to declare.
Acknowledgements
This project is financially supported by the Cancer Pilot Award from UF Health Cancer Center (X. T. and D. S.) and the Gatorade Award Start-up Package (X. T.). The authors sincerely appreciate the intellectual discussions with and the technical supports from Dr. Jonathan Licht (UFHCC), Dr. Rolf Renne (UFHCC), Dr. Ji-Hyun Lee (Biostatistics, UF), Dr. Hugh Fan (MAE, UF), Dr. Warren Dixon (MAE, UF), Dr. Ghatu Subhash (MAE, UF), Dr. Mark Sheplak (MAE & ECE, UF), Dr. Malisa Sarntinoranont (MAE, UF), Dr. Scott Banks (MAE, UF), Dr. Matthew Traum (MAE, UF), Dr. David Hahn (University of Arizona), Dr. Weihong Wang (Oracle Corporation), Dr. Youhua Tan (Hong Kong Polytechnic University), and the Support Team of Nikon (Drs. Jose Serrano-Velez, Larry Kordon, and Jon Ekman). The authors are deeply grateful for the generous and effective support from all members of Tang's, Siemann's, and Guan's research laboratories and all staff members of the MAE & ECE & Physics & Radiation Oncology Departments, UF.
Materials
| Name | Company | Catalog Number | Comments |
|---|---|---|---|
| (3-Aminopropyl)triethoxysilane | Sigma-aldrich | 440140 | |
| 0.05 % Trypsin | Corning | 25-051-CI | |
| 75 cm2 flask | Corning | 430641U | |
| 8 Benchtop Centrifuge | Thermo | 75007210 | |
| A1R confocal system | Nikon | HD25 | |
| Acetic acid | Sigma-aldrich | 695092 | glacial, ACS reagent, ≥99.7% |
| BEAS-2B (B2B) cells | Sigma-aldrich | 95102433 | human epithelial cells from lung tissue |
| Carboxylate-Modified Microspheres | Invitrogen | F8797 | |
| Culture medium (RPMI-1640) | Gibco | 11875093 | |
| Desktop Computer | Dell | 2018 | with Windows 10 operating system |
| Environmental chamber TIZB | Tokai Hit | TIZB | |
| Fetal bovine serum (FBS) | Gibco | 26140 | |
| Fibronectin Human Protein, Plasma | Gibco | 33016015 | |
| Fiji ImageJ | National Institutes of Health and the Laboratory for Optical and Computational Instrumentation | 1.53k | |
| Glass-bottom petri dish | MatTek | P35G-1.5-14-C | |
| HEPES buffered saline | Sigma-aldrich | 51558 | |
| Hydrazine hydrate solution | Sigma-aldrich | 53847 | |
| IntelliJ IDEA | JetBrains | 2020 | Java development platform |
| Java Development Kit | Oracle | 14.0 | |
| Kimwipe | Kimtech Science | 3066-05 | |
| MATLAB | MathWorks | 2020b | |
| Monochrome Camera | FLIR | BFS-U3-70S7M-C | |
| MycoAlert Mycoplasma Detection Kit | Lonza | LT07-218 | |
| N,N′-Methylenebisacrylamide solution | Sigma-aldrich | M1533 | |
| NIS-Elements software platform | Nikon | 4.50 | software platform |
| Origin | OriginLab | OriginPro 2017 (Learning Edition) | data analysis and graphing software |
| Penicillin-streptomycin | Gibco | 15140122 | |
| PC9 cells | Sigma-aldrich | 90071810 | human adenocarcinoma cells from lung tissue |
| Phosphate buffered saline (PBS) | Gibco | 10010023 | |
| Phusion High-Fidelity DNA Polymerase | New England Biolabs | F-553S | high-fidelity DNA polymerase |
| Scotch tape | Scotch | adhesive tape | |
| Sodium dodecyl sulfate solution | Sigma-aldrich | 05030 | |
| Super glue | Gorilla | cyanoacrylate glue | |
| Ti2-E inverted microscope | Nikon | MEA54000 | |
| TI2-S-SE-E Motorized Stage with Encoder | Nikon | MEC56120 | |
| μManager | version 2.0 gamma | open source microscopy software (https://micro-manager.org/) |
References
- Werley, C., Boccardo, S., Rigamonti, A., Hansson, E., Cohen, A. Multiplexed optical sensors in arrayed islands of cells for multimodal recordings of cellular physiology. Nature Communications. 11 (1), 3881(2020).
- Yang, B., et al. Epi-illumination SPIM for volumetric imaging with high spatial-temporal resolution. Nature Methods. 16 (6), 501-504 (2019).
- Saraswathibhatla, A., Galles, E. E., Notbohm, J. Spatiotemporal force and motion in collective cell migration. Scientific Data. 7 (1), 197(2020).
- Saraswathibhatla, A., Henkes, S., Galles, E. E., Sknepnek, R., Notbohm, J. Coordinated tractions control the size of a collectively moving pack in a cell monolayer. Extreme Mechanics Letters. 48, 101438(2021).
- Wang, W., Kim, C. K., Ting, A. Y. Molecular tools for imaging and recording neuronal activity. Nature Chemical Biology. 15 (2), 101-110 (2019).
- Eliceiri, K. W., et al. Biological imaging software tools. Nature Methods. 9 (7), 697-710 (2012).
- Carpenter, A. E., Kamentsky, L., Eliceiri, K. W. A call for bioimaging software usability. Nature Methods. 9 (7), 666-670 (2012).
- Skylaki, S., Hilsenbeck, O., Schroeder, T. Challenges in long-term imaging and quantification of single-cell dynamics. Nature Biotechnology. 34 (11), 1137-1144 (2016).
- Lin, M. Z., Schnitzer, M. J. Genetically encoded indicators of neuronal activity. Nature Neuroscience. 19 (9), 1142-1153 (2016).
- Luo, Q., et al. Automatic multi-functional integration program (AMFIP) towards all-optical mechanobiology interrogation. bioRxiv. , (2021).
- Edelstein, A., Amodaj, N., Hoover, K., Vale, R., Stuurman, N. Computer control of microscopes using manager. Current Protocols in Molecular Biology. 92 (1), 14-20 (2010).
- Tulpule, A., et al. Kinase-mediated RAS signaling via membraneless cytoplasmic protein granules. Cell. 184 (10), 2649-2664 (2021).
- Tang, X., Tofangchi, A., Anand, S. V., Saif, T. A. A novel cell traction force microscopy to study multi-cellular system. PLOS Computational Biology. 10 (6), 1003631(2014).
- Tang, X., et al. Mechanical force affects expression of an in vitro metastasis-like phenotype in HCT-8 cells. Biophysical Journal. 99 (8), 2460-2469 (2010).
- Guimarães, C. F., Gasperini, L., Marques, A. P., Reis, R. L. The stiffness of living tissues and its implications for tissue engineering. Nature Reviews Materials. 5, 351-370 (2020).
- Phelps, E. A., et al. Maleimide cross-linked bioactive PEG hydrogel exhibits improved reaction kinetics and cross-linking for cell encapsulation and in situ delivery. Advanced Materials. 24 (1), 64-70 (2012).
- Bajaj, P., Tang, X., Saif, T. A., Bashir, R. Stiffness of the substrate influences the phenotype of embryonic chicken cardiac myocytes. Journal of Biomedical Materials Research. Part A. 95 (4), 1261-1269 (2010).
- Temples, M. N., Adjei, I. M., Nimocks, P. M., Djeu, J., Sharma, B. Engineered three-dimensional tumor models to study natural killer cell suppression. ACS Biomaterials Science & Engineering. 6 (7), 4179-4199 (2020).
- Feng, S., et al. Improved split fluorescent proteins for endogenous protein labeling. Nature Communications. 8, 370(2017).
- Guan, J., Liu, H., Shi, X., Feng, S., Huang, B. Tracking multiple genomic elements using correlative CRISPR imaging and sequential DNA FISH. Biophysical Journal. 112 (6), 1077-1084 (2017).
- Micro-Manager. , Available from: https://micro-manager.org/wiki/NikonTi2 (2021).
- Schindelin, J., et al. Fiji: An open-source platform for biological-image analysis. Nature Methods. 9 (7), 676-682 (2012).
- Martiel, J. L., et al. Measurement of cell traction forces with ImageJ. Methods in Cell Biology. 125, 269-287 (2015).
- Okumurai, I. A. On the generalization of Cerruti's problem in an elastic half-space. Doboku Gakkai Ronbunshu. 1995, 1-10 (1995).
- Piccolo, S., Dupont, S., Cordenonsi, M. The biology of YAP/TAZ: hippo signaling and beyond. Physiological Reviews. 94 (4), 1287-1312 (2014).
- Hong, W. W., Guan, K. L. The YAP and TAZ transcription co-activators: Key downstream effectors of the mammalian Hippo pathway. Seminars in Cell and Developmental Biology. 23 (7), 785-793 (2012).
- Zanconato, F., Cordenonsi, M., Piccolo, S. YAP/TAZ at the roots of cancer. Cancer Cell. 29 (6), 783-803 (2016).
- Wang, Y., et al. Overexpression of yes-associated protein contributes to progression and poor prognosis of non-small-cell lung cancer. Cancer Science. 101 (5), 1279-1285 (2010).
- Li, H., et al. Inhibition of YAP suppresses CML cell proliferation and enhances efficacy of imatinib in vitro and in vivo. Journal of Experimental & Clinical Cancer Research. 35 (1), 134(2016).
- Tang, X., et al. A mechanically-induced colon cancer cell population shows increased metastatic potential. Molecular Cancer. 13, 131(2014).
- Panciera, T., Azzolin, L., Cordenonsi, M., Piccolo, S. Mechanobiology of YAP and TAZ in physiology and disease. Nature Reviews Molecular Cell Biology. 18 (12), 758-770 (2017).
- Yuan, M., et al. Yes-associated protein (YAP) functions as a tumor suppressor in breast. Cell Death and Differentiation. 15 (11), 1752-1759 (2008).
- Koushki, N., et al. Lamin A redistribution mediated by nuclear deformation determines dynamic localization of YAP. bioRxiv. , (2020).
- Chang, S. S., Rape, A. D., Wong, S. A., Guo, W. H., Wang, Y. L. Migration regulates cellular mechanical states. Molecular Biology of the Cell. 30 (26), 3104-3111 (2019).
- Lee, J., Abdeen, A. A., Tang, X., Saif, T. A., Kilian, K. A. Geometric guidance of integrin mediated traction stress during stem cell differentiation. Biomaterials. 69, 174-183 (2015).
- Lee, J., Abdeen, A., Tang, X., Saif, T. A., Kilian, K. A. Matrix directed adipogenesis and neurogenesis of mesenchymal stem cells derived from adipose tissue and bone marrow. Acta Biomaterialia. 42, 46-55 (2016).
- Tang, X., Bajaj, P., Bashir, R., Saif, T. A. How far cardiac cells can see each other mechanically. Soft Matter. 7 (13), 6151-6158 (2011).
- Dembo, M., Wang, Y. L. Stresses at the cell-to-substrate interface during locomotion of fibroblasts. Biophysical Journal. 76 (4), 2307-2316 (1999).
- Rape, A., Guo, W. H., Wang, Y. L. The regulation of traction force in relation to cell shape and focal adhesions. Biomaterials. 32 (8), 2043-2051 (2011).
- Shiu, J. Y., Aires, L., Lin, Z., Vogel, V. Nanopillar force measurements reveal actin-cap-mediated YAP mechanotransduction. Nature Cell Biology. 20 (3), 262-271 (2018).
- Fracchia, A., Asraf, T., Salmon-Divon, M., Gerlitz, G. Increased lamin B1 levels promote cell migration by altering perinuclear actin organization. Cells. 9 (10), 2161(2020).
- Ramdas, N. M., Shivashankar, G. V. Cytoskeletal control of nuclear morphology and chromatin o1rganization. Journal of Molecular Biology. 427 (3), 695-706 (2015).
- Khatau, S. B., et al. A perinuclear actin cap regulates nuclear shape. Proceedings of the National Academy of Sciences of the United States of America. 106 (45), 19017-19022 (2009).
- Kim, D. H., Cho, S., Wirtz, D. Tight coupling between nucleus and cell migration through the perinuclear actin cap. Journal of Cell Science. 127 (11), 2528-2541 (2014).
Reprints and Permissions
Request permission to reuse the text or figures of this JoVE article
Request Permission