The aqueous humor is a high-yield liquid biopsy for retinoblastoma, intraocular cancer that cannot be biopsied in vivo due to the risk of extraocular spread. Herein, a method for safely extracting aqueous humor via clear corneal paracentesis and steps for genomic analysis to identify prognostic biomarkers are presented.
Method Article
Aqueous Humor as a Liquid Biopsy for Retinoblastoma: Clear Corneal Paracentesis and Genomic Analysis
Mary E. Kim1,2 , Liya Xu1,2,3,11 , Rishvanth K. Prabakar4 , Lishuang Shen5 , Chen-Ching Peng1,3 , Peter Kuhn3,6,7,8 , Xiaowu Gai5,9 , James Hicks3,6,10 , Jesse L. Berry1,2,6,11
jberry@chla.usc.edu
1The Vision Center, Children’s Hospital Los Angeles, 2USC Roski Eye Institute, Keck School of Medicine of the University of Southern California, 3Department of Biological Sciences, Dornsife College of Letters, Arts, and Sciences, University of Southern California, 4Department of Molecular and Computational Biology, University of Southern California, 5Center for Personalized Medicine, Department of Pathology and Laboratory Medicine, Children’s Hospital Los Angeles, 6Norris Comprehensive Cancer Center, Keck School of Medicine, University of Southern California, 7Department of Aerospace and Mechanical Engineering, Viterbi School of Engineering, University of Southern California, 8Department of Biomedical Engineering, Viterbi School of Engineering, University of Southern California, 9Department of Pathology and Laboratory Medicine, Keck School of Medicine of USC, 10Department of Biochemistry and Molecular Medicine, Keck School of Medicine, University of Southern California, 11The Saban Research Institute, Children’s Hospital Los Angeles
Corresponding Authors: Jesse L. Berry <jberry@chla.usc.edu>
Opens in a new tab
In This Article
Summary
Loading...
$$\rightleftharpoonup{xx}$$
$$\longleftharp{xx}$$,
$$\longrightharp{xx}$$,
Abstract
Loading...
$$\rightleftharpoonup{xx}$$
$$\longleftharp{xx}$$,
$$\longrightharp{xx}$$,
There is significant potential clinical utility for the application of a liquid biopsy platform for retinoblastoma, given that direct tumor biopsy is prohibited in these patients. The aqueous humor (AH) forms in a separate compartment from the tumor but is enclosed within the same ocular space. Thus, it is an enriched source of eye-specific tumoral genomic information that can be used as a liquid biopsy or surrogate to tumor biopsy for this disease. This manuscript details a methodology for safely extracting the AH from retinoblastoma eyes via clear corneal paracentesis. Additionally, the steps for genomic analysis, including cell-free DNA isolation and purification, next-generation sequencing, somatic copy number alteration (SCNA) analysis, RB1 single nucleotide variant (SNV) mutation identification, and tumor fraction estimation are presented. The pre-analytical, analytical, and early clinical validity of the AH liquid biopsy platform have been evaluated; however, it is not without limitations. These are largely a consequence of the quantity of cell-free DNA that is required for certain steps of the assay. Compared to other blood-based liquid biopsy platforms currently under investigation for retinoblastoma, an AH-based platform is limited by the volume of biofluid (and thus the quantity of DNA) that can be extracted from the eye; the benefit is that AH is eye-specific. The platform discussed here is unique in that it detects circulating tumor DNA in the AH via two mechanisms (SCNAs and RB1 SNVs), yielding a higher sensitivity for identifying tumoral genomic information. The AH liquid biopsy has the potential for direct clinical application to precision oncology for retinoblastoma patients, with particular importance for patients with bilateral disease as the AH is specific to the tumors in each eye. There is ongoing research with applications of this platform to patients with other ocular tumors as well.
Introduction
Loading...
$$\rightleftharpoonup{xx}$$
$$\longleftharp{xx}$$,
$$\longrightharp{xx}$$,
Retinoblastoma (RB) is a rare and unique cancer. While it is the most common primary intraocular malignancy that forms in the developing retina of infants and toddlers, there are only about 7000 cases in the world annually, and approximately 250—300 of these are in the United States. Although patient survival approaches 98% in developed countries1, ocular survival for advanced eyes, which are clinically classified as International Intraocular RB Classification (IIRC)2 Group D/E or AJCC cT2b/3, is far lower. Many of these advanced eyes are enucleated either primarily (as first treatment) or secondarily (after failed attempts at globe salvaging therapy). In the current clinical practice of ocular oncology, there are no tumor-derived, eye-specific molecular biomarkers that are currently used clinically to assist in the diagnosis, prognostication for eye survival, or treatment monitoring of patients with RB. This is due, in large part, to the fact that tumor tissue is only available for molecular and genetic analyses from enucleated eyes because direct tumor biopsy in RB is prohibited due to concern for extraocular tumor spread3,4,5,6,7,8,9. Because of this prohibition, previous retrospective studies on RB tumor genetics and their clinical correlations were restricted to the analysis of tumor tissue obtained from enucleated eyes only10,11,12,13. Therefore, there has been a lack of objective tumor-derived molecular data available at diagnosis and throughout eye salvaging therapy. This has limited not only the understanding of in vivo tumor biology and the ways in which these tumors change on a molecular level throughout therapy but also the ability to develop personalized, eye-specific, genomic-based treatment plans for these young cancer patients.
Aside from the prohibition of biopsy, another unique aspect of this cancer is that most tumors are initiated by bi-allelic loss of the RB1 tumor suppressor gene, which modulates the cell cycle. The developing retina is exquisitely sensitive to this loss. In 60% of patients, this bi-allelic inactivation of the RB1 gene occurs in the retina only as somatic loss and results in unilateral disease. However, in 40% of patients, the initial RB1 mutation happens in the germline, followed by a second 'hit' in the retina. In these children, there are often multiple tumors affecting both eyes. Finally, a very small subset (<2%) of tumors seem to be driven by MYCN amplification without mutations in the RB1 gene. While MYCN-driven tumors almost universally fail treatment and require enucleation, there is currently no clear, objective way to identify this aggressive tumor subtype at diagnosis14,15. Furthermore, monitoring of intraocular RB tumor activity relies almost exclusively upon imaging and clinical observations of each eye by the treating ocular oncologist. There is no gold-standard objective, quantitative means of diagnosis, prognosis, or way to monitor eye-specific tumor dynamics throughout treatment. Because of these unique limitations for RB, the prospect of a liquid biopsy platform for this cancer is enticing. Liquid biopsies utilize bodily fluids to isolate and sequence cell-free DNA to determine if it is tumor-derived, known as circulating tumor DNA (ctDNA). While serum is researched for other cancers, RB ctDNA that is found in the serum is not eye-specific, which has clear limitations for the 40% of patients who suffer from bilateral disease. Additionally, it has only been described in the setting of advanced intraocular or metastatic disease, generally with a low tumor fraction (<5%)16.
In an effort to address these real clinical problems facing patients and families, in 2017, we demonstrated that aqueous humor (AH, the clear fluid in front of the eye), is a high-yield source of ctDNA that can be used as a liquid biopsy—or more so as a surrogate to tumor biopsy—to evaluate RB17,18,19. With over 200 samples to date, ctDNA in >95% of samples wasidentified, including less advanced IIRC Groups A, B, and C eyes, as well as genomic differences between eyes in bilateral patients18,19. This DNA can be safely and effectively isolated for detection of relevant molecular biomarkers in eyes that are actively undergoing treatment or treatment-naïve18,20,21. The AH liquid biopsy platform can also be used to identify the diagnostic RB1 pathogenic variants or primary MYCN amplification that initiates tumorigenesis21,22. Importantly, we have identified a prognostic molecular signature—the presence of chromosome 6p gain with an amplitude of ≥1.5 to the median or focal MYCN amplification—which is associated with a 16.5 increased likelihood of loss of intraocular tumor control requiring removal of the eye18,20,21. Finally, it has been demonstrated that changes in ctDNA tumor fraction (TFx) in the AH correlate with the therapeutic response as higher levels are correlated with active disease, and decreasing levels are associated with positive treatment response23. Given these applications and their potential clinical utility, we wanted to delineate the methodology for AH biopsy and evaluation. This includes clear corneal paracentesis for sample acquisition and the protocol for genomic analysis, specifically cfDNA library construction and sequencing, SCNA amplitude determination, RB1 pathogenic variant identification, and TFx calculation.
Protocol
Loading...
$$\rightleftharpoonup{xx}$$
$$\longleftharp{xx}$$,
$$\longrightharp{xx}$$,
This research is conducted under Children's Hospital Los Angeles and University of Southern California Institutional Review Board approval, and it adheres to the tenets of the Declaration of Helsinki. Written informed consent is always obtained from the legal guardians of all participants.
A schematic for the AH liquid biopsy workflow can be seen in Figure 1.
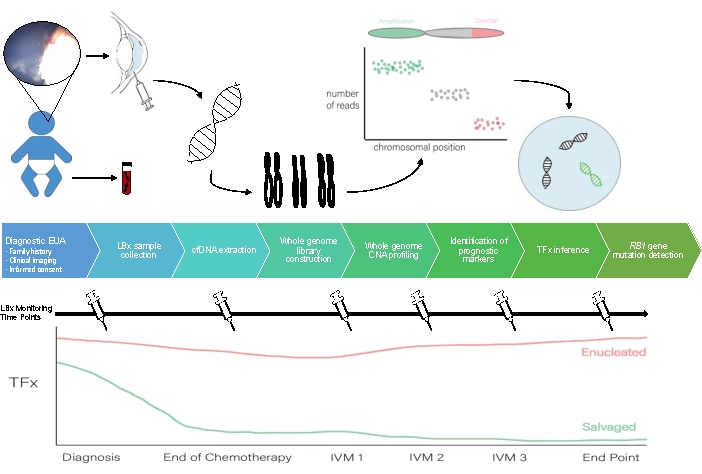
Figure 1: Workflow for the AH liquid biopsy to accompany the protocol described herein. EUA, exam under anesthesia; LBX, liquid biopsy; cfDNA, cell-free DNA; CNA, copy number alteration; TFx, tumor fraction; IVM, intravitreal melphalan. Please click here to view a larger version of this figure.
1. Surgical procedure:
NOTE: This procedure is performed during routine examination under anesthesia (EUA) for clinical evaluation of patients with RB. The paracentesis procedure to extract AH should only be done by a trained ophthalmic surgeon who has completed standard training in ocular surgery.
- Patient selection and inclusion criteria are as follows.
- Ensure that the chamber is formed and clear without shallowing from the tumor, synechiae, or a cataractous lens.
NOTE: In some advanced eyes, the chamber is too shallow at diagnosis to safely extract the AH. In these cases, it is recommended to wait until after the first cycle of systemic or intra-arterial chemotherapy. Once the main tumor shrinks, the chamber generally deepens, which allows for a safe approach. - Ensure that there is a clear view of all structures and that the pressure is <22 mm Hg so that there is no rapid shallowing of the chamber due to pressure dynamics. This is true for all time points, but particularly critical when AH is taken at diagnosis.
- Ensure that there is no direct involvement of the anterior segment by the tumor, which is evaluated by direct visualization and ultrasound biomicroscopy. This inclusion criterion is usually identified during EUA.
- Ensure that the chamber is formed and clear without shallowing from the tumor, synechiae, or a cataractous lens.
- Once the patient has been deemed appropriate and consented, bring the patient to the operating room. Allow the attending anesthesiologist to initiate anesthesia as is routine for EUA for the clinical care of patients with RB.
- Once the patient is intubated and sedated, and all clinical examination, imaging, and any local therapeutic needs (e.g., laser or cryotherapy) pertaining to the EUA are complete, extract the AH for the liquid biopsy platform. Prepare and drape the eye in the usual sterile fashion. This can be completed by the circulating nurse or the operating surgeon.
- Prior to the EUA, place the dilating drops routinely used at the institution for an EUA in the surgical eye.
NOTE: Here, combination eye drops consisting of 2.5% phenylephrine, 1% cyclopentolate, and 1% tropicamide are used. However, whatever standard drops are used for dilation for EUA are sufficient; the eye does not have to be dilated simply to extract the AH. - Place 5% betadine drop in the surgical eye and apply it using a sponge starting from the center and moving peripherally. Include superior and inferior eyelid margins in the surgical preparation. Complete the surgical preparation using betadine three times, and then wait at least two minutes before proceeding.
- Place a sterile blue towel over the patient's head and tuck it under the head to keep it from falling. Dry the eyelashes and periorbital area with a sterile blue towel or gauze.
- Let the operating surgeon scrub in, don a gown, and don gloves.
- Cover the patient with sterile blue drapes, leaving the surgical eye exposed. Place a sterile lid speculum for optimal visualization of the sterile field.
NOTE: Additional topical anesthesia is not required at our institution as the child is under general anesthesia for the EUA. - Perform time out according to institutional protocol. Here, an initial time out is done for the EUA and a second time out to verify the eye(s) prior to the procedure.
- Prior to the EUA, place the dilating drops routinely used at the institution for an EUA in the surgical eye.
- Using an operating microscope, perform a clear corneal paracentesis with the extraction of 0.1 mL of AH with a 32 G needle on a 1 cc syringe.
- Prior to starting the procedure, wet the eye with a sterile balanced salt solution (each mL containing sodium chloride 0.64%, potassium chloride 0.075%, calcium chloride dihydrate 0.048%, magnesium chloride hexahydrate 0.03%, sodium acetate trihydrate 0.39%, sodium citrate dihydrate 0.17%, sodium hydroxide and/or hydrochloric acid (to adjust pH), and water for injection) to maintain corneal lubrication; this is a standard commercial preparation.
- Ensure the 32 G needle is luer-locked to the 1 cc syringe and that there is no pressure in the syringe (by moving the plunger of the syringe in and out several times before use).
- Afterward, pass the needle through the clear cornea at the limbus (perpendicular to it, as is standard for paracentesis) and stay within the anterior chamber over the peripheral dilated iris.
- Keep the needle tip bevel up anterior to the iris under direct visualization via the microscope during extraction. If preferred, stabilize the eye with 0.12 forceps as the needle passes through the cornea.
NOTE: There should never be contact between the needle tip and any ocular structure; it should remain over the peripheral iris in the mid anterior chamber. - Extract 0.1 mL of AH. Manipulate the syringe plunger with the surgeon's non-dominant hand (but with practice) or by a trained assistant without moving the needle. Do not lose direct visualization of the needle tip. Prioritize the anatomy of the eye and take less AH if necessary to ensure that the chamber remains formed.
- After extraction, gently remove the needle from the anterior chamber. Ensure that the chamber remains formed but slightly shallow; the pressure will be soft but physiologic. Once the needle is removed from the eye, bathe the eye copiously with sterile water; sterile water is preferred over a balaced salt solution at this step as a safety measure because water lyses cells.
- Examine the needle site for any leakage. If there is leakage, use a cotton tip applicator to apply gentle pressure at the injection site for 30 seconds before checking again for leakage. Repeat the process if needed.
NOTE: Use of more invasive methods to stop any leakage were never needed with this approach. Sometimes this procedure is followed by intravitreal injection of chemotherapy; for this methods paper, the protocol focuses on AH extraction as a primary procedure.
- Examine the needle site for any leakage. If there is leakage, use a cotton tip applicator to apply gentle pressure at the injection site for 30 seconds before checking again for leakage. Repeat the process if needed.
- Once there is no leakage, the procedure is considered complete. Remove the sterile drapes from the patient and clean the betadine from the face.
- Carefully remove the needle tip from the syringe, use a sterile cap to close the sample via luer lock to not lose any sample, and label the syringe appropriately.
NOTE: This should be done by the clinical research coordinator or the surgeon while the child is being extubated.- After specimen extraction, store the sample in a capped syringe at -80 °C; samples can be placed on dry ice to transport to an appropriate freezer from the operating room.
- Place a single drop of antibiotic eyedrops per surgeon preference onto the surface of the surgical eye before the patient is sent to recovery. Here, combination steroid-antibiotic eyedrops are used, and the eye is not patched.
- Once the procedure is complete, the attending anesthesiologist ensures proper extubation. Bring the patient to recovery.
- Discharge the patient to home following institutional postoperative protocol.
- Inform the patient that the eye need not be covered with any bandage or a protective covering.
- Inform the patient not to completely immerse their head in either a bath or swimming pool for 24 hours, and the parents not to rub the patient's (child) eye; there are no other limitations on patient activity.
- Inform the patient that he/she/they are unlikely to have pain from the paracentesis but could have pain from associated procedures during the EUA. The patient may take acetaminophen or ibuprofen in case of any discomfort, as suggested by the surgeon.
2. cfDNA isolation and purification
- Perform DNA isolation and processing within 72 hours of AH extraction.
- Thaw AH at room temperature. Check the sample frequently and move toward extraction immediately after thawing is complete.
- Extract cfDNA from AH and elute it into 50 µL of AVE solution (included in kit) using the cfDNA isolation and purification kit (see Table of Materials for details) per the manufacturer's instruction manual.
3. Next generation sequencing (NGS) and quality control (QC)
- Construct the DNA libraries for sequencing using the DNA library sequencing kit (see Table of Materials) per the manufacturer's instruction manual. Amplify the library DNA with 14 cycles of polymerase chain reaction (PCR) as detailed in the DNA library sequencing kit manual.
NOTE: Final libraries can be stored at -20 °C up to 1 month before final sequencing for genomic analysis. - Sequence the DNA libraries on the NGS platform (see Table of Materials) per the manufacturer's protocol following single-end 50 cycles or paired-end 150 cycles protocol.
NOTE: Other NGS platforms will work in principle (although not tried here), with suitable adaptors for the sequencing flow cell. - Perform QC for any AH samples that were taken at the time of diagnosis or primary enucleation.
NOTE: QC cannot be performed for samples taken at other time points as the DNA mass will be too low and out of the detection range for the steps described below.- Use 1 µL of the extracted DNA each for DNA quantification assay and size profiling assay (see Table of Materials) per the manufacturer's protocols.
NOTE: Peak should be around 300 bp. If it is shorter than 150 bp, the sample has been compromised. See Supplementary file 1A for an example of a sample that should pass QC and Supplementary file 1B for an example of one that should not.
- Use 1 µL of the extracted DNA each for DNA quantification assay and size profiling assay (see Table of Materials) per the manufacturer's protocols.
4. Somatic copy number alteration (SCNA) data analysis
NOTE: A demonstration of the AH SCNA analysis workflow is provided in Supplementary Video 1.
- Map the reads obtained from NGS (section 3) to the human genome (hg19, Genome Reference Consortium GRCh37, University of California Santa Cruz Genome Browser database)24,25 with an aligner.
- Remove the PCR duplicates (samtools rmdup26).
- Normalize for guanine-cytosine content by computing the percentage of guanine and cytosine bases in each bin from the reference genome. A sample program is described in Baslan et al.27.
- To obtain DNA segment copy numbers, divide the genome into 5000 variable-length bins and then calculate the relative number of reads contained in each bin.
- Use reference-free log2 ratios to determine copy-number estimates. Take the median window count of normal autosomal chromosomes.
- Perform segmentation using circular binary segmentation with DNAcopy (Bioconductor28).
- Define SCNAs as positive at 20% deflection from baseline (log2 ratio = 0), meaning losses at log2 ratios ≤ 0.2 (ratio of 0.87 or lower defines a deletion) and gains at log2 ratios ≥ 0.2 (ratio of 1.15 or higher defines an amplification).
NOTE: These thresholds are consistent with previously established liquid biopsy analyses27,29.
5. RB1 mutational analysis of AH samples
- Further, amplify the whole genome libraries to 500 ng each for capture-based targeted NGS for mutation detection per manufacturer's protocol.
- Perform NGS platform paired-end 150 bp or 50 bp single-end sequencing on the captured libraries to >100x per manufacturer's protocol.
- Process the NGS data. In this study, an in-house pipeline based on the bcbio pipeline at the CHLA Center for Personalized Medicine is utilized30.
- Trim the raw fastq data off adaptors and low-quality bases with Atropos31 and align to human GRCh37 reference with BWA-MEM and NovoAlign (v3)32,33.
- Mark duplicates with FreeBayes34 and then determine the germline variant.
NOTE: In FreeBayes variant calling tools, each position of the sample genome is compared to the reference genome and the allele counts are mathematically modeled to obtain the genotype likelihood measures34. - Conduct variant annotation with Ensembl Variant Effect Predictor (v96)35 following steps 5.3.4-5.3.5.
- Use VarDict to determine somatic variants in the AH or tumor without the paired normal blood sample (i.e., blinded to germline variant)36.
- Call loss of heterozygosity if a region's continuous variants have ≤3% alternative alleles.
NOTE: Commercial genomic analysis software can also be used with the parameters indicated above.
6. Determination of cfDNA TFx
- Estimate TFx for each sequenced AH cfDNA sample using ichorCNA software (CNA-based TFx estimation software)37.
NOTE: This is the standard software used in blood-based liquid biopsies for determining cfDNA TFx38. The use of the software on AH has been previously published21,23. - Individually review the genomic profiles and corresponding TFx solutions to verify that the TFx estimate for each sample is appropriate39.
Results
Loading...
$$\rightleftharpoonup{xx}$$
$$\longleftharp{xx}$$,
$$\longrightharp{xx}$$,
Comprehensive results from two eyes (cases 33 and 47) are presented below. The case numbers remain consistent with prior publications for comparison purposes18,20,21. The treating physicians were blinded to the results of the AH liquid biopsy during therapy. All treatment decisions were non-randomized and made per routine standard of care that has been previously published40,41. Clinical outcomes data remained separate from genomic data until final analysis. Raw data from the results presented are available on request from the corresponding author. Due to NIH funding, the data is governed by NIH genomic data sharing policy and will be available to other researchers via a controlled-access NIH designated data repository (dbGAP) in the future; it is also available via request from the corresponding author.
Cases 33 and 47 are both IIRC Group D2 eyes that had very similar clinical presentations. Thus, they were treated with globe salvaging therapy at the parents' decision and treating ocular and medical oncologists—specifically with systemic chemotherapy for case 47 and intra-arterial chemotherapy for case 33. Based on currently accepted clinical prognostication that relies on the IIRC group of the eye2, the predicted success of globe salvage for the eyes of these two patients would have been the same: 65%-70% for Group D is an average, although this varies by treatment center41. However, based on the Group D data collected thus far from tumor-directed molecular profiling at this center, the predicted success of globe salvage would be 72% for case 47 (without 6p gain identified in the AH) and 9% for case 33 (with 6p gain identified)18,20,21. This is demonstrated below.
Case 47 is an example of an eye with successful SCNA and SNV detection using the AH liquid biopsy platform at the time of diagnosis, along with TFx trends corresponding to treatment response longitudinally. The patient is a female who presented at 15 months of age with a 14 mm x 9 mm IIRC Group D, stage cT2b RB with sphere vitreous seeding. She was negative for RB1 germline mutation as determined by routine clinical serum leukocyte testing. From the AH, RB SCNAs 1q gain and 6p gain were identified in the AH at diagnosis, in addition to two other non-highly recurrent RB SCNAs 7p loss and 13q gain (Figure 2). Of note, the amplitude of 6p gain was 1.2, and only amplitudes of ≥ 1.5 ratio to the median have been shown to portend a poor prognosis. Given that there was no focal MYCN amplification and 6p gain was below the 1.5 threshold, the prognosis for salvage with treatment based on molecular features was high. The same AH sample taken at diagnosis was also evaluated for detection of RB1 pathogenic variants, which revealed the SNV c.958C>T, p.Arg320* within the RB1 gene with a variant allele frequency of 87.01% (95% confidence interval, 79.7%–94.6%). This patient was treated with six cycles of Carboplatin, Etoposide, and Vincristine (CEV) with regression of disease but demonstrated persistent sphere- and dust-like seeding that required three sequential intravitreal melphalan (IVM) injections. During IVM treatment, AH samples A-C (each separated by two weeks) demonstrated a complete normalization of the genomic profile, decrease in TFx, and decrease in DNA concentration—all concurrent with clinical regression of disease (Figure 3). Following diagnosis, TFx values remained below the detection limit of 5% for the remainder of treatment. At 19 months of follow-up, the eye remained stable with no tumor recurrence or extraocular spread of disease.
This is in contrast to case 33. This 22-month-old male had an overall similar clinical presentation with an 11 mm x 18 mm retinal mass and dust-type vitreous seeding, consistent with unilateral IIRC Group D, stage cT2b. He was also negative for RB1 germline mutation as determined by routine clinical serum leukocyte testing. AH taken at diagnosis demonstrated RB SCNAs 1q gain, 6p gain (in this case with an amplitude of 1.5 ratio to the median), and 16q loss along with focal 6q loss (Figure 4A). Based on the prognostic molecular profile, this eye had a 16.5 increased odds of enucleation based on the presence of 6p ≥ 1.5 amplitude. No RB1 SNV was identified in this sample, despite full coverage of the full length of the RB1 gene. One reason an RB1 SNV may not be identified is in primary MYCN driven tumors, where a concurrent RB1 mutation is not always expected14,15,42,43,44,45. However, case 33 demonstrated no evidence of MYCN amplification in any of its AH samples or its enucleated tumor tissue (Figure 5). A more likely explanation for a negative RB1 SNV result is that initial tumorigenesis was driven by epigenetic dysregulation (e.g., methylation of the promotor)46,47, a known phenomenon in RB which would not be identified by the assay described herein.
Initial treatment for this patient was four total cycles of intraarterial chemotherapy with melphalan followed by four IVM injections due to persistent vitreous seeding. Three AH samples (each separated by four weeks) were obtained during IVM therapy and demonstrated the same three SCNAs that were present at diagnosis (Figure 5). TFx values remained high throughout treatment, despite the decreasing primary tumor volume reflecting the active tumor seeds in the vitreous. This demonstrates how TFx is representative of the overall disease state in the eye. Six months after diagnosis, due to persistent active disease, the eye was enucleated. The genomic profile obtained from the tumor tissue at that time demonstrated 92.81% concordance with the AH sample obtained at the time of diagnosis (Figure 4B).
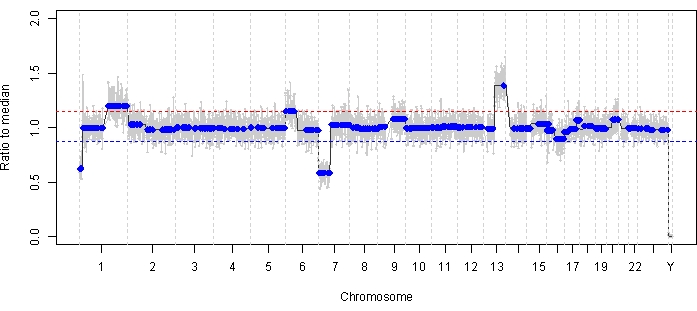
Figure 2: Genomic profile at diagnosis for case 47. Highly recurrent RB SCNAs 1q gain and 6p gain, along with non-highly recurrent RB SCNAs 7p loss and 13q gain, were identified in the AH taken at the time of diagnosis. The red line represents the threshold for a gain, while the blue line represents the threshold for a loss. Notably, the amplitude of 6p gain was <1.5 ratio to the median, which is below the threshold of the molecular signature that portends a poor prognosis. Thus, based on the lack of negative biomarkers for eye salvage, this eye would be predicted to respond to therapy. Please click here to view a larger version of this figure.
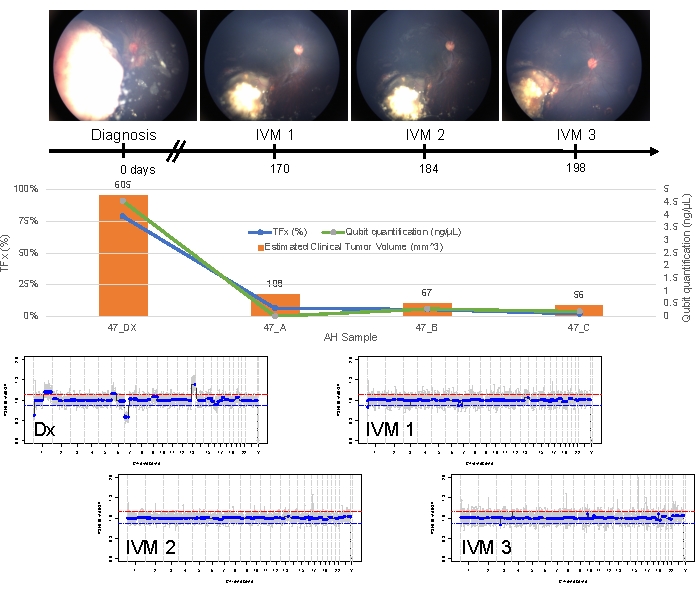
Figure 3: Longitudinal information for case 47. This includes fundus photos, cfDNA quantification, estimated clinical tumor volume from B-scan measurements, genomic profiles, and TFx estimations for each clinical time point at which AH was sampled (Dx = diagnosis, A = IVM1, B = IVM2, C = IVM3). This eye responded to treatment and remained salvaged at 19 months of follow-up. A decrease in cfDNA quantity was observed over time, consistent with previously published studies showing the highest yield obtained at diagnosis. TFx also decreased over treatment, reflecting the resolution of seeding and the decrease in the main retinal tumor volume (tumor volumes are indicated above each clinical time point's orange bar). As expected with clinical regression of the disease, genomic profiles normalized as well. In the genomic profiles, the red line represents the threshold for a gain, while the blue line represents the threshold for a loss. This figure has been reprinted with permission from Xu, L. et al.21. Please click here to view a larger version of this figure.
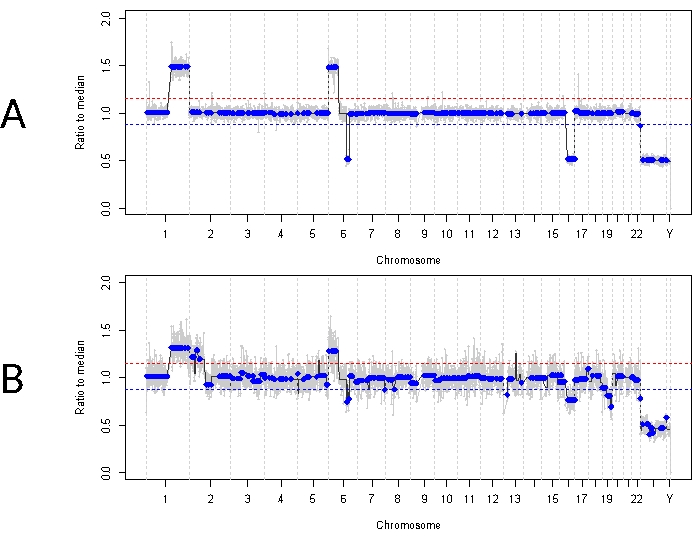
Figure 4: Genomic profiles for case 33. The red line represents the threshold for a gain, while the blue line represents the threshold for a loss (A) Genomic profile at diagnosis for case 33. Highly recurrent RB SCNAs 1q gain, 6p gain, and 16q loss were identified in the AH at diagnosis, in addition to the focal 6q loss. Notably, the amplitude of 6p gain was 1.5 ratio to the median, indicating a poor prognostic molecular biomarker. Thus, based on this molecular signature, we would predict that this eye had a significantly increased likelihood of treatment failure. (B) Genomic profile obtained from enucleated tumor tissue, which was highly concordant with the profile obtained from AH at diagnosis. Due to admixing with normal retinal tissue, SCNAs from tumor tissue can demonstrate lower amplitude compared to AH due to diluted TFx. Please click here to view a larger version of this figure.
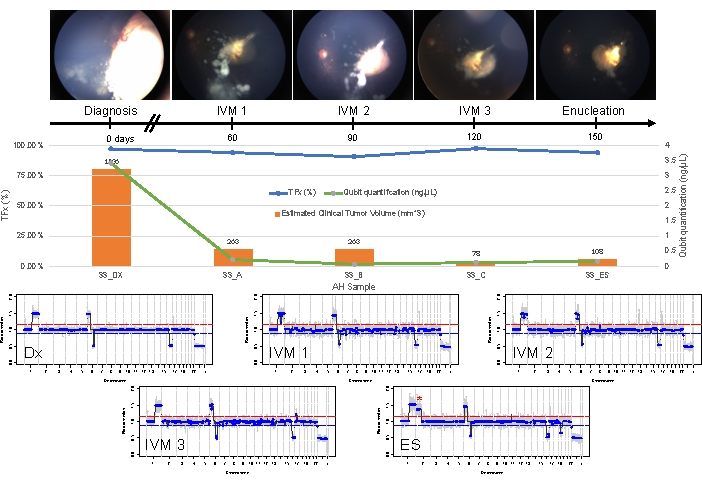
Figure 5: Longitudinal information for Case 33. This includes fundus photos, cell-free DNA quantification, estimated clinical tumor volume from B-scan measurements (tumor volumes are indicated above each clinical time point's orange bar), genomic profiles, and TFx estimations for each clinical time point at which AH was sampled (Dx = diagnosis, A = IVM1, B = IVM2, C = IVM3, SE = secondary enucleation). This eye did not respond to treatment, ultimately requiring secondary enucleation (ES). This was due to persistently active seeding accompanied by an apical tumor recurrence. CfDNA quantity decreased over time, consistent with the previously published studies showing the highest yield obtained at diagnosis (1q gain, 6p gain, 16q loss, and focal 6q loss). However, TFx remained high throughout treatment, a product of the persistent seeding that still sheds tumor-derived cfDNA into the AH. Genomic profiles were consistent and showed the same three SCNAs that were present at diagnosis. In the AH obtained at ES, a new large-scale 2p gain (*) and 19q loss were seen, suggesting clonal evolution at the time of apical tumor recurrence. In the genomic profiles, the red line represents the threshold for a gain, while the blue line represents the threshold for a loss. This figure has been reprinted with permission from Xu, L. et al.21. Please click here to view a larger version of this figure.
Supplementary File 1: An example of (A) a sample that should pass quality control, with the peak around 300 bp and (B) a sample that should not pass quality control, with the peak around 150 bp. Please click here to download this File.
Supplementary Video 1. Demonstration of the AH SCNA analysis workflow. The video demonstrates access to the GitHub repository and navigation of the resources used for AH SCNA analysis, including the SOP, analysis scripts, and representative copy-number profiles. Please click here to download this File.
Discussion
Loading...
$$\rightleftharpoonup{xx}$$
$$\longleftharp{xx}$$,
$$\longrightharp{xx}$$,
Clear corneal paracentesis is a procedure performed commonly for multiple diagnostic and/or therapeutic indications in ophthalmology. Specifically for RB, it is part of the standard intravitreal chemotherapy injection protocol to decrease the intraocular pressure prior to injection to prevent reflux to the injection site48. Despite being a common procedure, it is not completely without risk; previous dogma was that a needle should never enter an eye with active RB. This dogma has evolved over the last decade, first via the formative work from Patricia Chévez-Barrios on injected adenoviral vector therapy49 followed by progressive safety enhanced methods for ocular injections in RB by Francis Munier48. This work has paved the way for the extraction of the AH to be used as a liquid biopsy, or surrogate to tumor biopsy, for this cancer. We are now the first center to report the utility of the platform and preliminary safety results from AH taken at the time of diagnosis. Part of the methods described herein is meant to ensure the safety of patient selection and procedural aspects of AH extraction for RB. Firstly, needles can only enter the anterior chamber and should not make contact with the iris or lens, as this can cause iris scarring or cataract that limits the ability of the surgeon to monitor the tumor. It is most important that the needle never enters the vitreous cavity (unless combined with chemotherapy delivery as is the case for IVM), or contacts the tumor as this hypothetically elevates the risk of tumor seeding and extraocular extension of disease3,4,5. Both of these structures are posterior to the anterior chamber and separated from it by the lens and iris. To avoid damage to any ocular structures, it is important to keep the needle bevel up at all times, above the peripheral iris, and always under direct visualization using the surgical microscope. There is a risk of minor leakage of the AH from the needle site; if this occurs, it will resolve with gentle pressure via a cotton tip applicator. Using the smallest available gauge needle and ensuring that the needle is slowly extracted from the same tract without any lateral shearing will decrease this risk. Although slight shallowing of the anterior chamber is expected, the chamber should remain formed without iris cornea touch, and the intraocular pressure should be soft, but physiologic.
Concerning genomic analyses, there are several critical steps involved. The most important is the handling of the small volume sample once extracted from the eye; it is crucial that the sample remain frozen the entire time before processing to prevent DNA degradation that can occur with repeated freeze and thaw cycles50. Ensuring samples are placed on dry ice immediately after extraction and transferred to a -80 °C freezer helps ensure this. Once samples have begun processing, quality control steps are the main opportunity to troubleshoot by guaranteeing that the cfDNA is constructed into high-quality libraries. Using DNA quantification and DNA fragment size profiling assay, quality control can be performed on samples taken during primary enucleation or at the time of diagnosis due to the higher yield of cfDNA present in these samples18,21. When the peak obtained is around 300 bp, this guarantees that the cfDNA will be recognized by the NGS platform. If the peak obtained is shorter than 150 bp indicating that the majority of fragments detected are library construction primers or adaptor oligos, the sample has been compromised and should not be processed further for SCNAs. However, in our experience of processing hundreds of samples, less than 5% need to be removed for quality control due to poor reads alignment ratio20. Along with the methods we standardized for specimen collection, handling, storage, and processing, this procedure demonstrates the pre-analytical validity of the AH liquid biopsy platform.
The AH liquid biopsy also has established analytical validity based on its ability to accurately and reliably detect RB1 pathogenic mutations and SCNAs, with mean concordances consistently >95% between genomic profiles generated from AH samples and corresponding tumor tissue18,20,21,22,23. Despite the platform's demonstrated analytical validity, it is not without limitations. RB1 mutational analysis can only be performed on samples with >10 ng of cfDNA, which are most frequently obtained in treatment-naïve eyes at the time of diagnosis or primary enucleation18,21. This is due to the lower concentration of cfDNA present in AH samples from eyes that are actively undergoing treatment compared to AH at diagnosis or at the time of primary enucleation. An additional constraint is that SCNAs cannot be detected at TFxs below 5%, which prevents the monitoring of disease in eyes wherein the tumor burden has fallen significantly; in our experience, this occurs most commonly in eyes responsive to intravitreal chemotherapy treatment23.
In order to determine the TFx of cfDNA in the AH, CNA-based TFx estimation software is utilized. This software is a standard and accepted tool for TFx calculation in liquid biopsies, and its algorithm has been described in detail38,51. Briefly, CNA-based TFx estimation software predicts large-scale SCNAs within sequenced cfDNA utilizing a hidden Markov model. TFx estimations are derived based on the presence of SCNAs while accounting for differences in subclonality and ploidy at each locus, and from these, the CNA-based TFx estimation software chooses an optimal TFx solution38. However, an inherent limitation of CNA-based TFx estimation software is that TFx is calculated based on the presence of SCNAs in a sample; thus, it is unable to determine TFx in samples without SCNAs (i.e., with flat genomic profiles)38. As has been previously demonstrated, not all RB tumors have SCNAs14,15,18,21,23,45. Therefore, a very low TFx as determined by CNA-based TFx estimation software means that either 1) the AH sample has no measurable tumor-derived cfDNA in it or 2) tumor cfDNA is present, but it is undetectable by CNA-based TFx estimation software because of a lack of SCNAs38. Variant allele fraction (VAF) for SNV is a surrogate for TFx. For this reason, we are working to develop an RB1-based TFx pipeline based on VAF in order to allow RB eyes without SCNAs to receive longitudinal TFx monitoring as well. Given that all RB tumors, with exceptions for primary MYCN driven tumors14,15,42,43,44,45, contain somatic mutations in the RB1 gene, a pipeline not dependent on SCNAs would broaden the application of the liquid biopsy protocol presented herein. Additionally, because SNVs can be monitored to TFxs below 5%, this would increase the sensitivity of our platform.
The AH liquid biopsy platform described here is not the only liquid biopsy platform that exists in the literature for RB, but notably, it is the first to describe the aqueous as an enriched source of tumor DNA and the first to describe the detection of ctDNA via two mechanisms (SCNAs and RB1 SNVs) in any biofluid based on published work to date. With the ability to detect ctDNA in two ways, the AH liquid biopsy has a higher sensitivity than other platforms in the literature. For example, another group has successfully detected RB ctDNA in the AH with RB1 SNVs52. However, this platform relied on targeted NGS reads based on a priori knowledge of the SNV. In contrast, the platform detailed in this manuscript utilizes non-biased WGS, giving it the ability to detect SCNAs and SNVs. Blood-based liquid biopsies have been tried as well, although the cfDNA obtained has consistently been below the threshold for SCNA detection, which is the prognostic for the likelihood of ocular salvage (at this time, RB1 SNVs have not been shown to be prognostic for eye salvage, however there may be an evolving role for detection of metastatic disease)19. Kothari et al. described RB1 SNVs in the plasma of RB patients, but only those with an advanced intraocular disease requiring enucleation16. The AH liquid biopsy platform described here has the ability to detect ctDNA in the AH of less-advanced eyes, even without the presence of seeding19,21. Furthermore, blood-based liquid biopsies are not eye-specific, as ctDNA isolated from the serum may be from both eyes in cases of bilateral RB. This limits the clinical utility of blood-based platforms, particularly in bilateral patients who make up 40% of RB cases, while the AH remains eye-specific and can demonstrate inter-eye heterogeneity at both the SNV and SCNA levels53.
The significance of the AH liquid biopsy for the field of RB is paramount. Not only does the AH liquid biopsy provide the opportunity to better understand intratumoral dynamics in eyes that are actively undergoing therapy, but it also has the potential to improve patient care. Based on previous studies, we have established a molecular signature—based on the presence of either MYCN amplification or chromosome 6p gain with an amplitude of ≥1.5 ratio to the median—that is prognostic for a 16.5-fold increased likelihood of treatment failure requiring enucleation18,20,21. With this knowledge at the time of diagnosis, clinicians would be better able to counsel families on appropriate treatment options and the likelihood of eye salvage with current therapeutics. Although clinical validity of the AH liquid biopsy platform for RB has been established17,18,19,20,21,22,23, it is currently approved for research only; larger prospective multi-center studies are needed before the AH liquid biopsy can be implemented clinically to help direct patient care for RB. Regardless, the AH liquid biopsy has the potential to enable precision oncology in the future, not only for RB, but for other ocular tumors as well.
Disclosures
Loading...
$$\rightleftharpoonup{xx}$$
$$\longleftharp{xx}$$,
$$\longrightharp{xx}$$,
Jesse Berry, Liya Xu, and James Hicks have filed a patent application entitled Aqueous Humor Cell-Free DNA for Diagnostic and Prognostic Evaluation of Ophthalmic Disease. Otherwise, the authors report no potential conflict of interest.
Acknowledgements
Loading...
$$\rightleftharpoonup{xx}$$
$$\longleftharp{xx}$$,
$$\longrightharp{xx}$$,
This research was supported by the following sources: NCI of the NIH Award K08CA232344 (to J. L. Berry); Hyundai Hope on Wheels RGA012351 (to J. L. Berry); Childhood Eye Cancer Trust (to J.L. Berry); American Cancer Society IRG-16-181-57 (to J. L. Berry); Wright Foundation (to J.L. Berry and M.E. Kim); Knights Templar Eye Foundation (to J.L. Berry); The Larry and Celia Moh Foundation (to J. L. Berry); The Institute for Families, Inc., Children's Hospital Los Angeles (J. L. Berry); an unrestricted departmental grant from Research to Prevent Blindness (all); The NCI P30CA014089 (all); Vicky Joseph Research Fund (to P. Kuhn); Carol Vassiliadis Research Fund (to P. Kuhn); and USC Dornsife College of Letters, Arts and Sciences (to P. Kuhn).
Materials
| Name | Company | Catalog Number | Comments |
|---|---|---|---|
| 1 cc syringe | surgical grade, whatever available in hospital | ||
| 32 G needle | surgical grade, whatever available in hospital | ||
| Aligner | Authors use Bowtie2 (http://bowtie-bio.sourceforge.net/bowtie2/index.shtml) but other aligners such as BWA or GRCh38 will also work | ||
| Atropos | generic term: adapter remover. https://atropos.readthedocs.io/en/latest/index.html# | ||
| Bioanalyzer High Sensitivity DNA Kit | Agilent | 5067-4626 | generic term: DNA fragment size profiling assay |
| BWA-MEM | generic term: long sequence aligner. http://bio-bwa.sourceforge.net/bwa.shtml | ||
| DNAcopy | Bioconductor | generic term: DNA copy number data analysis. https://bioconductor.org/packages/release/bioc/html/DNAcopy.html | |
| dsDNA High Sensitivity Assay | Qubit | Q32851 | generic term: DNA quantification assay |
| FreeBayes | generic term: sequence variant determiner. https://github.com/freebayes/freebayes | ||
| ichorCNA software | generic term: CNA-based TFx estimation. https://github.com/broadinstitute/ichorCNA | ||
| Illumina platform | Illumina | generic term: NGS platform; please note that other NGS platforms will work in principle, but have not been trialed by these authors | |
| NovoAlign (v3) | Novocraft | generic term: mapping of short reads onto reference genome. http://www.novocraft.com/products/novoalign/ | |
| QIAamp Circulating Nucleic Acid Kit | Qiagen | 55114 | generic term: cfDNA isolation and purification kit |
| QIAseq Ultralow Input Library Kit | Qiagen | 180492 | generic term: DNA library sequencing kit |
| Samtools rmdup | generic term: tool to remove duplicate reads. http://www.htslib.org/doc/samtools-rmdup.html | ||
| VarDict | generic term: variant caller. https://github.com/AstraZeneca-NGS/VarDict | ||
| Variant Effect Predictor | Ensembl | generic term: variant effect determinator. https://uswest.ensembl.org/info/docs/tools/vep/index.html |
References
Loading...
$$\rightleftharpoonup{xx}$$
$$\longleftharp{xx}$$,
$$\longrightharp{xx}$$,
- Retinoblastoma in the United States: A 40-year incidence and survival analysis. Journal of Pediatric Ophthalmology & Strabismus. 55 (3), 182-188 (2018).">Fernandes, A. G., Pollock, B. D., Rabito, F. A. Retinoblastoma in the United States: A 40-year incidence and survival analysis. Journal of Pediatric Ophthalmology & Strabismus. 55 (3), 182-188 (2018).
- Intraocular retinoblastoma: the case for a new group classification. Ophthalmology Clinics of North America. 18 (1), 41-53 (2005).">Linn, A. M. Intraocular retinoblastoma: the case for a new group classification. Ophthalmology Clinics of North America. 18 (1), 41-53 (2005).
- Fine-needle aspiration biopsy of suspected intraocular tumors. The 1992 Urwick lecture. Ophthalmology. 100 (11), 1677-1684 (1993).">Shields, J. A., Shields, C. L., Ehya, H., Eagle, R. C., De Potter, P. Fine-needle aspiration biopsy of suspected intraocular tumors. The 1992 Urwick lecture. Ophthalmology. 100 (11), 1677-1684 (1993).
- Tumor seeding in ocular fine needle aspiration biopsy. Ophthalmology. 92 (12), 1763-1767 (1985).">Karcioglu, Z. A., Gordon, R. A., Karcioglu, G. L. Tumor seeding in ocular fine needle aspiration biopsy. Ophthalmology. 92 (12), 1763-1767 (1985).
- Fine needle aspiration biopsy (FNAB) for retinoblastoma. Retina. 22 (6), 707-710 (2002).">Karcioglu, Z. A. Fine needle aspiration biopsy (FNAB) for retinoblastoma. Retina. 22 (6), 707-710 (2002).
- Fine needle aspiration biopsy in selecting treatment for inconclusive intraocular disease. Acta Ophthalmologica Scandinavica. 77 (4), 448-452 (1999).">Eide, N., Syrdalen, P., Walaas, L., Hagmar, B. Fine needle aspiration biopsy in selecting treatment for inconclusive intraocular disease. Acta Ophthalmologica Scandinavica. 77 (4), 448-452 (1999).
- Fine-needle aspiration biopsy and other biopsies in suspected intraocular malignant disease: a review. Acta Ophthalmologica. 87 (6), 588-601 (2009).">Eide, N., Walaas, L. Fine-needle aspiration biopsy and other biopsies in suspected intraocular malignant disease: a review. Acta Ophthalmologica. 87 (6), 588-601 (2009).
- Effects of fine-needle aspiration and other biopsy procedures on tumor dissemination in mice. Cancer. 54 (1), 73-78 (1984).">Eriksson, O., Hagmar, B., Ryd, W. Effects of fine-needle aspiration and other biopsy procedures on tumor dissemination in mice. Cancer. 54 (1), 73-78 (1984).
- Fine needle aspiration biopsy of retinal tumors. Monographs in Clinical Cytology. 21, 72-81 (2012).">Ali, M. J., Honavar, S. G., Vemuganti, G. K., Singh, A. D. Fine needle aspiration biopsy of retinal tumors. Monographs in Clinical Cytology. 21, 72-81 (2012).
- The chemosensitivity profile of retinoblastoma. Recent Results in Cancer Research. 161, 73-80 (2003).">Di Nicolantonio, F. al, et al. The chemosensitivity profile of retinoblastoma. Recent Results in Cancer Research. 161, 73-80 (2003).
- Efficacy and toxicity of second-course ophthalmic artery chemosurgery for retinoblastoma. Ophthalmology. 122 (5), 1016-1022 (2015).">Francis, J. H., et al. Efficacy and toxicity of second-course ophthalmic artery chemosurgery for retinoblastoma. Ophthalmology. 122 (5), 1016-1022 (2015).
- Efficacy and toxicity of intravitreous chemotherapy for retinoblastoma: Four-year experience. Ophthalmology. 124 (4), 488-495 (2017).">Francis, J. H. Efficacy and toxicity of intravitreous chemotherapy for retinoblastoma: Four-year experience. Ophthalmology. 124 (4), 488-495 (2017).
- Current treatment of bilateral retinoblastoma: The impact of intraarterial and intravitreous chemotherapy. Neoplasia. 20 (8), 757-763 (2018).">Francis, J. H., et al. Current treatment of bilateral retinoblastoma: The impact of intraarterial and intravitreous chemotherapy. Neoplasia. 20 (8), 757-763 (2018).
- Characterisation of retinoblastomas without RB1 mutations: genomic, gene expression, and clinical studies. The Lancet Oncology. 14 (4), 327-334 (2013).">Rushlow, D. E., et al. Characterisation of retinoblastomas without RB1 mutations: genomic, gene expression, and clinical studies. The Lancet Oncology. 14 (4), 327-334 (2013).
- Next-generation sequencing of retinoblastoma identifies pathogenic alterations beyond RB1 inactivation that correlate with aggressive histopathologic features. Ophthalmology. 127 (6), 804-813 (2020).">Afshar, A. R., et al. Next-generation sequencing of retinoblastoma identifies pathogenic alterations beyond RB1 inactivation that correlate with aggressive histopathologic features. Ophthalmology. 127 (6), 804-813 (2020).
- Cell-free DNA profiling in retinoblastoma patients with advanced intraocular disease: An MSKCC experience. Cancer Medicine. 9 (17), 6093-6101 (2020).">Kothari, P. Cell-free DNA profiling in retinoblastoma patients with advanced intraocular disease: An MSKCC experience. Cancer Medicine. 9 (17), 6093-6101 (2020).
- Potential of aqueous humor as a surrogate tumor biopsy for retinoblastoma. JAMA Ophthalmology. 135 (11), 1221-1230 (2017).">Berry, J. L., et al. Potential of aqueous humor as a surrogate tumor biopsy for retinoblastoma. JAMA Ophthalmology. 135 (11), 1221-1230 (2017).
- Genomic cfDNA analysis of aqueous humor in retinoblastoma predicts eye salvage: the surrogate tumor biopsy for retinoblastoma. Molecular Cancer Research. 16 (11), 1701-1712 (2018).">Berry, J. L., et al. Genomic cfDNA analysis of aqueous humor in retinoblastoma predicts eye salvage: the surrogate tumor biopsy for retinoblastoma. Molecular Cancer Research. 16 (11), 1701-1712 (2018).
- Aqueous humor is superior to blood as a liquid biopsy for retinoblastoma. Ophthalmology. 127 (4), 552-554 (2020).">Berry, J. L., et al. Aqueous humor is superior to blood as a liquid biopsy for retinoblastoma. Ophthalmology. 127 (4), 552-554 (2020).
- Chromosome 6p amplification in aqueous humor cell-free DNA Is a prognostic biomarker for retinoblastoma ocular survival. Molecular Cancer Research. 18 (8), 1166-1175 (2020).">Xu, L., et al. Chromosome 6p amplification in aqueous humor cell-free DNA Is a prognostic biomarker for retinoblastoma ocular survival. Molecular Cancer Research. 18 (8), 1166-1175 (2020).
- Establishing the clinical utility of ctDNA analysis for diagnosis, prognosis, and treatment monitoring of retinoblastoma: The aqueous humor liquid biopsy. Cancers. 13 (6), (2021).">Xu, L., et al. Establishing the clinical utility of ctDNA analysis for diagnosis, prognosis, and treatment monitoring of retinoblastoma: The aqueous humor liquid biopsy. Cancers. 13 (6), (2021).
- Simultaneous identification of clinically relevant RB1 mutations and copy number alterations in aqueous humor of retinoblastoma eyes. Ophthalmic Genetics. 41 (6), 526-532 (2020).">Xu, L. Simultaneous identification of clinically relevant RB1 mutations and copy number alterations in aqueous humor of retinoblastoma eyes. Ophthalmic Genetics. 41 (6), 526-532 (2020).
- Longitudinal aqueous humor sampling reflects treatment response in retinoblastoma patients. Investigative Ophthalmology & Visual Science. 61 (7), 1394(2020).">Polski, A., et al. Longitudinal aqueous humor sampling reflects treatment response in retinoblastoma patients. Investigative Ophthalmology & Visual Science. 61 (7), 1394(2020).
- https://genome.ucsc.edu/cgi-bin/hgTracks?db=hg19&lastVirtModeType=default&lastVirtModeExtraState=&virtModeType=default&3A15578261%_2D15621068&hgsid=1135765621_qIuA0U gr0mZoCn3sDUPmqP7rf4wu (2021).">Genome Browser. , Available from: https://genome.ucsc.edu/cgi-bin/hgTracks?db=hg19&lastVirtModeType=default&lastVirtModeExtraState=&virtModeType=default&3A15578261%_2D15621068&hgsid=1135765621_qIuA0U gr0mZoCn3sDUPmqP7rf4wu (2021).
- The UCSC genome browser database: 2021 update. Nucleic Acids Research. 49 (1), 1046-1057 (2021).">Navarro Gonzalez, J., et al. The UCSC genome browser database: 2021 update. Nucleic Acids Research. 49 (1), 1046-1057 (2021).
- A statistical framework for SNP calling, mutation discovery, association mapping and population genetical parameter estimation from sequencing data. Bioinformatics. 27 (21), 2987-2993 (2011).">Li, H. A statistical framework for SNP calling, mutation discovery, association mapping and population genetical parameter estimation from sequencing data. Bioinformatics. 27 (21), 2987-2993 (2011).
- Genome-wide copy number analysis of single cells. Nature Protocols. 7 (6), 1024-1041 (2012).">Baslan, T., et al. Genome-wide copy number analysis of single cells. Nature Protocols. 7 (6), 1024-1041 (2012).
- Orchestrating high-throughput genomic analysis with Bioconductor. Nature Methods. 12 (2), 115-121 (2015).">Huber, W., et al. Orchestrating high-throughput genomic analysis with Bioconductor. Nature Methods. 12 (2), 115-121 (2015).
- Erratum: Genome-wide copy number analysis of single cells. Nature Protocols. 11 (3), 1024-1041 (2016).">Baslan, T., et al. Erratum: Genome-wide copy number analysis of single cells. Nature Protocols. 11 (3), 1024-1041 (2016).
- http://bcbio-nextgen.readthedocs.io/en/latest/contents/citations.html (2020).">bcbio-nextgen. , Available from: http://bcbio-nextgen.readthedocs.io/en/latest/contents/citations.html (2020).
- Atropos: specific, sensitive, and speedy trimming of sequencing reads. PeerJ. 5, 3720(2017).">Didion, J. P., Martin, M., Collins, F. S. Atropos: specific, sensitive, and speedy trimming of sequencing reads. PeerJ. 5, 3720(2017).
- Aligning sequence reads, clone sequences and assembly contigs with BWA-MEM. arXiv. , preprint arXiv:1303.3997 (2013).">Li, H. Aligning sequence reads, clone sequences and assembly contigs with BWA-MEM. arXiv. , preprint arXiv:1303.3997 (2013).
- http://novocraft.com/products/novoalign/ (2014).">NovoAlign. Novocraft Technologies. , Available from: http://novocraft.com/products/novoalign/ (2014).
- Haplotype-based variant detection from short-read sequencing. arXiv. , preprint arXiv:1207.3907 (2012).">Garrison, E., Marth, G. Haplotype-based variant detection from short-read sequencing. arXiv. , preprint arXiv:1207.3907 (2012).
- The ensembl variant effect predictor. Genome Biology. 17 (1), 122(2016).">McLaren, W., et al. The ensembl variant effect predictor. Genome Biology. 17 (1), 122(2016).
- VarDict: a novel and versatile variant caller for next-generation sequencing in cancer research. Nucleic Acids Research. 44 (11), 108(2016).">Lai, Z., et al. VarDict: a novel and versatile variant caller for next-generation sequencing in cancer research. Nucleic Acids Research. 44 (11), 108(2016).
- https://github.com/broadinstitute/ichorCNA (2017).">GitHub. , Available from: https://github.com/broadinstitute/ichorCNA (2017).
- Scalable whole-exome sequencing of cell-free DNA reveals high concordance with metastatic tumors. Nature Communications. 8 (1), 1-13 (2017).">Adalsteinsson, V. A., et al. Scalable whole-exome sequencing of cell-free DNA reveals high concordance with metastatic tumors. Nature Communications. 8 (1), 1-13 (2017).
- https://github.com/broadinstitute/ichorCNA/wiki/Interpreting-ichorCNA-results (2017).">GitHub. , Available from: https://github.com/broadinstitute/ichorCNA/wiki/Interpreting-ichorCNA-results (2017).
- Long-term outcomes of Group D retinoblastoma eyes during the intravitreal melphalan era. Pediatric Blood & Cancer. 64 (12), (2017).">Berry, J. L., et al. Long-term outcomes of Group D retinoblastoma eyes during the intravitreal melphalan era. Pediatric Blood & Cancer. 64 (12), (2017).
- Long-term outcomes of Group D eyes in bilateral retinoblastoma patients treated with chemoreduction and low-dose IMRT salvage. Pediatric Blood & Cancer. 60 (4), 688-693 (2013).">Berry, J. L., et al. Long-term outcomes of Group D eyes in bilateral retinoblastoma patients treated with chemoreduction and low-dose IMRT salvage. Pediatric Blood & Cancer. 60 (4), 688-693 (2013).
- Molecular changes in retinoblastoma beyond RB1: Findings from next-generation sequencing. Cancers (Basel). 13 (1), (2021).">Francis, J. H., et al. Molecular changes in retinoblastoma beyond RB1: Findings from next-generation sequencing. Cancers (Basel). 13 (1), (2021).
- Comprehensive characterization of RB1 mutant and MYCN amplified retinoblastoma cell lines. Experimental Cell Research. 375 (2), 92-99 (2019).">Schwermer, M., et al. Comprehensive characterization of RB1 mutant and MYCN amplified retinoblastoma cell lines. Experimental Cell Research. 375 (2), 92-99 (2019).
- Whole-genome sequencing of retinoblastoma reveals the diversity of rearrangements disrupting RB1 and uncovers a treatment-related mutational signature. Cancers. 13 (4), 754(2021).">Davies, H. R. Whole-genome sequencing of retinoblastoma reveals the diversity of rearrangements disrupting RB1 and uncovers a treatment-related mutational signature. Cancers. 13 (4), 754(2021).
- Comparative genomic hybridization of 49 primary retinoblastoma tumors identifies chromosomal regions associated with histopathology, progression, and patient outcome. Genes, Chromosomes and Cancer. 36 (2), 121-128 (2003).">Lillington, D. M., et al. Comparative genomic hybridization of 49 primary retinoblastoma tumors identifies chromosomal regions associated with histopathology, progression, and patient outcome. Genes, Chromosomes and Cancer. 36 (2), 121-128 (2003).
- Frequency and parental origin of hypermethylated RB1 alleles in retinoblastoma. Human Genetics. 94 (5), 491-496 (1994).">Greger, V., et al. Frequency and parental origin of hypermethylated RB1 alleles in retinoblastoma. Human Genetics. 94 (5), 491-496 (1994).
- DNA hypermethylation/boundary control loss identified in retinoblastomas associated with genetic and epigenetic inactivation of the RB1 gene promoter. Epigenetics. 1-15, (2020).">Raizis, A. M., et al. DNA hypermethylation/boundary control loss identified in retinoblastomas associated with genetic and epigenetic inactivation of the RB1 gene promoter. Epigenetics. 1-15, (2020).
- Profiling safety of intravitreal injections for retinoblastoma using an anti-reflux procedure and sterilisation of the needle track. British Journal of Ophthalmology. 96 (8), 1084-1087 (2012).">Munier, F. L., et al. Profiling safety of intravitreal injections for retinoblastoma using an anti-reflux procedure and sterilisation of the needle track. British Journal of Ophthalmology. 96 (8), 1084-1087 (2012).
- Response of retinoblastoma with vitreous tumor seeding to adenovirus-mediated delivery of thymidine kinase followed by ganciclovir. Journal of Clinical Oncology. 23 (31), 7927-7935 (2005).">Chévez-Barrios, P., et al. Response of retinoblastoma with vitreous tumor seeding to adenovirus-mediated delivery of thymidine kinase followed by ganciclovir. Journal of Clinical Oncology. 23 (31), 7927-7935 (2005).
- Characterization of effect of repeated freeze and thaw cycles on stability of genomic DNA using pulsed field gel electrophoresis. Biopreservation and Biobanking. 10 (1), 4-11 (2012).">Shao, W., Khin, S., Kopp, W. C. Characterization of effect of repeated freeze and thaw cycles on stability of genomic DNA using pulsed field gel electrophoresis. Biopreservation and Biobanking. 10 (1), 4-11 (2012).
- Tumor fraction in cell-free DNA as a biomarker in prostate cancer. JCI Insight. 3 (21), (2018).">Choudhury, A. D., et al. Tumor fraction in cell-free DNA as a biomarker in prostate cancer. JCI Insight. 3 (21), (2018).
- Non-invasive diagnosis of retinoblastoma using cell-free DNA from aqueous humour. British Journal of Ophthalmology. 103 (5), 721-724 (2019).">Gerrish, A., et al. Non-invasive diagnosis of retinoblastoma using cell-free DNA from aqueous humour. British Journal of Ophthalmology. 103 (5), 721-724 (2019).
- Inter-eye genomic heterogeneity in bilateral retinoblastoma via aqueous humor liquid biopsy. NPJ Precis Oncol. 5 (1), 73(2021).">Wong, E. Y., Xu, L., Shen, L. Inter-eye genomic heterogeneity in bilateral retinoblastoma via aqueous humor liquid biopsy. NPJ Precis Oncol. 5 (1), 73(2021).
Reprints and Permissions
Request permission to reuse the text or figures of this JoVE article
Request Permission