The Innovation Arena is a novel comparative method for studying technical innovation rate per time unit in animals. It is composed of 20 different problem-solving tasks, which are presented simultaneously. Innovations can be carried out freely and the setup is robust with regard to predispositions on an individual, population or species level.
Method Article
The Innovation Arena: A Method for Comparing Innovative Problem-Solving Across Groups
In This Article
Summary
Abstract
Problem-solving tasks are commonly used to investigate technical, innovative behavior but a comparison of this ability across a broad range of species is a challenging undertaking. Specific predispositions, such as the morphological toolkit of a species or exploration techniques, can substantially influence performance in such tasks, which makes direct comparisons difficult. The method presented here was developed to be more robust with regard to such species-specific differences: the Innovation Arena presents 20 different problem-solving tasks. All tasks are presented simultaneously. Subjects are confronted with the apparatus repeatedly, which allows a measurement of the emergence of innovations over time - an important next step for investigating how animals can adapt to changing environmental conditions through innovative behavior.
Each individual was tested with the apparatus until it ceased to discover solutions. After testing was concluded, we analyzed the video recordings and coded successful retrieval of rewards and multiple apparatus-directed behaviors. The latter were analyzed using a Principal Component Analysis and the resulting components were then included in a Generalized Linear Mixed Model together with session number and the group comparison of interest to predict the probability of success.
We used this approach in a first study to target the question of whether long-term captivity influences the problem-solving ability of a parrot species known for its innovative behavior: the Goffin´s cockatoo. We found an effect in degree of motivation but no difference in the problem-solving ability between short- and long-term captive groups.
Introduction
A great tit (Parus major) is confronted with a milk bottle, but it cannot access the milk directly as the bottle is closed by an aluminum foil. It finds a solution to this problem by pecking through the foil so it can drink the cream. This situation describes one of the most widely known examples of animal innovation1.
Solving such problems can be advantageous, especially in environments that are subject to frequent change. Kummer and Goodall2 have broadly defined innovation as finding "a solution to a novel problem, or a novel solution to an old one". A more detailed definition of innovation was postulated by Tebbich and colleagues3 as "the discovery of a new behavioral interaction with the social or physical environment, tapping into an existing opportunity and/or creating a new opportunity".
Witnessing spontaneous innovations demands thorough and time-consuming observations, which is often not feasible in a framework that includes a wide variety of species. In order to deal with this challenge, researchers have conducted rigorous literature reviews to estimate innovation rate4,5 and have uncovered correlations between the propensity to innovate and other factors such as neurological measures6,7,8 and feeding ecology9,10,11. Experimental tests, however, can elicit innovative behavior in a controlled environment. For this reason, performances in technical problem-solving tasks are often used as a proxy for innovative capacities in animals (see review in12).
A variety of different approaches have been used to investigate innovative problem-solving: for example, different groups of animals can be compared by their performance on a particular task. Such studies are typically targeting specific innovations or cognitive abilities (e.g., hook-bending behavior; see13,14,15). This allows researchers to gain detailed information within a specific context, but the interpretation of any similarities or differences is limited by the nature of the task, which might require different innovative strength from different groups (as discussed in13,14).
Other studies have implemented a series of consecutive tasks16,17. A comparison of performances on multiple tasks and an estimation of overall competence within specific domains is made possible by this method. A limitation of such studies, however, is in the successive presentation of the different tasks, which does not allow for an investigation of the emergence of innovations over time.
Yet another approach is to simultaneously offer different options of accessing a single reward. This is frequently achieved by using the Multi Access Box (MAB)18,19,20,21,22,23,24,25,26, where one reward is placed in the center of a puzzle box and is retrievable via four different solutions. Once the same solution is used consistently, it is blocked and the animal needs to switch to another solution to access the reward. Through such an experiment, between and within species preferences can be detected and accounted for but it still limits the expression of innovative behavior to one solution per trial18,19,20,21. In other studies, animals have also been presented with apparatuses containing multiple solutions at the same time, each with separate rewards. This allows for multiple innovations within a single trial, but, so far, tasks have been largely limited to a few motorically distinct solutions. Given it was not the focus of these studies, the experimental setups did not involve repeated exposures to the apparatus, which would allow for a measure of innovation rate per time unit27,28,29.
Here we present a method that, in addition to other approaches, may help us in the aim of comparing different species in their innovative problem-solving abilities. We developed a wider range of tasks within a single setup, which are expected to differ in difficulty per group or species. It is, therefore, less likely that task-specific disparities influence the overall probability of finding solutions. Furthermore, we present all tasks simultaneously and repeatedly to measure the emergence of innovations over time. This measure has the potential to enhance our understanding on the adaptive value of innovative behavior.
A first study using this method has investigated whether long-term captivity influences problem-solving abilities (as suggested by the so-called captivity effect; see30) of the Goffin`s cockatoo (Cacatua goffiniana; hereafter: Goffins), an avian model species for technical innovativeness (reviewed in31).
Protocol
This study was approved by the Ethics and Animal Welfare Committee of the University of Veterinary Medicine Vienna in accordance with good scientific practice guidelines and national legislation. The experiment was purely appetitive and strictly non-invasive and was therefore classified as a non-animal experiment in accordance with the Austrian Animal Experiments Act (TVG 2012). The part of the experiment conducted in Indonesia was approved by the Ministry of Research, Technology and Higher Education (RISTEK) based on a meeting by the Foreign Researcher Permit Coordinating Team (10/TKPIPA/E5/Dit.KI/X/2016) who granted the permits to conduct this research to M.O. (410/SIP/FRP/E5/Dit.KI/XII/2016) and B.M. (411/SIP/FRP/ E5/Dit.KI/XII/2016).
1. Preconditions/prerequisites
- Basics
- Ensure that subjects can be identified individually. The study species may have distinct individual patterns or individuals can be marked (e.g., with color rings or non-toxic paint).
NOTE: For more information on ringing as well as catching and releasing wild Goffins see Capture-release Procedure in Supplementary Information of32. - Ensure a visually occluded room is available for testing to avoid social learning between subjects.
- Identify a highly preferred reward for the study species and group by testing multiple different, available treats (see33 or Food Preference Test in Supplementary Information of reference32).
- Consider whether feeding time substantially differs between the groups. If so, consider a protocol that ensures the feeding time does not heavily reduce the time available to solve tasks for one of the groups (see step 4.8 for more information).
NOTE: In this study, there was a preference of the long-term captive group for cashews and for dried corn in short-term captive group.
- Ensure that subjects can be identified individually. The study species may have distinct individual patterns or individuals can be marked (e.g., with color rings or non-toxic paint).
- Designing the Innovation Arena
NOTE: The full apparatus, i.e., the Innovation Arena, consists of 20 different puzzle boxes, arranged in a semi-circle on a wooden platform.- Design the basic outline of the boxes in a size applicable for the study species. Use transparent boxes having trapezoid shape (for easy alignment in a semi-circle), removable lids (to allow baiting in between sessions), and detachable bases (see Figure 1).
NOTE: Each base will later stay in a permanent position while the rest of the boxes will change positions. In the presented study, the size of the boxes was chosen to assure that each puzzle is easily accessible by the cockatoos. The dimensions can be adjusted for each study species. - Design a platform to hold the 20 puzzle boxes.
- Design a fixation system that will keep the lids of the boxes in place during testing and, therefore, cannot be removed by the subjects during test sessions.
NOTE: It has to be detachable from the apparatus as the lids of the boxes need to be taken off for baiting. - For the front of each box, design 20 different tasks, each of which will constitute a different technical challenge (see Figure 2).
NOTE: The tasks for this experiment were designed with the aim that solutions fall within the morphological range of many different species. For comparative strength, it would be ideal to use tasks as similar to these as possible but keep in mind that it is of even greater importance that the tasks are novel to the subjects. See the Table of Materials for exact measurements and the Supplementary Technical Drawing for a more detailed illustration of the tasks. - Acquire all material needed for the apparatus.
- Ensure to have a wide-angle camera, a coding software (recommended, e.g., Behavioral Observation Research Interactive Software, BORIS34) and software for statistical analysis (recommended, e.g., R35).
NOTE: For field studies, ideally, design the arena before leaving for the study site and bring as much as possible of the essential equipment, such as pre-cut acrylic glass, along.
- Design the basic outline of the boxes in a size applicable for the study species. Use transparent boxes having trapezoid shape (for easy alignment in a semi-circle), removable lids (to allow baiting in between sessions), and detachable bases (see Figure 1).
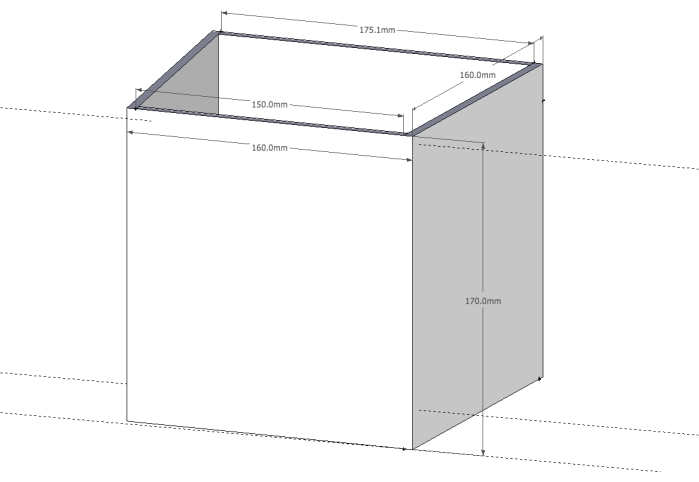
Figure 1: Diagram of a basic three-sided box. Please click here to view a larger version of this figure.
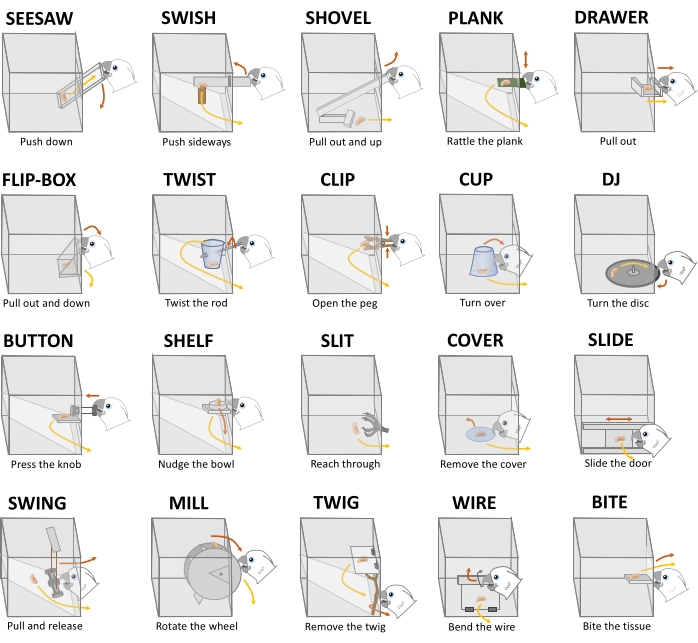
Figure 2: Tasks of the Innovation Arena with a corresponding description of the motoric action required for solving ( = reward; red arrows indicate directions of actions required to solve tasks; yellow arrows indicate reward trajectories). Tasks are arranged according to their mean difficulty (left to right, top to bottom). Previously published in32. Please click here to view a larger version of this figure.
2. Preparations
- Glue together three sides of the boxes: left, back, and right side but not the front, top and base.
- Position each three-sided box on top of each base and evenly align them in a semicircle on the platform (Figure 3). The front section of each box should sit 1 m from the center.
NOTE: The mechanisms constituting the task (front faces of boxes and possible contents) will be added at a later point during the experiment. - Draw a line from each box 20 cm toward the center of the arena and connect the lines, resulting in a proximity grid (Figure 3).
NOTE: Depending on the size of the study species, a different distance might be more appropriate. For the study presented here, 20 cm was chosen as it is roughly the length of a Goffin (tail feathers excluded). - Remove everything except the bases of the boxes and attach them permanently to the platform. This will ensure that the boxes will stay in place during the experiment.
- Attach a wide-angle camera on the ceiling above the arena.
- Prepare a schedule for the position of each box per session and subject. Each subject will always be confronted with all boxes, but with a new arrangement each session. The location (positions 1 to 20) of each task should be randomly assigned with the restriction of no box being at the same position twice per subject.
NOTE: This is the ideal situation. If one cannot plan the test order of subjects (which is more likely in field studies) this randomization limitation (no box at the same position twice) between sessions (but not within subject) must suffice.
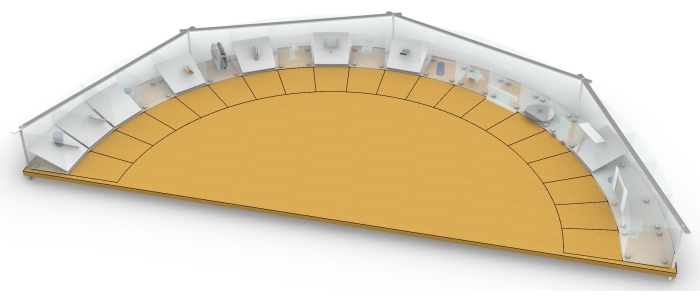
Figure 3: The Innovation Arena. Tasks arranged in a semi-circle; the positions of the 20 tasks are exchangeable. A proximity grid (20 cm in front of each box) is marked in black. Please click here to view a larger version of this figure.
3. Habituation
NOTE: The purpose of habituation is to reduce influences of neophobic reactions toward the arena. Ensure a minimum habituation level for all subjects through a habituation procedure that requires each individual to reach two criteria.
- Habituation to non-functional arena (until criterion I)
- Position all three-sided boxes on the bases, add the lid of each box and hold them in place with the fixation system (without the subject present).
NOTE: Consider habituating the subjects in stages that are appropriate for each species, for example, by incrementally adding more boxes to the platform, presenting the arena in their home area, placing rewards at any position of the platform such as around, on top, and with the boxes or confront them with the apparatus in bigger groups first and gradually minimize the group size. - Familiarize subjects with separate elements of the tasks that might elicit neophobic reactions.
NOTE: These separate elements (i.e., everything but the basic boxes, platform, and fixation system) must not be combined into functional mechanisms at this stage. - Place one reward inside the box (center). Bring the subject into the compartment.
- Wait for the length of a session without interfering. Subjects are now supposed to eat the rewards.
NOTE: The duration of these habituation sessions differed in the experiment: long-term captive birds received 10 min, while short-term captive cockatoos had 20 min to eat the rewards. This was necessary to account for a substantially longer feeding time due to different reward types. This issue was addressed differently later in the test sessions (see step 4.8). - Repeat for each subject (one session per test day) until criterion is reached: Each individual consumes all the rewards from three-sided boxes (one reward per box) within three consecutive sessions while being visually isolated from the group.
- Position all three-sided boxes on the bases, add the lid of each box and hold them in place with the fixation system (without the subject present).
- Habituation to functional arena (until criterion II)
- Glue and permanently attach all the necessary elements to the boxes to make them functional puzzle boxes.
NOTE: At this point, the arena is fully functional as in the test sessions. - Place the boxes randomly on the platform (they will be kept in place by the bases) and secure the lids to the boxes.
- Place one reward on the lid of each box on the edge closest to the center of the arena.
- Bring the subject into the compartment.
- Wait for the length of a session without interfering.
NOTE: Subjects are supposed to now eat the rewards. - Repeat for each subject (one session per test day) until the criterion is reached.
NOTE: Criterion II: Individual consumes all the rewards from the top of the functional puzzle boxes (one reward per box) within one session while being visually isolated from the group. This criterion II will ensure that the subjects are not afraid of the arena, even when new parts are attached. They should however not interact with the mechanisms and should be interrupted if they do so.
- Glue and permanently attach all the necessary elements to the boxes to make them functional puzzle boxes.
4. Testing
- Place the boxes on the platform according to the randomization schedule.
- Bait each task at the appropriate location inside the boxes (see Figure 2).
NOTE: The exact location of each reward depends on the specific task and can be seen in the video. - Attach the lids to the boxes and secure them with the fixation system (to make sure subjects cannot pull them off).
- Separate one individual subject and bring it into the test compartment. Subjects are tested one at a time to avoid interference of social learning.
- Either position them on the start position (i.e., the point which is at equal distance to all the tasks at the center of the platform) or place an incentive (e.g., a reward) at the start position to ensure that the subject begins there.
- Start the timer and wait for 20 min (session duration) without interfering or interacting with the subject. The subject can solve as many tasks as possible.
- If the subject gets distracted with non-apparatus related objects, the experimenter is allowed to place them back at the start position of the arena (if possible).
- If the subject feeds for longer than 3 s on the reward, stop the timer, wait until the feeding is finished, and then resume timing.
NOTE: This is done to ensure that the maximum time available to solve tasks is not reduced by feeding time and therefore equal for both groups. - If the subject does not interact with any task within the first 3 min and is also not agitated, apply a motivation protocol (see section 5).
- Once the 20 min have elapsed (maximum duration of one session) or the participant has solved all the tasks, the subject is done with the testing for the day and can be released back into the home area.
- On the next test day, repeat this procedure.
- Continue testing each individual until it either does not solve any new task in the last five sessions or does not solve any task at all in 10 consecutive sessions.
5. Motivation protocol
NOTE: As described above (step 4.9), a motivational protocol can be implemented if an individual does not interact with any task within the first 3 min of a session.
- Place three rewards on top of the boxes (choose a box on the left, middle, and right side for this). If the subject starts interacting with any task 3 min after consuming the rewards, resume the session (the 20 min duration starts at this point).
- If not, place five rewards dispersed on the approach line (i.e., proximity grid). If the subject starts interacting with any task 3 min after consuming the rewards, resume the session (the 20 min duration starts at this point).
- If not, place five rewards at the starting position. If the subject starts interacting with any task 3 min after consuming the rewards, resume the session (the 20 min time frame starts at this point).
- If not, place a handful of rewards at the start position and terminate the test session for this day (but give the subject some time to consume the rewards).
6. Analysis
- Behavioral coding
- Before analyzing the videos examine the coding protocol in detail (Table 1) and consider whether adjustments are necessary for the species being tested.
NOTE: The descriptions of the coding variables should be as specific as possible in order to avoid coding differences between various researchers. - Annotate point events of: Number of different tasks touched (TasksTouched; Note that the maximum number of tasks touched is 20), number of tasks solved (TasksSolved), contact with baited tasks (BaitedContact), and contact with solved tasks (SolvedContact).
- Annotate durations for latency until the subject crosses the outer boarder of the grid line (LatencyGrid) and time spent within the grid (GridTime).
- Before analyzing the videos examine the coding protocol in detail (Table 1) and consider whether adjustments are necessary for the species being tested.
- Statistical analysis
- Determine whether measures for apparatus-directed behaviors (LatencyGrid, GridTime, TasksTouched, BaitedContact, SolvedContact) are correlated.
- If yes, then extract the principal components using a Principal Component Analysis before including them in the model as predictors.
- If they are not correlated, include them separately in the model as predictors.
- Run a Generalized Linear Mixed Model with binomial error structure and logit link function36. To predict the probability of success (i.e., the response variable being SolvedTasks), fit the model with maximal random slope structure and include random intercepts for subject, task, a combined factor of subject and session (SessionID), and a combined factor of subject and task (Subj.Task) to avoid pseudo-replication. Use the comparison of interest (e.g., species) and the Principal Components as predictor variables and control for session. Consider possible interactions.
- To avoid cryptic multiple testing37 first compare the model with a model lacking all fixed effects of interest before testing individual predictors.
- To test for an overall difference of difficulty in tasks between groups, compare the (full) model with one lacking the random slope of group within task.
Results
Nineteen subjects were tested using the Innovation Arena: 11 long-term and 8 short-term captive cockatoos (Figure 4).
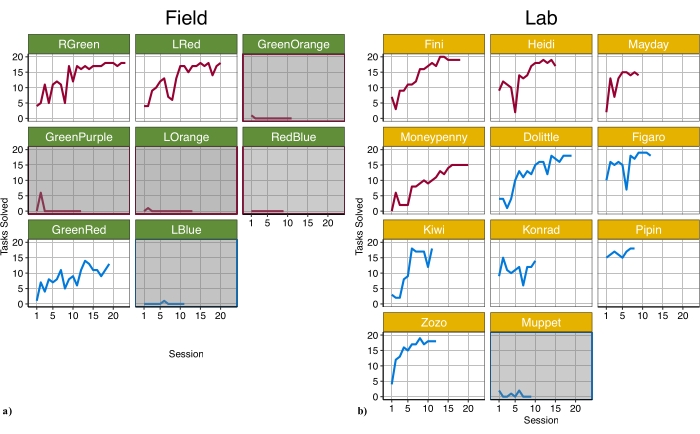
Figure 4: An overview of the number of tasks solved per session for each individual. a) Field group, b) Lab group. Red lines = female; blue lines = male. Subjects receiving the motivational protocol due to their reluctancy to interact with the apparatus were classified as not motivated and depicted with a gray background. Previously published in Supplementary Information of32. Please click here to view a larger version of this figure.
The Principal Component Analysis resulted in two components having Eigenvalues above Kaiser´s criterion38 (see Table 2 for PCA output). PC1 loaded on frequency of contacts with tasks, time spent in proximity (i.e., within the grid) of the tasks, and the number of tasks touched. PC2 was positively affected by the number of contacts with already solved tasks and negatively with the number of tasks touched, not solved. Such task-directed behaviors are frequently used for measuring motivation (see12 for a review). Therefore, we used PC1 and PC2 as quantitative measures for motivation to interact with the apparatus in our model. Together they explained 76.7% of the variance in apparatus-directed behaviors and both, as well as session, significantly influenced the probability to solve tasks (PC1: estimate = 2.713, SE ± 0.588, χ2 = 28.64, p < 0.001; PC2: estimate = 0.906, SE ± 0.315, χ2 = 9.106, p = 0.003; session: estimate = 1.719, SE ± 0.526, χ2 = 6.303, p = 0.001; see Figure 5; see Table 4).
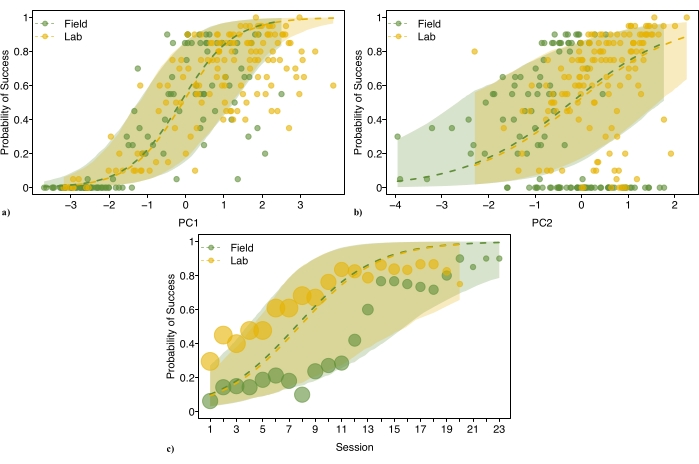
Figure 5: Influence of control predictors on the probability to solve: (a) PC1, (b) PC2, (c) Session. Points show observed data, area of points indicates the number of observations for each data point, dashed lines show fitted values of model and areas symbolize confidence intervals of model. Previously published in32. Please click here to view a larger version of this figure.
Six out of the 19 subjects received the motivational protocol during the experiment (Lab: 1 out of 11; Field: 5 out of 8). PC1 of these birds, which we categorized as not motivated, ranged between -2.934 to -2.2, while positive values were found for all other motivated individuals (Table 3).
With the presented method we found no difference of group on the probability to solve the 20 technical problem-solving tasks of the Innovation Arena (estimate = −0.089, SE ± 1.012, χ2 = 0.005, p = 0.945; Figure 5; see Table 4 for fixed effects estimates; all birds included).
A post-hoc comparison of the model with one including an interaction term of group with session (estimate = 2.924, SE ± 0.854, χ2 = 14.461, p < 0.001) suggests lower probability to solve in the field group in earlier sessions but not in the later. This difference in earlier sessions might be due to the high number of less/not motivated birds in group field (individuals for which testing stopped due to the rule of not solving any task in 10 consecutive sessions received between 10 and 13 sessions).
Further, we found no difference between the groups regarding the overall difficulty of tasks (comparison of full model with all birds included, with a reduced model lacking random slope of Group within Task: χ2 = 7.589, df = 5, p = 0.18). However, visual comparisons of birds that never required a motivational trial, hint to some differences in ability for single individual tasks (see, e.g., the Button task in Figure 6).
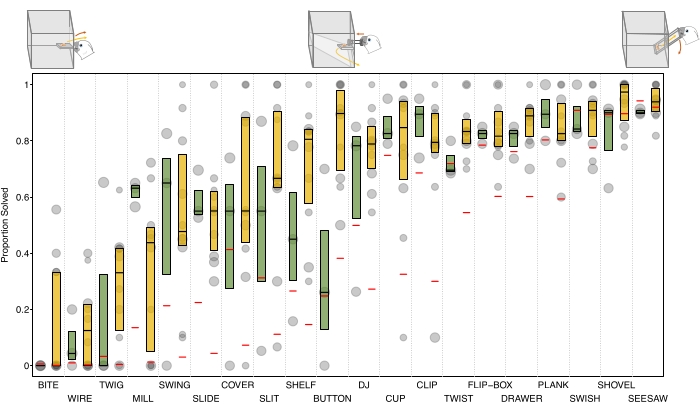
Figure 6: Observed data of motivated subjects and fitted values of model per task and group: Boxplots show the proportion of successes per task for both groups (green = Field; orange = Lab). Bold horizontal lines indicate median values, boxes span from the first to third quartiles for birds. Boxplots illustrate data from motivated birds only (to improve visual clarity). Individual observations are depicted by points (larger area indicates more observations per data point). Red horizontal lines show fitted values. Fitted values originate from the whole data set. Included are illustrations of Bite (bottom left), Button (top middle) and Seesaw (top right) tasks. Previously published in32. Please click here to view a larger version of this figure.
These results demonstrate the feasibility of the methodology for comparative research even if the animals have different experiences and ecological circumstances. A comparison of innovative problem-solving abilities using only a single task, such as the Button task, might have yielded a false conclusion that long-term captive birds are better problem-solvers. This difference could be explained by the lab population’s experience with stick insertion experiments while the motor action might not be as ecologically relevant for wild populations. Such differences could potentially be more pronounced when different species are compared (see19). We were further able to test how motivation affects problem-solving ability, while at the same time comparing the results of the two groups while controlling for motivation.
The 20 technical problems of the Innovation Arena can therefore be used to detect group differences on particular tasks, but also to estimate the overall innovative ability of groups. In the case of the Goffin`s cockatoo, both groups can, i.e., have the ability to, retrieve many rewards, if they want to, i.e., are motivated to interact with the apparatus.
Table 1: Protocol for coding behaviors: Detailed description of coded behavioral variables. Previously published in32. Please click here to download this Table.
Table 2: Principal component output: Factor loadings above 0.40 are printed in bold. Previously published in32. Please click here to download this Table.
Table 3: Details on subjects and values of task-directed behaviors and principal components: Superscripts if measure loads go above 0.40 per PC. Previously published in32. Please click here to download this Table.
Table 4: Fixed effects results of the model for probability to solve. Previously published in32. Please click here to download this Table.
Supplementary File: Technical drawing of the Innovation Arena (InnovationArena.3dm). Dimensions might deviate slightly. Can be loaded, e.g., in 3dviewer.net, which is a free and open source 3D model viewer39. Please click here to download this File.
Discussion
The Innovation Arena is a new protocol to test innovative, technical problem-solving. When designing the tasks of the Innovation Arena, we carefully considered that the tasks should be possible to solve given a range of species' morphological constraints (e.g., using beaks, snouts, paws, claws, or hands). To enable broader comparability between species already tested and species to be tested in the future, we encourage the use of these tasks, if feasible with the respective model. However, we are aware that some tasks might need to be adjusted to specific morphological limits of a species. Most importantly, the tasks need to be novel to the subjects, which may require new, alternative designs. One advantage of the Innovation Arena is that, due to the number of different tasks, comparisons will still be possible and informative even if some tasks need to be adjusted or changed in future studies.
While planning the study, it should be considered that the pre-testing phase (e.g., designing and constructing the apparatus) might require a considerable amount of time. Further, it is important to thoroughly habituate the subjects to the apparatus. Different groups can differ substantially in their explorative approach and neotic reactions40,41,42. The elimination (or reduction) of neophobic reactions will make comparisons more reliable and allow the role of motivation to be identified. To measure the individual emergence of innovations over time and to avoid social learning, it is crucial that subjects are tested repeatedly and individually, which may be challenging under field conditions. For many species, wild-caught subjects will need extensive time to habituate to the new environment, human presence, and interaction and to develop a working separation procedure. Furthermore, it might not be practically possible to strictly adhere the randomization schedule for each individual per session. While the long-term captive cockatoos in our study were trained to enter the test compartment when called by their individual name, we needed to be more opportunistic with regard to which individual enters the test room in the field. Aside from levels of motivation, we encountered another factor that could influence the results of a comparative study using the Innovation Arena. Due to feeding preferences and food availability, we used different reward types for the two groups, which increased the feeding times of wild cockatoos compared to the lab birds. We accounted for these differences by adding feeding duration (if it exceeded 3 s) to the total amount of time an individual was confronted with the arena. This protocol ensured that the time to interact with the arena was not reduced in one group due to feeding time. Future studies should consider this potential issue and might aim to implement this protocol already in the habituation phase.
The strength and novelty of this method includes the combination of a greater variety of tasks, simultaneous presentation of these tasks, multiple rewards per encounter with the apparatus, and repeated exposure to the apparatus for each subject.
Further, individuals are tested until they do not solve any new tasks. In contrast to a fixed number of sessions, this maximum (or asymptotic level) of solution discovery, together with the number of tasks solved per session, can be informative about the potential adaption of a group to a changing environment.
An example of an alternative method is the Multi Access Box (MAB), in which it is possible to solve a task through four different solutions but only one reward can be retrieved per encounter with the apparatus18 and thus the estimation of innovation rate over time is significantly limited. Moreover, difficulties with single tasks, which might be species-specific, can strongly influence the comparison of performances with respect to cognitive abilities. To our knowledge, the simultaneous presentation of tasks with motorically distinct solutions has been limited to a maximum of six tasks in previous studies (Federspiel, 6-way MAB on mynah birds, data so far unpublished). While the MAB is a very useful tool to uncover exploration techniques, we think the Innovation Arena is better suited for the comparison of the ability to innovate itself. A wider range of tasks, which also vary in difficulty, can be more informative about an overall technical problem-solving competence29.
In our first study, we successfully compared two groups of the same species, the Goffin´s cockatoo, which differed substantially in their experience. With this comparison, we specifically targeted the question of whether long-term captivity influences problem-solving abilities. Previous studies have suggested that a prolonged captive life style enhances those abilities (see30,43) but direct comparisons through controlled experimental approaches have been rare (but see44,45). By using the Innovation Arena, we were able to target this question and found no support for a captivity effect on the overall capacity of Goffins to find novel solutions, but rather an effect on a motivational level32.
Additionally, the Innovation Arena can be used to address questions focusing on different aspects of innovative problem-solving. Further steps could include investigations targeting the effects of divergence and convergence. For example, comparisons between closely-related species that differ in their ecologies (e.g., island species vs. non-island species), but also distantly-related species, such as a parrot and a corvid representative or avian and primate species that previously showed similar performances in individual physical problem solving46. The Innovation Arena was developed to compare many different species, even those that are distantly related.
That said, this method could very well also be used to investigate inter-individual differences. For example, one could use personality scores as predictors to estimate their influence on innovation rate. We believe the presented method can be used by research groups studying animal and human innovation, and/or collaboratively by labs that specialize in the study of different species.
Disclosures
The authors declare no conflicts of interest.
Acknowledgements
We thank Stefan Schierhuber and David Lang for their assistance in the production of this video, Christoph Rössler for his help with technical drawings, and Poppy Lambert for proofreading this manuscript. This publication was funded by the Austrian Science Fund (FWF; START project Y01309 awarded to A.A.). The presented research was funded by the Austrian Science Fund (FWF; projects P29075 and P29083 awarded to A.A. and project J 4169-B29 awarded to M.O.) as well as the Vienna Science and Technology Fund (WWTF; project CS18-023 awarded to A.A.). Moreover, this research was partially funded by the Austrian Science Fund (FWF) "DK Cognition and Communication 2": W1262-B29 [10.55776/W1262].
Materials
| Name | Company | Catalog Number | Comments |
|---|---|---|---|
| wooden platform | Dimensions: wooden semicircle, radius approx. 1.5m | ||
| FIXATION SYSTEM | |||
| 5 x metal nut | Dimensions: M8 | ||
| 5 x rod | (possibly with U-profile) | ||
| 5 x threaded rod | Dimensions: M8; length: 25cm | ||
| 5 x wing nut | Dimensions: M8 | ||
| PUZZLE BOXES WITHOUT FUNCTION PARTS | |||
| 20 x acrylic glass back | Dimensions: 17cm x 17.5cm x 0.5cm | ||
| 20 x acrylic glass base | 4 holes for screws roughly 2cm from each side Dimensions: trapezoid : 17.5cm (back) x 15cm (front) x 15cm (sides); 1cm thick | ||
| 20 x acrylic glass front | acrylic glass fronts need to be cut differently for each puzzle box (see drawing) Dimensions: 17cm x 15cm x 0.5cm | ||
| 20 x acrylic glass lid | cut out 0.5cm at the edges for better fit Dimensions: trapezoid shape: 18.5cm x 16cm x 16cm x 1cm (thick) | ||
| 40 x acrylic glass side | Dimensions: 17cm x 16cm x 0.5cm | ||
| 80 x small screw | to attach bases to the platform (4 screws per base) | ||
| PARTS FOR EACH MECHANSIM PER TASK | |||
| to assemble the parts use technical drawing InnovationArena.3dm | can be loaded e.g. in 3dviewer.net, which is a free and open source 3D model viewer. github repository: https://github.com/kovacsv/Online3DViewer; please contact authors if you are in need of a different format | ||
| TASK TWIST | |||
| 5x small nut | to attach glass (punch holes) and acrylic glass cube to threaded rod | ||
| acrylic glass | Dimensions: 2cm x 2cm x 1cm | ||
| cardboard slant | Dimensions: trapezoid: 17.5cm (back) x 15cm (front) x 17cm (sides) | ||
| plastic shot glass | Dimensions: height: 5cm; rim diameter: 4.5cm; base diameter: 3cm | ||
| thin threaded rod | Dimensions: length: approx. 10cm | ||
| TASK BUTTON | |||
| 2x nut | attach to rod; glue outer nut to rod Dimensions: M8 | ||
| acrylic glass | V-cut to facilitate sliding of rod Dimensions: 4cm x 3cm x 1cm (0.5cm V-cut in the middle) | ||
| cardboard slant | Dimensions: trapezoid: 17.5cm (back) x 15cm (front) x 17cm (sides) | ||
| threaded rod | Dimensions: M8, length: 5cm | ||
| TASK SHELF | |||
| acrylic glass top | Dimensions: 5cm x 4cm x 0.3cm | ||
| acrylic glass lower | Dimensions: 5cm x 4cm x 1cm | ||
| acrylic glass side 1 | Dimensions: 4cm x 3cm x 0.5cm | ||
| acrylic glass side 2 | Dimensions: 4.5cm x 3cm x 0.5cm | ||
| thin plastic bucket | one side cut off to fit Dimensions: diameter: approx. 4.5 cm; height: 1cm | ||
| cardboard slant | Dimensions: trapezoid: 17.5cm (back) x 15cm (front) x 17cm (sides) | ||
| TASK SLIT | room to reach in: 2cm in height | ||
| - | recommended: add small plastic barrier behind reward so it cannot be pushed further into the box | ||
| TASK CLIP | |||
| 2x acrylic glass | Dimensions: 1cm x 1cm x 2cm | ||
| cardboard slant | Dimensions: trapezoid: 17.5cm (back) x 15cm (front) x 17cm (sides) | ||
| peg | Dimensions: length: approx. 6 cm | ||
| thin threaded rod | Dimensions: length: approx. 6 cm | ||
| TASK MILL | |||
| 2x arylic glass triangle | Dimensions: 10cm x 7.5cm x 7.5cm; thickness: 1cm | ||
| 2x plastic disc | Dimensions: diameter: 12cm | ||
| 4x small nut | for attachment | ||
| 7x acrylic glass | Dimensions: 4.5cm x 2cm, 0.5cm | ||
| acrylic glass long | position the mill with longer acrylic glass touching lower half of the front (this way the mill can only turn in one direction) Dimensions: 6.5cm x 2cm, 0.5cm | ||
| thin threaded rod | Dimensions: length: approx. 4cm | ||
| wooden cylinder | Dimensions: diameter: 2cm | ||
| TASK SWISH | |||
| 2x acrylic glass | Dimensions: 2cm x 1cm x 1cm | ||
| 4x small nut | for attachment | ||
| acrylic glass | Dimensions: 10cm x 2cm x 1cm | ||
| cardboard slant | Dimensions: trapezoid: 17.5cm (back) x 15cm (front) x 17cm (sides) | ||
| thin threaded rod | Dimensions: length: approx. 7cm | ||
| wooden cylinder | Dimensions: diameter: 2cm, cut-off slantwise; longest part: 7cm, shortest part: 5cm | ||
| TASK SHOVEL | |||
| acrylic glass | Dimensions: 20cm x 2cm x 1cm | ||
| acrylic glass | Dimensions: 7.5cm x 2cm x 1cm | ||
| acrylic glass | Dimensions: 5cm x 1cm x 1cm | ||
| small hinge | |||
| TASK SWING | |||
| 4x nut | Dimensions: M8 | ||
| acrylic glass | Dimensions: 7.5cm x 5cm x 1cm | ||
| cardboard slant | Dimensions: trapezoid: 17.5cm (back) x 15cm (front) x 17cm (sides) | ||
| cord strings | Dimensions: 2x approx. 11cm | ||
| thin bent plastic | bucket to hold reward; positioned on slant | ||
| threaded rod | Dimensions: M8; length: 7cm | ||
| TASK SEESAW | |||
| 2x acrylic glass | Dimensions: 10cm x 1.5cm x 0.5cm | ||
| 2x acrylic glass | Dimensions: 4cm x 1.5cm x 0.5cm | ||
| acrylic glass | Dimensions: 10cm x 3cm x 0.5cm | ||
| acrylic glass | Dimensions: 4cm x 1.5cm x 1cm | ||
| small hinge | |||
| TASK PLANK | |||
| cardboard slant | Dimensions: trapezoid: 17.5cm (back) x 15cm (front) x 17cm (sides) | ||
| thin tin | bent approx. 1cm inside box Dimensions: 6.5cm x 3cm | ||
| TASK CUP | |||
| plastic shot glass | Dimensions: height: 5cm; rim diameter: 4.5; base diameter: 3cm | ||
| TASK FLIP-BOX | |||
| 2x acrylic glass triangle | Dimensions: 7cm x 5cm x 5cm; thickness: 0.5cm | ||
| 2x acrylic glass | Dimensions: 4.5cm x 5cm x 0.5cm | ||
| 2x acrylic glass | Dimensions: 7cm x 1cm x 1cm | ||
| small hinge | |||
| TASK SLIDE | |||
| 4x acrylic glass | Dimensions: 15cm x 1cm x 0.5cm | ||
| acrylic glass door | Dimensions: 6cm x 6cm x 0.5cm | ||
| TASK DJ | |||
| 2x small nut | for attachment | ||
| acrylic glass | same as box bases Dimensions: trapezoid : 17.5cm (back) x 15cm (front) x 15cm (sides); 1cm thick | ||
| plastic disc | Dimensions: diameter 12cm | ||
| thin threaded rod | Dimensions: length: approx. 3cm | ||
| TASK WIRE | |||
| acrylic glass | Dimensions: 9.5cm x 9.5cm x 0.5cm | ||
| acrylic glass | Dimensions: 12cm x 2cm x 1cm | ||
| 2x small hinge | |||
| wire from a paperclip | |||
| TASK TWIG | |||
| 2x small hinge | |||
| acrylic glass | Dimensions: 5cm x 1cm | ||
| cardboard slant | Dimensions: trapezoid: 17.5cm (back) x 15cm (front) x 17cm (sides) | ||
| white cardboard | Dimensions: 13cm x 4cm | ||
| Y-shaped twig | Dimensions: length: approx. 14cm | ||
| TASK COVER | |||
| acrylic glass | same as box bases Dimensions: trapezoid : 17.5cm (back) x 15cm (front) x 15cm (sides); 1cm thick | ||
| thin plastic | Dimensions: diameter: 5cm | ||
| TASK BITE | recommended: put tape on sides of platform the keep reward from falling off | ||
| 2-3 paper clips | |||
| 2x cutout from clipboard | Dimensions: 10cm x 3cm | ||
| acrylic glass | hole in middle Dimensions: 5cm x 3cm x 1cm | ||
| toilet paper | |||
| TASK DRAWER | |||
| 2x acrylic glass | Dimensions: 5cm x 2.5cm x 0.5cm | ||
| 2x acrylic glass | Dimensions: 4cm x 3cm x 1cm | ||
| acrylic glass | hole approx. 2 cm from front Dimensions: 5cm x 5cm x 1cm | ||
| OTHER MATERIAL | |||
| wide-angle videocamera |
References
- Fisher, J. The opening of milkbottles by birds. British Birds. 42, 347-357 (1949).
- Kummer, H., Goodall, J. Conditions of innovative behaviour in primates. Philosophical Transactions of the Royal Society of London. B, Biological Sciences. 308 (1135), 203-214 (1985).
- Tebbich, S., Griffin, A. S., Peschl, M. F., Sterelny, K. From mechanisms to function: an integrated framework of animal innovation. Philosophical Transactions of the Royal Society B: Biological Sciences. 371 (1690), 20150195(2016).
- Reader, S. M., Laland, K. N. Social intelligence, innovation, and enhanced brain size in primates. Proceedings of the National Academy of Sciences. 99 (7), 4436-4441 (2002).
- Reader, S. M., Laland, K. N. Primate innovation: Sex, age and social rank differences. International Journal of Primatology. 22 (5), 787-805 (2001).
- Lefebvre, L., Whittle, P., Lascaris, E., Finkelstein, A. Feeding innovations and forebrain size in birds. Animal Behaviour. 53 (3), 549-560 (1997).
- Lefebvre, L., et al. Feeding innovations and forebrain size in Australasian birds. Behaviour. 135 (8), 1077-1097 (1998).
- Timmermans, S., Lefebvre, L., Boire, D., Basu, P. Relative size of the hyperstriatum ventrale is the best predictor of feeding innovation rate in birds. Brain, Behavior and Evolution. 56 (4), 196-203 (2000).
- Ducatez, S., Clavel, J., Lefebvre, L. Ecological generalism and behavioural innovation in birds: technical intelligence or the simple incorporation of new foods. Journal of Animal Ecology. 84 (1), 79-89 (2015).
- Sol, D., Lefebvre, L., Rodríguez-Teijeiro, J. D. Brain size, innovative propensity and migratory behaviour in temperate Palaearctic birds. Proceedings of the Royal Society B: Biological Sciences. 272 (1571), 1433-1441 (2005).
- Sol, D., Sayol, F., Ducatez, S., Lefebvre, L. The life-history basis of behavioural innovations. Philosophical Transactions of the Royal Society B: Biological Sciences. 371 (1690), 20150187(2016).
- Griffin, A. S., Guez, D. Innovation and problem solving: A review of common mechanisms. Behavioural Processes. 109, Pt. B 121-134 (2014).
- Laumer, I. B., Bugnyar, T., Reber, S. A., Auersperg, A. M. I. Can hook-bending be let off the hook? Bending/unbending of pliant tools by cockatoos. Proceedings of the Royal Society B. Biological Sciences. 284 (1862), 20171026(2017).
- Rutz, C., Sugasawa, S., Vander Wal, J. E. M., Klump, B. C., St Clair, J. J. H. Tool bending in New Caledonian crows. Royal Society Open Science. 3 (8), 160439(2016).
- Weir, A. A. S., Kacelnik, A. A New Caledonian crow (Corvus moneduloides) creatively re-designs tools by bending or unbending aluminium strips. Animal Cognition. 9 (4), 317-334 (2006).
- Herrmann, E., Hare, B., Call, J., Tomasello, M. Differences in the cognitive skills of bonobos and chimpanzees. PloS One. 5 (8), 12438(2010).
- Herrmann, E., Call, J., Hernández-Lloreda, M. V., Hare, B., Tomasello, M. Humans have evolved specialized skills of social cognition: The cultural intelligence hypothesis. Science. 317 (5843), 1360-1366 (2007).
- Auersperg, A. M. I., Gajdon, G. K., von Bayern, A. M. P. A new approach to comparing problem solving, flexibility and innovation. Communicative & Integrative Biology. 5 (2), 140-145 (2012).
- Auersperg, A. M. I., von Bayern, A. M. P., Gajdon, G. K., Huber, L., Kacelnik, A. Flexibility in problem solving and tool use of Kea and New Caledonian crows in a multi access box paradigm. PLoS One. 6 (6), 20231(2011).
- Daniels, S. E., Fanelli, R. E., Gilbert, A., Benson-Amram, S. Behavioral flexibility of a generalist carnivore. Animal Cognition. 22 (3), 387-396 (2019).
- Johnson-Ulrich, L., Holekamp, K. E., Hambrick, D. Z. Innovative problem-solving in wild hyenas is reliable across time and contexts. Scientific Reports. 10 (1), 13000(2020).
- Johnson-Ulrich, L., Johnson-Ulrich, Z., Holekamp, K. Proactive behavior, but not inhibitory control, predicts repeated innovation by spotted hyenas tested with a multi-access box. Animal Cognition. 21 (3), 379-392 (2018).
- Williams, D. M., Wu, C., Blumstein, D. T. Social position indirectly influences the traits yellow-bellied marmots use to solve problems. Animal Cognition. 24 (4), 829-842 (2021).
- Cooke, A. C., Davidson, G. L., van Oers, K., Quinn, J. L. Motivation, accuracy and positive feedback through experience explain innovative problem solving and its repeatability. Animal Behaviour. 174, 249-261 (2021).
- Huebner, F., Fichtel, C. Innovation and behavioral flexibility in wild redfronted lemurs (Eulemur rufifrons). Animal Cognition. 18 (3), 777-787 (2015).
- Godinho, L., Marinho, Y., Bezerra, B. Performance of blue-fronted amazon parrots (Amazona aestiva) when solving the pebbles-and-seeds and multi-access-box paradigms: ex situ and in situ experiments. Animal Cognition. 23 (3), 455-464 (2020).
- Bouchard, J., Goodyer, W., Lefebvre, L. Social learning and innovation are positively correlated in pigeons (Columba livia). Animal Cognition. 10 (2), 259-266 (2007).
- Griffin, A. S., Diquelou, M., Perea, M. Innovative problem solving in birds: a key role of motor diversity. Animal Behaviour. 92, 221-227 (2014).
- Webster, S. J., Lefebvre, L. Problem solving and neophobia in a columbiform-passeriform assemblage in Barbados. Animal Behaviour. 62 (1), 23-32 (2001).
- Haslam, M. 34;Captivity bias" in animal tool use and its implications for the evolution of hominin technology. Philosophical Transactions of the Royal Society B: Biological Sciences. 368 (1630), 20120421(2013).
- Lambert, M. L., Jacobs, I., Osvath, M., von Bayern, A. M. P. Birds of a feather? Parrot and corvid cognition compared. Behaviour. , 1-90 (2018).
- Rössler, T., et al. Using an Innovation Arena to compare wild-caught and laboratory Goffin´s cockatoos. Scientific Reports. 10 (1), 8681(2020).
- Laumer, I. B., Bugnyar, T., Auersperg, A. M. I. Flexible decision-making relative to reward quality and tool functionality in Goffin cockatoos (Cacatua goffiniana). Scientific Reports. 6, 28380(2016).
- Friard, O., Gamba, M. BORIS: a free, versatile open-source event-logging software for video/audio coding and live observations. Methods in Ecology and Evolution. 7 (11), 1325-1330 (2016).
- R. Core Team. R: A language and environment for statistical computing. R Foundation for Statistical Computing. , (2020).
- McCullagh, P., Nelder, J. A. Generalized linear models. Monographs on Statistics and Applied Probability. , (1989).
- Forstmeier, W., Schielzeth, H. Cryptic multiple hypotheses testing in linear models: overestimated effect sizes and the winner's curse. Behavioral Ecology and Sociobiology. 65 (1), 47-55 (2011).
- Kaiser, H. F. The application of electronic computers to factor analysis. Educational and Psychological Measurement. 20 (1), 141-151 (1960).
- Kovacs, V. Online 3D Viewer. , Available from: https://github.com/lovacsv/Online3DViewer (2021).
- Greenberg, R. S., Mettke-Hofmann, C. Ecological aspects of neophobia and neophilia in birds. Current Ornithology. 16, 119-169 (2001).
- Mettke-Hofmann, C., Winkler, H., Leisler, B. The Significance of Ecological Factors for Exploration and Neophobia in Parrots. Ethology. 108 (3), 249-272 (2002).
- O'Hara, M., et al. The temporal dependence of exploration on neotic style in birds. Scientific Reports. 7 (1), 4742(2017).
- Chevalier-Skolnikoff, S., Liska, J. O. Tool use by wild and captive elephants. Animal Behaviour. 46 (2), 209-219 (1993).
- Benson-Amram, S., Weldele, M. L., Holekamp, K. E. A comparison of innovative problem-solving abilities between wild and captive spotted hyaenas, Crocuta crocuta. Animal Behaviour. 85 (2), 349-356 (2013).
- Gajdon, G. K., Fijn, N., Huber, L. Testing social learning in a wild mountain parrot, the kea (Nestor notabilis). Animal Learning and Behavior. 32 (1), 62-71 (2004).
- Shettleworth, S. J. Cognition, Evolution, and Behavior. , Oxford University Press. (2009).
Reprints and Permissions
