

Summary
Recycling endosomes are part of the endosomal tubular network. Here we present a method to quantify the dynamics of recycling endosomes using GFP-STX13 as an organelle marker.
Abstract
Recycling endosomes (REs) are tubular-vesicular organelles generated from early/sorting endosomes in all cell types. These organelles play a key role in the biogenesis of melanosomes, a lysosome-related organelle produced by melanocytes. REs deliver the melanocyte-specific cargo to premature melanosomes during their formation. Blockage in the generation of REs, observed in several mutants of Hermansky-Pudlak syndrome, results in hypopigmentation of skin, hair, and eye. Therefore, studying the dynamics (refer to number and length) of REs is useful to understand the function of these organelles in normal and disease conditions. In this study, we aim to measure the RE dynamics using a resident SNARE STX13.
Introduction
Biosynthesis of melanin pigments occurs in melanosomes, a melanocyte-specific lysosome-related organelle (LRO) that co-exists with conventional lysosomes. The endocytic system plays a key role in the biogenesis of melanosomes, required for skin color and photoprotection against ionizing radiation1,2,3. During this process, the melanin synthesizing enzymes are sorted on early/sorting endosomes and then transported to premature melanosomes through tubular or vesicular endosomes called recycling endosomes (REs)4,5,6,7,8,9,10. The targeting and fusion of these organelles regulate the maturation of fully functional pigmented melanosomes7,11,12,13,14. Defects in the formation of these organelles or cargo sorting to these organelles cause oculocutaneous albinism and other clinical phenotypes, observed in Hermansky-Pudlak syndrome15,16.
Here we describe a simple microscopy-based technique to study and analyze the REs. In this method, we have taken advantage of a transmembrane protein, Qa-SNARE Syntaxin (STX)13 that resides on recycling endosomes17 and cycles between sorting endosomes and melanosomes in melanocytes12,18. Further, deletion of N-terminal unstructured regulatory domain (namely SynN or STX13Δ129) allows the SNARE to get stuck in melanosomes, which measures the forward trafficking pathway towards the melanosome12. We have used a known recycling endosomal marker Rab GTPase (Rab)11 in our studies14,19. Fluorescence imaging of the proteins GFP-STX13WT, GFP-STX13Δ129, mCherry-Rab11, and TYRP1 in wild type melanocytes followed by quantification of their relative localization will provide the nature and dynamics of REs in addition to their targeting to melanosomes. Thus, this is a simple technique that can be used to visualize and measure the dynamics of REs in melanocytes.
Subscription Required. Please recommend JoVE to your librarian.
Protocol
The protocol involves the seeding of melanocytes followed by transfection of the plasmids. Further steps include fixation, immunostaining, imaging, and analysis of the cells to measure the length and number of REs. The detailed description of the protocol is given below.
1. Seeding of mouse melanocytes on pre-treated coverslips
- Coat the glass coverslips in a Petri dish (i.e., 4 - 5 in a 35 mm dish) with basement membrane matrix medium (1:20 in complete RPMI medium: RPMI + 10% heat inactivated FBS + 1x Glutamine + 1x Antibiotic mix) and dry it in the tissue culture hood for 15 min. Wash the coverslips once with 1x PBS before use.
- Maintain the wild type mouse melanocytes (melan-Ink4a-Arf-1 from C57BL/6J, a/a, Ink4a-Arf-/- mice, described in20 and available at The Welcome Trust Functional Genomics Cell Bank) in a Petri dish (i.e., 35 or 60 mm dish) supplemented with complete RPMI medium.
- Wash the cells twice with 1x PBS and add 0.5 or 1 mL of Trypsin-EDTA (0.25%) solution for trypsinizing cells. Incubate the cells at 37 °C for 2 - 5 min for the detachment from the Petri dish.
- Add 1 - 2 mL of complete RPMI medium, suspend and then transfer the cells to a centrifuge tube.
- Centrifuge the cell suspension at 4 °C, 376 x g for 5 min and then resuspend the pellet in 1x PBS.
- Repeat the centrifugation step and resuspend the cells in 1 mL of complete RPMI medium.
- Seed the cells on the basement membrane medium-coated coverslips at 50-60% confluency (approximately 6 x 10⁵ cells on a 35 mm cell culture dish containing 4 - 5 coverslips). Always add 200 nM of PMA (add 5 µL of working stock 40 µM phorbol 12-myristate 13-acetate) to the plated cell suspension in complete RPMI medium.
- After seeding, incubate the plate at 37 °C for 12- 24 h.
2. Transfection of cells with the STX13 plasmids
- Use the following reagents: pEGFP-C1-STX13WT and pEGFP-C1-STX13Δ129 (described in12). mCherry-Rab11, was a kind gift from Graça Raposo, Institut Curie, Paris (described in reference19). Anti-TYRP1 antibody from ATCC (TA99).
- After 12 - 24 h of seeding, transfect the cells with plasmids using a lipid-based transfection reagent. For a 35 mm dish, take 5 µL of the transfection reagent in 250 µL of OPTI-MEM medium in a microcentrifuge tube and take approximately 200 ng of each plasmid in 250 µL of OPTI-MEM.
- Incubate the tubes containing DNA and the transfection reagent for 5 min. Mix without repeated pipetting (total volume will be about 500 µL). Incubate for 30 min at room temperature. Perform hand tapping of the tube every 10 min for 30 min at RT.
- During the incubation, wash the cells twice with 1x PBS, once with OPTI-MEM and then add 1 mL of OPTI-MEM to the cells.
- Post 30 min of incubation, add the transfection reagent-DNA mix to the cells in a dropwise manner by covering the dish.
- Incubate the cells at 37 °C for 6 h. Aspirate the OPTI-MEM medium with transfection reagent and add complete RPMI medium supplemented with 200 nM of PMA.
- Incubate the cells at 37 °C for 48 h.
3. Fixation of the cells
NOTE: The following procedure is performed outside the tissue culture hood.
- After 48 h of transfection, wash the cells twice with 1x PBS and then fix the cells with 3% formaldehyde (freshly prepared in 1x PBS) for 30 min.
- After fixation, wash the cells twice with 1x PBS and store the coverslips in 1x PBS until further use. Alternatively, cells can be mounted on glass slides (see below) or stored at 4 °C.
4. Immunostaining of the cells
- Prepare a humid chamber: place paraffin film cut piece on moist filter paper in a Petri dish, covered with aluminum foil.
- Prepare 25 µL of primary antibody solution (0.2% saponin in 1x PBS, 0.1% BSA in 1x PBS and 0.02% Sodium azide in 1x PBS). Add antibody at a dilution of 1:200. Add this solution as a drop on a paraffin film in the humid chamber.
- Carefully lift the coverslip with forceps, invert it on this drop of primary antibody staining solution and then cover the lid of the humid chamber. Incubate at room temperature for 30 min.
- Similarly, prepare the secondary antibody solution at a dilution of 1:500 and place it on paraffin film next to the coverslip in the humid chamber. For staining the nucleus, add DAPI (1:20,000 to 1:30,000) to the solution.
- Using forceps, carefully pick up the coverslip from the primary antibody solution and dip it thrice in 1x PBS (in a glass beaker).
- Tap the coverslip on tissue paper to remove the excess PBS on the coverslip. Place it on secondary antibody staining solution in the humid chamber and do not expose it to light due to the presence of fluorescently tagged antibodies in the solution.
- Incubate the coverslip again for 30 min at room temperature. Please always keep a note the side of the coverslip that has the cells throughout these steps.
- After the incubation, carefully pick up the coverslip from the secondary antibody solution and then dip it thrice in 1x PBS. Further, tap the coverslip on tissue paper to remove the excess PBS on the coverslip.
- Place 12 µL of Fluoromount-G mounting reagent onto a glass slide and carefully place the stained coverslip (facing towards the glass) on the mounting reagent. Invert the glass slide on tissue paper and then gently press.
5. Fluorescence microscopy of the cells
- Image the stained cells under Bright-field (BF) and fluorescence (IF) filters using an inverted fluorescence microscope equipped with a CCD camera using 60x (oil) apochromatic objective or any other microscope with a similar configuration.
6. Quantification of overlap between the RE localized proteins and melanosomes:
NOTE: The following steps are followed for the quantification of Mander's overlap coefficient between the proteins using Fiji software (freely downloadable from the link: https://imagej.net/software/fiji/). Use the TIFF image with multiple channels.
- Open the raw image. Go to the Image option, select Color | Split channels, and use the two channels for analysis.
- Open the JACoP plugin in the Plugin option.
- Set the threshold for both the channels such that all the bright spots are selected and the background is eliminated.
- Go to Analysis option, select M1 and M2 coefficients for getting Mander's overlap coefficient.
- Press the Analyze option in the JACoP Plugin and see the result that displays Mander's overlap coefficient.
7. Quantification of recycling endosomes' tubular number and length:
NOTE: The following steps are followed for the quantification of the number and length of the tubules using Fiji software.
- Open the raw image Go to Image option, select Color | Split channels and use the desired channel for analysis.
- Go to Image again, select Type | Convert to 8-bit image.
- Then go to Plugins, select Analyze | Tubeness. Set sigma value at 0.1075 . Press Ok.
- Go to Image again, select Type | Convert to 8 bit image.
- Go to Image | Adjust | Threshold (Use the same threshold values for all the images. Images should have approximately equal intensity).
- Go to Process | Binary | Convert to mask.
- Go to Process, select Binary and then select Skeletonize.
- Go to Analyze, select Skeleton and choose Analyze Skeleton. In result and output | select (a) Calculate the largest shortest path | (b) show detailed information | (c) display labeled skeleton. Press Ok.
NOTE: The result will open in the tabulated format. The column of Average branch length shows the length of all the different tubules in the cell that is selected (set scale for getting values in micrometres). - For obtaining the number of tubules in the cell, go to Analyze, and select Analyze particle option. Press Ok.
NOTE: In the obtained results, the count column shows the number of tubules in that particular cell. - Save the data and analyze.
Subscription Required. Please recommend JoVE to your librarian.
Representative Results
Quantification of STX13Δ129 mutant localization to the melanosomes
Immunofluorescence microscopy of STX13 in mouse wild type melanocytes showed GFP-STX13WT localized as vesicular and tubular structures and GFP-STX13Δ129 localized as ring-like structures in addition to the cell surface (Figure 1A). Further, intracellular ring-like GFP-STX13Δ129 showed colocalization with the melanosome protein TYRP1 (Figure 1A) and bright-field imaged melanosomes (data not shown)12. As shown before, a cohort of overexpressed GFP-STX13WT is observed in melanosomes12. To measure the relative localization of GFP-STX13WT and GFP-STX13Δ129 to melanosomes, we have used Fiji and analyzed with JACoP plugin. The measured Mander's overlap coefficient (MOC) between GFP-STX13Δ129 with TYRP1 is approximately 1.5 folds higher compared to GFP-STX13WT with TYRP1 (Figure 1B). Interestingly, TYRP1 showed 2.9 folds higher MOC values with GFP-STX13Δ129 compared to GFP-STX13WT (Figure 1B). These data indicate that the localization of GFP-STX13Δ129 to melanosomes is relatively higher compared to GFP-STX13WT at a steady state.
Quantification of STX13WT localization to the recycling endosomes
Immunofluorescence microscopy of GFP-STX13WT showed colocalization with known recycling endosomal protein Rab11 (expressed as mCherry-Rab11) (Figure 2A,B). The measured MOC between GFP-STX13WT with mCherry-Rab11 is approximately 1.4 folds higher compared to mCherry-Rab11 with GFP-STX13WT (Figure 2B). To measure the number and length of GFP-STX13WT-positive endosomal tubules, we have used Fiji software as described in the protocol section. mCherry-Rab11 is used as a positive control in the experiments (Figure 2). Melanocytes transfected with GFP-STX13WT showed a higher number of tubules per cell compared to cells expressing mCherry-Rab11 (Figure 2C top graph, compare bar A with bar B). However, the tubule numbers are reduced upon co-expression of GFP-STX13WT and mCherry-Rab11 in the cells (Figure 2C top graph, compare bar A with C, and bar B with D). Interestingly, the average tubule length (μm) for both GFP-STX13WT and mCherry-Rab11 is comparable to each other in cells expressing individually or together (Figure 2C bottom graph). Together, these data suggest that GFP-STX13WT localizes to REs as similar to Rab11.
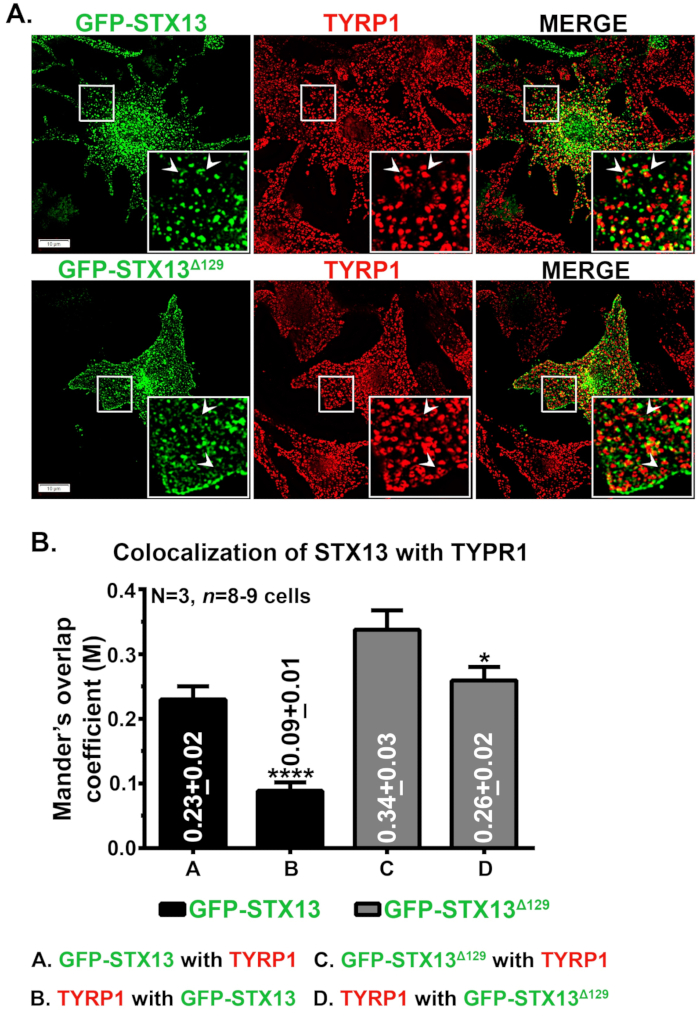
Figure 1: Localization of GFP-STX13WT and GFP-STX13Δ129 to melanosomes in wild type melanocytes. (A) Melan-Ink4a-Arf-1 melanocytes were transfected with GFP-STX13WT and GFP-STX13Δ129. Cells were fixed, stained with anti-TYRP1 antibody and then analyzed by fluorescence microscopy. Insets are magnified view of the white boxed areas. Arrows point to the localization of GFP-STX13WTto REs and GFP-STX13Δ129 to melanosomes. Scale bars, 10 μm. (B) Quantification of colocalization between STX13 and TYRP1. Mander's overlap coefficient (M) between GFP-STX13WT or GFP-STX13Δ129 with TYRP1 and vice versa is represented (mean ± S.E.M.) separately in the plot. N=3. *p ≤0.05 and ****p ≤0.0001. Please click here to view a larger version of this figure.

Figure 2: Localization of GFP-STX13WT to recycling endosomes in wild type melanocytes. (A) Melan-Ink4a-Arf-1 melanocytes were transfected with GFP-STX13WT and mCherry-Rab11. Cells were fixed and analyzed by fluorescence microscopy. Insets are magnified view of the white boxed areas. Arrows point to the localization of GFP-STX13WT to mCherry-Rab11-positive compartments. Scale bars, 10 μm. (B) Quantification of colocalization between STX13 and Rab11. Mander's overlap coefficient (M) between GFP-STX13WT with mCherry-Rab11 and vice versa is represented (mean ± S.E.M.) separately in the plot. N=3. ***p ≤0.001. C. Quantification of number and length (in μm) of STX13- or Rab11-positive REs. The average number of tubules/cell and average tubule length of GFP-STX13WT and mCherry-Rab11 are represented (mean ± S.E.M.) separately in the plot. N=3. Note that the cells are transfected with GFP-STX13WT and mCherry-Rab11 in (C) and (D). Please click here to view a larger version of this figure.
Subscription Required. Please recommend JoVE to your librarian.
Discussion
Recycling endosomes are a cohort of endocytic organelles, and they mediate the recycling of cargo to the cell surface in all cell types21,22,23,24,25. In specialized cell types such as melanocytes, these organelles partly divert their trafficking route towards the melanosomes for their biogenesis3,16,26. Further, REs are generated post cargo sorting on early/sorting endosomes and morphologically appear as tubular-vesicular structures. Their dynamics (number and length) are dependent on several cellular factors, including motor proteins21,22,23,24,25,27,28. Few studies used Rab11 as a marker to label the REs in melanocytes14,19. Whereas in non-melanocytes, STX13 and KIF13A have been used in addition to Rab11 to visualize and characterize REs13,17,19. In this study, we have used STX13 as a marker to label the REs in melanocytes followed by a comparison with Rab11-positive tubules (Figure 2). Interestingly, N-terminal deletion in STX13 (GFP-STX13Δ129) results in mislocalization of the SNARE to melanosomes (Figure 1). Thus, the localization of GFP-STX13WT and GFP-STX13Δ129 in melanocytes visualize the REs and melanosomes, respectively. These proteins can be used as respective organelles markers for the steady-state localization studies.
Studies have shown that several proteins such as TYRP1, TYR (tyrosinase), VAMP7, OCA2, Rab32/38 localize to the melanosomes in addition to other intracellular organelles3,29. Our studies showed that the N-terminal deleted STX13 mutant (GFP-STX13Δ129) localizes to melanosomes and plasma membrane. We hypothesize that GFP-STX13Δ129 can possibly be used as a reporter to study the trafficking from REs to the cell surface and LRO. In contrast, GFP-STX13WT localizes to REs as similar to Rab11. Our studies illustrated that GFP-STX13WT could also be used for marking REs in melanocytes. We predict that GFP-STX13WT may be a better RE marker than Rab11 since Rab11 overexpression alters the endosomal dynamics. Altogether, GFP-STX13WT acts as a potential RE marker to study their dynamics at steady-state condition.
Subscription Required. Please recommend JoVE to your librarian.
Disclosures
The authors declare that they have no conflict of interest.
Acknowledgments
This work was supported by the Department of Biotechnology (BT/PR32489/BRB/10/1786/2019 to SRGS); Science and Engineering Research Board (CRG/2019/000281 to SRGS); DBT-NBACD (BT/HRD-NBA-NWB/38/2019-20 to SRGS) and IISc-DBT partnership program (to SRGS). Infrastructure in the department was supported by DST-FIST, DBT, and UGC. AMB was supported by DBT-JRF (DBT/2015/IISc/NJ-02).
Materials
| Name | Company | Catalog Number | Comments |
| anti-TYRP1 antibody (TA99) | ATCC | HB-8704 | |
| Fluoromount-G | Southern Biotech | 0100-01 | |
| Lipofectamine 2000 | ThermoFisher Scientific | 11668-500 | |
| Matrigel matrix | BD Biosciences | 356231 | |
| OPTI-MEM | ThermoFisher Scientific | 022600-050 | |
| Phorbol 12-myristate 13-acetate | Sigma-Aldrich | P8139 | |
| RPMI Medium 1640 | ThermoFisher Scientific | 31800-022 |
References
- Dell'Angelica, E. C. The building BLOC(k)s of lysosomes and related organelles. Current Opinion in Cell Biology. 16 (4), 458-464 (2004).
- Raposo, G., Marks, M. S. Melanosomes--dark organelles enlighten endosomal membrane transport. Nature Reviews in Molecular Cell Biology. 8 (10), 786-797 (2007).
- Ohbayashi, N., Fukuda, M. Recent advances in understanding the molecular basis of melanogenesis in melanocytes. F1000Research. 9, F1000 Faculty Rev-608 (2020).
- Theos, A. C., et al. Functions of adaptor protein (AP)-3 and AP-1 in tyrosinase sorting from endosomes to melanosomes. Molecular Biology of the Cell. 16 (11), 5356-5372 (2005).
- Di Pietro, S. M., et al. BLOC-1 interacts with BLOC-2 and the AP-3 complex to facilitate protein trafficking on endosomes. Molecular Biology of the Cell. 17 (9), 4027-4038 (2006).
- Setty, S. R., et al. BLOC-1 is required for cargo-specific sorting from vacuolar early endosomes toward lysosome-related organelles. Molecular Biology of the Cell. 18 (3), 768-780 (2007).
- Delevoye, C., et al. AP-1 and KIF13A coordinate endosomal sorting and positioning during melanosome biogenesis. Journal of Cell Biology. 187 (2), 247-264 (2009).
- Bultema, J. J., Ambrosio, A. L., Burek, C. L., Di Pietro, S. M. BLOC-2, AP-3, and AP-1 proteins function in concert with Rab38 and Rab32 proteins to mediate protein trafficking to lysosome-related organelles. Journal of Biological Chemistry. 287 (23), 19550-19563 (2012).
- Sitaram, A., et al. Differential recognition of a dileucine-based sorting signal by AP-1 and AP-3 reveals a requirement for both BLOC-1 and AP-3 in delivery of OCA2 to melanosomes. Molecular Biology of the Cell. 23 (16), 3178-3192 (2012).
- Nag, S., et al. Rab4A organizes endosomal domains for sorting cargo to lysosome-related organelles. Journal of Cell Science. 131 (18), (2018).
- Dennis, M. K., et al. BLOC-2 targets recycling endosomal tubules to melanosomes for cargo delivery. Journal of Cell Biology. 209 (4), 563-577 (2015).
- Jani, R. A., Purushothaman, L. K., Rani, S., Bergam, P., Setty, S. R. STX13 regulates cargo delivery from recycling endosomes during melanosome biogenesis. Journal Cell Science. 128 (17), 3263-3276 (2015).
- Shakya, S., et al. Rab22A recruits BLOC-1 and BLOC-2 to promote the biogenesis of recycling endosomes. EMBO Reports. 19 (12), 45918 (2018).
- Bowman, S. L., et al. A BLOC-1-AP-3 super-complex sorts a cis-SNARE complex into endosome-derived tubular transport carriers. Journal of Cell Biology. 220 (7), 202005173 (2021).
- Wei, M. L. Hermansky-Pudlak syndrome: a disease of protein trafficking and organelle function. Pigment Cell Research. 19 (1), 19-42 (2006).
- Bowman, S. L., Bi-Karchin, J., Le, L., Marks, M. S. The road to lysosome-related organelles: Insights from Hermansky-Pudlak syndrome and other rare diseases. Traffic. 20 (6), 404-435 (2019).
- Prekeris, R., Klumperman, J., Chen, Y. A., Scheller, R. H. Syntaxin 13 mediates cycling of plasma membrane proteins via tubulovesicular recycling endosomes. Journal of Cell Biology. 143 (4), 957-971 (1998).
- Mahanty, S., et al. Rab9A is required for delivery of cargo from recycling endosomes to melanosomes. Pigment Cell Melanoma Research. 29 (1), 43-59 (2016).
- Delevoye, C., et al. Recycling endosome tubule morphogenesis from sorting endosomes requires the kinesin motor KIF13A. Cell Reports. 6 (3), 445-454 (2014).
- Ha, L., et al. ARF functions as a melanoma tumor suppressor by inducing p53-independent senescence. Proceedings of the National Academy of Science U. S. A. 104 (26), 10968-10973 (2007).
- Soldati, T., Schliwa, M. Powering membrane traffic in endocytosis and recycling. Nature Reviews Molecular Cell Biology. 7 (12), 897-908 (2006).
- Grant, B. D., Donaldson, J. G. Pathways and mechanisms of endocytic recycling. Nature Reviews Molecular Cell Biology. 10 (9), 597-608 (2009).
- Hsu, V. W., Prekeris, R. Transport at the recycling endosome. Current Opinion in Cell Biology. 22 (4), 528-534 (2010).
- Taguchi, T. Emerging roles of recycling endosomes. Journal of Biochemistry. 153 (6), 505-510 (2013).
- Goldenring, J. R. Recycling endosomes. Current Opinion in Cell Biology. 35, 117-122 (2015).
- Delevoye, C., Marks, M. S., Raposo, G. Lysosome-related organelles as functional adaptations of the endolysosomal system. Current Opinion in Cell Biology. 59, 147-158 (2019).
- Hsu, V. W., Bai, M., Li, J. Getting active: protein sorting in endocytic recycling. Nature Reviews in Molecular Cell Biology. 13 (5), 323-328 (2012).
- Desfougeres, Y., D'Agostino, M., Mayer, A. A modular tethering complex for endosomal recycling. Nature Cell Biology. 17 (5), 540-541 (2015).
- Le, L., Sires-Campos, J., Raposo, G., Delevoye, C., Marks, M. S. Melanosome biogenesis in the pigmentation of mammalian skin. Integrated Computational Biology. 61 (4), 1517-1545 (2021).
