Electrocochleography (ECochG) measures inner ear potentials generated in response to acoustic stimulation. In cochlear implant (CI) candidates, such inner ear potentials can be measured directly with the implant electrodes. In this video, we systematically explain how to perform ECochG recordings during CI surgery.
Method Article
Performing Intracochlear Electrocochleography During Cochlear Implantation
In This Article
Summary
Abstract
Electrocochleography (ECochG) measures inner ear potentials generated in response to acoustic stimulation of the ear. These potentials reflect the residual function of the cochlea. In cochlear implant candidates with residual hearing, the implant electrode can directly measure ECochG responses during the implantation process. Various authors have described the ability to monitor the inner ear function by continuous ECochG measurements during the surgery. The measurement of ECochG signals during surgery is not trivial. There are no interpretable signals in up to 20% of cases. For a successful recording, a standardized procedure is recommended to achieve the highest measurement reliability and avoid possible pitfalls. Therefore, seamless collaboration between the CI surgeon and CI technician is key. This video consists of an overview of the system setup and a stepwise procedure of performing intracochlear ECochG measurements during CI surgery. It shows the surgeon's and the CI technician's roles in the process, and how a smooth collaboration between the two is made possible.
Introduction
In recent years, the indication for cochlear implants has changed considerably. In the past, the extent of hearing loss in the pure tone audiogram was the primary indication for an implant, whereas today, speech understanding at maximum hearing aid amplification is the decisive factor. This has altered the population of implant candidates. Increasingly, patients who still have natural residual hearing (most commonly in the low-frequency region) receive a CI. Studies have shown that the residual function should be preserved as much as possible during and after surgery. Patients with preserved residual hearing perform better in speech intelligibility tests, have increased spatial awareness, and perceive music more naturally1,2.
In the past, atraumatic implantation primarily depended on the surgeon's assessment and haptic perception. Intraoperatively measured inner ear potentials (i.e., ECochG) are increasingly gaining interest in monitoring inner ear function3,4,5,6. They can provide the surgeon with additional information about the functioning of the inner ear during and after surgery. ECochG is a generic term for electrophysiological signals generated by the cochlea in response to acoustic stimulation. There are four different signal components, which can be measured depending on their origin; the cochlear microphonic (CM) is the largest and most stable signal component and is therefore used as a key variable in many studies. The origin of this signal component is predominantly in the outer hair cells. Other signal components are the auditory nerve neurophonic (ANN, an early neural response), the compound action potential (CAP, an early neural response), and the summating potential (a hair cell response).
The course of the ECochG signal during the implantation process provides insights into the state of the inner ear; changes in the intraoperative ECochG signal can be correlated with the postoperative residual function of the inner ear3,4,7,8,9. The measurement of ECochG signals is not trivial. No interpretable signal can be derived in up to 20% of cases10,11. On the one hand, there are patient-specific factors (i.e., absence of functioning hair cells) that influence the recordings. On the other hand, numerous technical and operation-specific factors contribute to the success of a measurement. Therefore, residual hearing cannot alone explain the success rate of ECochG. To record data as reliably as possible, a standardized procedure for these measurements is important. This prevents mismeasurements and facilitates the interpretation of intraoperative data.
There is no clear consensus of a required hearing threshold. In our experience, reproducible signals can be obtained in patients with a hearing threshold of up to 100 dB hearing loss (HL). This finding has been confirmed by other authors12. Other research groups perform ECochG measurements with a pure tone average (PTA) between 80 and 85 dB or better3,5,6,8,13,14. This video shows the system setup and a stepwise procedure of performing successful intracochlear ECochG measurements during CI surgery.
Protocol
This study was performed in compliance with institutional guidelines (Basec ID 2019-01578). The video shows the recording of ECochG measurements with a MED-EL implant. The required hardware, software, system setup, and intraoperative implementation may vary depending on the manufacturer. However, the chronological sequence and measurement steps are independent of the brand. If necessary, additional information will be provided for the Advanced Bionics (AB) and Cochlear systems. The description of the theater is given from the surgeon's point of view.
1. Before the surgery
- Indication
- Perform ECochG measurements in patients where hearing preservation is the goal.
- Our protocol is as follows: Stimulate with a 500 Hz pure tone, 30 dB above the hearing threshold with a minimum level of 100 dB HL and a maximum level of 120 dB HL. Ensure the following: an acoustic stimulus of a duration of 8 ms, the measurement window of 10 ms length for recording the ECochG potentials beginning 1 ms after the acoustic stimulus, and the measurement repetition set to 100 iterations.
NOTE: Depending on the preoperative hearing test, other frequencies can also be used (i.e., 250 and 1000 Hz)8,14. Stimuli below 1000 Hz are preferred to avoid crossing the corresponding tonotopic intracochlear frequency region (resulting in a non-traumatic drop of the signal amplitude). More recent software versions allow the synchronous real-time measurement of different frequencies15.
- Clean the patient's ear canal thoroughly. Check the eardrum.
NOTE: Obstructing ear wax, liquids or debris might affect the sound transmission during ECochG10. The eardrum must be intact with no sign of infection. - Evaluate the preoperative administration of steroids. At our institution, we use methylprednisolone 125 mg, intravenously administered, 6 h before the start of surgery.
NOTE: Dexamethasone can also be used as part of the standard clinical practice, either the day before or at the induction of anesthesia16,17.
2. Preparation in the theater
- Check the required hardware and software for ECochG measurements. See Table 1 for the hardware and software requirements for different manufacturers.
- Have the engineer check the seamless functioning of hard- and software.
NOTE: The following room setup is recommended: the engineer positions him/herself opposite the surgeon. In this way, he/she can monitor the measurement process well and give direct feedback to the surgeon (Figure 1). - Position the patient's head so that the mastoid segment of the facial nerve runs approximately horizontal.
NOTE: The neck is thereby slightly retracted and the upper body in a reverse Trendelenburg position. Furthermore, the neck is slightly tilted away, and the head rotated to the not-operated side to give maximal access to the surgeon. - Shave the hair in the retro-auricular region (approximately 3 cm).
- Install the facial nerve monitoring.
- Disinfect the surgical site and cover it with sterile drapes.
NOTE: It is important that the auditory canal is included in this step. In addition, it is important that the cover must be as thin as possible in the area of the planned receiver coil position (to avoid connection problems between the transmitting and receiving coil). For this reason, choose thin drapes and place the fluid bag as low as possible (Figure 2).
3. Getting started
- Mark the position of the processor, the implant, and the skin incision.
- Inject the local anesthesia (mepivacaine with 1:200,000 epinephrine).
- Check the ear canal and clean traces of disinfectant solution. Check the eardrum.
- Insert the sterile eartip, connected to a sterile sound tube, deep into the external canal.
NOTE: This step is important because displacement of the eartip leads to significant drops in the presented sound pressure10. - Place a large swab into the concha of the operated ear and tilt the ear forward. Fix the earlobe (including the eartip, soundtube, and swab) with a transparent adhesive foil.
NOTE: This technique avoids strong buckling of the eartip and sound tube as well as eartip displacement, which can lead to attenuation of the presented signal. Furthermore, irrigation fluid and blood can no longer enter the external auditory canal. - Before connecting the sound tube to the non-sterile transducer, have the engineer check the functioning of the acoustic output.
- Connect the sound tube to the non-sterile sound transducer handled by the engineer. Cover the non-sterile part with a sterile blanket. Ensure that the sound transmission parts are tension-free.
4. Implant surgery
- Incise the skin up to the temporalis fascia. Make an offset incision (5-10 mm anteriorly) of the periosteum in a lazy S fashion18. Dissect the periosteum off the bone and display the bony ear canal and Henle spine for orientation. Check the thickness of the soft tissue above the future receiving coil and thin it out according to the manufacturer's recommendations as needed.
NOTE: The incision should be large enough to show the mastoid plane and accommodate the implant housing in a tight subperiosteal plane under the temporalis muscle. - Harvest a 5 mm x 5 mm large piece of dermal fat to seal the posterior tympanotomy and 2-3 small pieces (1 mm x 1 mm) of periosteum to seal the entrance point of the electrode into the inner ear later on.
- Place the wound retractors.
NOTE: Ensure that the retractor does not compromise the soft tissue of the auditory canal. This can cause the inserted eartip to dislodge, which leads to attenuation of the presented signal. - Perform the surgical access to the middle and inner ear.
- Drill the mastoid bone with an overhang posteriorly to accommodate the electrode within the mastoid later on. During this step, harvest some bone paté.
- Display the lateral skull base cranially and drill out the mastoid bone evenly with the deepest point of dissection above the antrum.
- Display the antrum with the lateral semicircular canal.
- Thin out the bony ear canal evenly until the short process of the incus is seen.
- Drill the bone caudal to the lateral semicircular canal toward the mastoid tip, parallel to the expected facial nerve. Display the nerve and, if possible, the chorda tympani.
- Access the middle ear via a posterior tympanotomy. Drill near the buttress between the facial nerve and the chorda until the middle ear space is reached.
- Check the position of visible middle ear structures (e.g., the stapedius tendon). Ensure that the ossicular chain remains intact.
- Enlarge the posterior tympanotomy caudally until the round window niche is visualized.
- Reduce the bony lip of the round window niche until the round window is seen completely.
- Drill an anterior step in the area of the planned implant housing position. Check that the step is of sufficient size with the help of an implant bed indicator. Drill a channel for the electrode.
- Rinse the surgical site thoroughly and perform meticulous hemostasis. Finally, place a 1 cm x 1 cm piece of gelatin sponge in the antrum.
NOTE: In addition to surgical management, it is important that the anesthesiologist monitors blood pressure throughout the procedure (to minimize bleeding; if possible, the systolic blood pressure should be below 100 mg Hg). The gelatin sponge will stop drops of blood or irrigation fluid from running into the middle ear. - Change gloves and wait for the engineer to pass the non-sterile stimulating coil to the scrub nurse. Instruct the nurse to pack the coil into a sterile sleeve.
5. Insertion and ECochG measurements
NOTE: At this point, the communication between the surgeon and the engineer is crucial.
- Rinse the implant and insert it in the previously created subperiosteal pocket. Ensure a stable implant position against the drilled bony step. Depending on the manufacturer, place the separate reference electrode in an anterior, submuscular pocket. Check that ground and reference electrodes of the implant (on top of the implant, right below the coil) are well covered with soft tissue.
- Place the stimulating coil above the magnet of the receiving coil. Rotate the transmitting coil 180° back and forth to align the MR-compatible magnets. Wait for the engineer to measure the wireless connection (coupling check). When the connection is 100%, fix the transmitting coil with an adhesive foil to ensure that the coils do not displace during implantation.
- Inspect the middle ear again. Ensure that the middle ear space is air-filled. Carefully open the round window membrane. Ensure that the opening is sufficiently large and do not accidentally suction the perilymph.
- Insert the first electrode into the round window. If applicable and depending on the manufacturer, condition the electrode. Now, wait for the engineer to perform an impedance check.
NOTE: Impedance values are manufacturer-specific.As a rough guide, the impedance should be below 10 kΩ. - Insert the electrode slowly while carefully following hearing preservation techniques19. Keep the technician informed of progress (e.g., markers, number of electrodes in the cochlea) during insertion. Also instruct the technician to record and clearly communicate the ECochG potentials, i) if there is a signal (most commonly a CM signal), ii) how the signal evolves, and iii) if there are abrupt signal changes.
- With a MED-EL implant, perform the stepwise procedure described previously7.
- ith the standard software, use condensation polarity with a recording window of 9.6 ms. Set the measurement delay to 1 ms and perform 100 iterations.
- Insert the electrode slowly and halt the insertion process after every second or third electrode (increase the number of recordings towards the end).
- Perform an ECochG measurement while holding the electrode array in place. Instruct the engineer to communicate as soon as the measurement is complete. Repeat ECochG until a full insertion is reached.
- With AB or Cochlear implants, record ECochG potentials with alternating polarities while the electrode is moved/inserted8,20. Communicate visible landmarks to the engineer (e.g., first implant marker is reached).
- With a MED-EL implant, perform the stepwise procedure described previously7.
- In case of an amplitude loss of the ECochG signal, retract the electrode slightly and repeat the measurement21.
- After full insertion, have the engineer continue to record ECochG. Communicate each surgical step (e.g., sealing of the round window niche).
- Drape the electrode within the mastoid cavity. Seal the round window with small pieces of the previously harvested fat. Stabilize the electrode within the posterior tympanotomy with a larger piece of fascia or periosteum. Embed the electrode in the bony channel with some bone paté.
- Have the engineer check the integrity of the implant (impedance and electrically evoked compound action potentials). Continue with postinsertion ECochG recordings later.
- Close the wound in layers (periosteal layer, subcutaneous layer, skin).
- Remove the sound tube and eartip; check for possible kinking or dislodgment. Finally, check the eardrum.
Results
For ECochG measurements during cochlear implantation, a standardized procedure is important to achieve the highest possible reproducibility of signals. Here, a setup is proposed wherein the surgeon and the engineer sit opposite each other to facilitate communication (Figure 1). When setting up the system, it is important that there is an unimpeded stimulus transmission. For example, the ear canal should be completely cleaned and clear; the eartip must sit deep in the ear canal; the eartip and sound tube are not kinked; the sound tube must run visibly on the sterile cover and be accessible during surgery; the retractor does not impact the ear canal, and thorough hemostasis should be done prior to the insertion process to ensure an air-filled middle ear space. In addition, a stable connection between the transmitting and receiving coils is important to prevent interruptions during the insertion process. Therefore, the sterile drapes should be as thin as possible (Figure 2), the skin thickness must be checked at the beginning of the surgery, and the two magnets should be aligned. Furthermore, when starting the ECochG measurement, the implant housing must be covered by soft tissue, and the impedance should be checked before continuing with the insertion.
Using this measurement protocol, we performed measurements with 12 patients (Table 2). These patients had a maximum hearing threshold of 100 dB HL at 500 Hz. When calculating the PTA, the mean of the hearing thresholds was taken at 125 Hz, 250 Hz, and 500 Hz. ECochG recordings were performed using an acoustic stimulus at 500 Hz, condensation polarity, and 30 dB above the individual hearing threshold (minimum 100 dB HL, maximum 120 dB HL). The acoustic stimulus had a duration of 8 ms, with a rise/fall time of 2 ms each22. In total, 100 recordings were taken in each case. For signal processing, the focus was on cochlear microphonic signals using Python. First, we applied bandpass filtering (Butterworth, 4th order, 100 Hz-3 kHz bandpass) in forward-backward mode. Finally, an ECochG response was considered valid if the signal-to-noise ratio (SNR) was greater than one. SNR was calculated using the ± averaging method23. The SNR estimate fluctuates due to the small number of epochs. Therefore, the SNR calculation is repeated 1000 times with random subdivisions to obtain a robust estimate. Example measurements are shown in Figure 3: the ECochG signal amplitude increases with its maximum at electrode 9. The mid-peak pattern can be confirmed in the postinsertion measurements (fully inserted electrode). Considering these results, the mid-peak pattern was measured in 8 out of 12 subjects. Others showed an apical-peak (subjects 1, 4, 6) or a start-peak (subject 3)
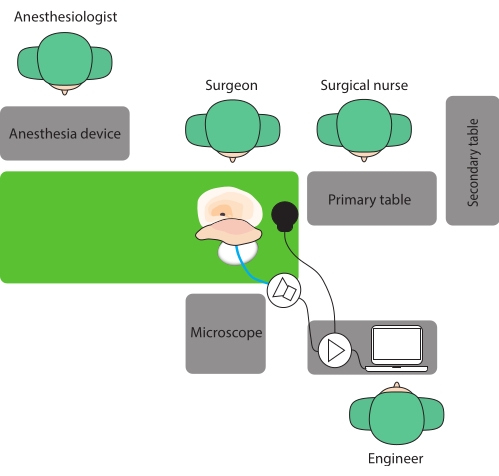
Figure 1: Operative room setup. Here, a setup is proposed where the surgeon and the engineer sit opposite each other to facilitate communication. Please click here to view a larger version of this figure.
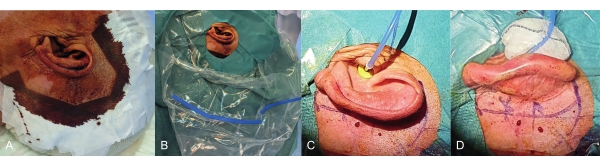
Figure 2: Draping before the surgery. Care must be taken to ensure that there is a stable connection between the transmitting and receiving coils. (A) Thin, sterile drapes and (B) the fluid bag positioned as low as possible shorten the distance between the two coils. In this way, a good connection to the implant can be achieved. (C) The eartip must sit deep in the ear canal. (D) Using a large swab avoids strong buckling of the eartip and sound tube as well as eartip displacement. Please click here to view a larger version of this figure.

Figure 3: Intraoperative ECochG measurements. ECochG traces during (A) and after (B) electrode insertion are shown. Please note that the numbering of electrodes for A and B starts at opposite ends. (A) measures at the electrode tip and counts the number of electrodes inserted into the cochlea. (B) indicates the measurement electrodes, starting with the tip electrode as number one. Below (C), image taken during the implantation process with six inserted electrodes. Abbreviations: ECochG = electrocochleography; ampl = amplitude; el = electrode. Please click here to view a larger version of this figure.
| AB | Cochlear | Med-El | |
| Computer | Tablet AIM | Arbitrary | Arbitrary |
| Software | OMSuite | Cochlear Research Platform | Maestro |
| Implant interface | Audio processor, coil cable | Audio processor, coil cable | Coil cable |
| Interface connection | Programming cable | Cochlear Programming Pod, programming cable, USB | MAXInterface, USB |
| Acoustic stimulation | Transducer AIM | Transducer Cochlear | Arbitrary waveform generator, Transducer Etymotic, trigger cable |
| Sound tube | Custom | Etymotic | Etymotic |
| Eartip | Custom | Etymotic | Etymotic |
Table 1: Hardware and software required for ECochG recordings by three different manufacturers. Abbreviation: ECochG = electrocochleography.
| Subject | Electrode (inserted ec) | Cochlear access | Pre PT at 500 Hz (dB HL) | Pre PTA (dB HL) | Post PT at 500 Hz (dB HL) | Post PTA (dB HL) | IOS SNR | IEC | Final SNR |
| 0 | Flex 28 (11) | rw | 100 | 80 | 115 | 101.7 | 8.68 | 10 | 2.32 |
| 1 | Flex 28 (12) | rw | 65 | 46.7 | 85 | 68.3 | 1.22 | 12 | 1.22 |
| 2 | Flex 28 (12) | rw | 65 | 56.7 | 110 | 98.3 | 2.27 | 9 | 0.77 |
| 3 | Flex 28 (12) | rw | 100 | 91.7 | 110 | 106.7 | 1.35 | 1 | 0.95 |
| 4 | Flex 28 (12) | rw | 100 | 100 | 125 | 111.7 | 1.78 | 12 | 1.78 |
| 5 | Flex 24 (11) | c | 70 | 58.3 | 125 | 111.7 | 3.42 | 9 | 0.91 |
| 6 | Flex 28 (12) | rw | 80 | 45 | 110 | 91.7 | 22.9 | 12 | 22.9 |
| 7 | Flex 28 (12) | rw | 55 | 53.3 | 125 | 111.7 | 2.9 | 6 | 1.43 |
| 8 | Flex 28 (12) | rw | 70 | 70 | 105 | 80 | 2.87 | 6 | 1.44 |
| 9 | Flex 28 (12) | rw | 55 | 40 | 105 | 68.3 | 37.8 | 9 | 5.3 |
| 10 | Flex 28 (11) | rw | 65 | 58.3 | 100 | 90 | 29.14 | 9 | 13.5 |
| 11 | Flex 28 (12) | rw | 80 | 78.3 | 100 | 85 | 3.83 | 6 | 1.89 |
Table 2: ECochG recordings during CI surgery in 12 subjects. ECochG recordings during CI surgery in 12 subjects. IOS SNR displays the maximum SNR of the cochlear microphonic signal reached during insertion. IEC shows at how many inserted electrodes this maximum SNR was reached. The final SNR shows the CM amplitude of the fully inserted electrode at the most apical position. Abbreviations: ECochG = electrocochleography; CI = cochlear implant; rw = round window; C = cochleostomy; IEC = inserted electrode contacts; IOS = intraoperative signal; apical = most apical electrode; pre = preoperative; post = postoperative (4 weeks); PT = pure tone threshold; PTA = pure tone average; SNR = signal-to-noise ratio.
Discussion
ECochG measurements are a promising tool to monitor the inner ear function during implantation. These electrophysiological potentials complement the surgeon's assessment and haptic perception. However, it should be noted that the measurement is not trivial and has many sources of error. To increase the measurement reliability, a standardized procedure is essential. This is key to an accurate interpretation of the signals.
Good communication between the surgeon and the engineer during the entire intervention is particularly important. In addition, the system setup must ensure unimpeded transmission of the acoustic stimulus and good and stable coupling of the transmitting and receiving coil. In a previous paper, we developed a standardized measurement protocol for ECochG recordings during implant surgery10. So far, applying this protocol, we have recorded 12 intraoperative measurements receiving MED-EL implants.
If the impedance is low, start the ECochG measurement. If the impedance is high, i) rinse the implant pocket with saline solution, ii) make sure that the ground electrode is well covered by soft tissue, iii) make sure the tip of the electrode is in good contact with perilymph fluid. If the impedance stays high, repeat an impedance measure with the second or third electrode or insert the electrode slightly deeper into the cochlea.
If ECochG signal drops occur during electrode insertion (usually measured by the CM amplitude), preliminary evidence suggests that the surgical response may affect the inner ear function. A randomized study showed that when the CM amplitude decreased by 30% or more (related to the initial maximum amplitude), a slight withdrawal of the electrode resulted in a significant improvement of postoperative residual hearing21. However, the definition of a detrimental drop is unclear; another publication reported a CM decrease of 61% (or more) at a slope steepness of 0.2 µV/s (or more) to be significant9. A drop in ECochG responses may also be due to other causes, such as the interaction of different signal generators, passing the 500 Hz range within the cochlea, or contact of the basilar membrane with the electrode array 6,24.
It can be concluded that an increasing number of CI candidates have substantial residual hearing. In this cohort, it is essential to preserve the acoustic component during and after CI surgery. ECochG recordings have the potential to provide objective feedback to the surgeon during the implantation process. However, we are just at the beginning of being able to correlate changes of ECochG recordings to the inner ear function and need to improve our knowledge and understanding of successful hearing preservation. ECochG recordings will thereby play an important role, complemented by other inner ear measurements. The goal will be to have an objectified measurement tool that will allow the preservation of residual inner ear function in most implant recipients.
Disclosures
The authors declare that they have no conflicts of interest to declare.
Acknowledgements
The authors would like to thank Marek Polak and his team from MED-EL, Austria, for their support. This study was partly funded by the Department of Otorhinolaryngology, Head and Neck Surgery at the Inselspital Bern, the Clinical trials unit (CTU) research grant, and the MED-EL company. Georgios Mantokoudis was supported by the Swiss National Science Foundation #320030_173081.
Materials
| Name | Company | Catalog Number | Comments |
|---|---|---|---|
| MED-EL | |||
| Arbitrary waveform generator | Dataman, UK | Dataman 531 series | |
| Foam eartip | Etymotic, USA | ER3-14 | |
| Gelfoam | Pfizer, USA | ||
| Implant software | MED-EL, Austria | Maestro 8.03 AS | |
| Interface | MED-EL, Austria | MAX Programming Interface | |
| Max Coil S | MED-EL, Austria | ||
| Python | Python Software Foundation, USA | v 03.08.2008 | |
| Software package Numpy | Python Software Foundation, USA | v. 1.19.2 | |
| Software package Scipy | Python Software Foundation, USA | v. 1.6.2 | |
| Software package Sklearn | Python Software Foundation, USA | v. 0.24.2 | |
| Sterile sleeve | Pharma-Sept Medical Products, Israel | Hand Piece Cover | |
| Sterile sound tube | Etymotic, USA | ER3-21 | |
| Transducer | Etymotic, USA | ER-3C | |
| Trigger cable BNC male to 3.5 mm male | Neurospec, Switzerland | NS-7345 | |
| Cochlear | |||
| Cochlear programming pod Interface | Cochlear, Australia | ||
| Coil | Cochlear, Australia | Nucleus 900 series | |
| Foam eartip | Etymotic, USA | ER3-14 | |
| Naida Q90 Implant software | Cochlear, Australia | v. 1.2 | Cochlear Research Platform |
| Nucleus CP900 Audioprocessor | Cochlear, Australia | ||
| Sterile sleeve | Pharma-Sept Medical Products, Israel | Hand Piece Cover | |
| Sterile sound tube | Etymotic, USA | ER3-21 | |
| Transducer | Cochlear, Australia | EAC00 series | Power speaker unit |
| AB | |||
| AIM Tablet | AB, USA | CI-6126 | |
| AIM Transducer | AB, USA | CI-6129 | |
| Audioprocessor | AB, USA | CI-5280-150 | |
| Eartip | AB, USA | AIM Custom | |
| Naida Coil | AB, USA | CI-5315 | |
| Naida Coil cable | AB, USA | CI-5415-206 | |
| ONSuite Implant software | AB, USA | SoundWave 3.2 | |
| Sterile sound tube | AB, USA | AIM Custom |
References
- Gantz, B. J., Turner, C., Gfeller, K. E., Lowder, M. W. Preservation of hearing in cochlear implant surgery: Advantages of combined electrical and acoustical speech processing. Laryngoscope. 115 (5), 796-802 (2005).
- Helbig, S., et al. Hearing preservation after cochlear reimplantation. Otology & Neurotology. 34 (1), 61-65 (2013).
- Dalbert, A., et al. Simultaneous intra- and extracochlear electrocochleography during electrode insertion. Ear and Hearing. 42 (2), 414-424 (2020).
- Weder, S., et al. Real time monitoring during cochlear implantation: Increasing the accuracy of predicting residual hearing outcomes. Otology & Neurotology. 42 (8), 1030-1036 (2021).
- O'Leary, S., et al. Intraoperative observational real-time electrocochleography as a predictor of hearing loss after cochlear implantation: 3 and 12 month outcomes. Otology & Neurotology. 41 (9), 1222-1229 (2020).
- Giardina, C. K., et al. Intracochlear electrocochleography: response patterns during cochlear implantation and hearing preservation. Ear and Hearing. 40 (4), 833-848 (2019).
- Acharya, A. N., Tavora-Vieira, D., Rajan, G. P. Using the implant electrode array to conduct real-Time intraoperative hearing monitoring during pediatric cochlear implantation: Preliminary experiences. Otology and Neurotology. 37 (2), 148-153 (2016).
- Campbell, L., et al. Intraoperative real-time cochlear response telemetry predicts hearing preservation in cochlear implantation. Otology & Neurotology. 37 (4), 332-338 (2016).
- Weder, S., et al. Toward a better understanding of electrocochleography: Analysis of real-time recordings. Ear and Hearing. 41 (6), 1560-1567 (2020).
- Schuerch, K., et al. Increasing the reliability of real-time electrocochleography during cochlear implantation-a standardized guideline. European Archives of Oto-Rhino-Laryngology. , (2022).
- Yin, L. X., Barnes, J. H., Saoji, A. A., Carlson, M. L. Clinical utility of intraoperative electrocochleography (ECochG) during cochlear implantation: A systematic review and quantitative analysis. Otology & Neurotology. 42 (3), 363-371 (2021).
- Harris, M. S., et al. Real-time intracochlear electrocochleography obtained directly through a cochlear implant. Otology & Neurotology. 38 (6), 107-113 (2017).
- Dalbert, A., et al. Assessment of cochlear function during cochlear implantation by extra- and intracochlear electrocochleography. Frontiers in Neuroscience. 12, 18(2018).
- Ramos-Macias, A., O'Leary, S., Ramos-deMiguel, A., Bester, C., Falcon-González, J. C. Intraoperative intracochlear electrocochleography and residual hearing preservation outcomes when using two types of slim electrode arrays in cochlear implantation. Otology & Neurotology. 40, 29-37 (2019).
- Saoji, A. A., et al. Multi-frequency electrocochleography measurements can be used to monitor and optimize electrode placement during cochlear implant surgery. Otology & Neurotology. 40 (10), 1287-1291 (2019).
- Cho, H. S., Lee, K. -Y., Choi, H., Jang, J. H., Lee, S. H. Dexamethasone is one of the factors minimizing the inner ear damage from electrode insertion in cochlear implantation. Audiology & Neurootology. 21 (3), 178-186 (2016).
- O'Leary, S. J., et al. Systemic methylprednisolone for hearing preservation during cochlear implant surgery: A double blinded placebo-controlled trial. Hearing Research. 404, 108224(2021).
- Weder, S., Shaul, C., Wong, A., O'Leary, S., Briggs, R. J. Management of severe cochlear implant infections-35 years clinical experience. Otology & Neurotology. 41 (10), 1341-1349 (2020).
- Causon, A., Verschuur, C., Newman, T. A. A Retrospective analysis of the contribution of reported factors in cochlear implantation on hearing preservation outcomes. Otology & Neurotology. 36 (7), 1137-1145 (2015).
- O'Connell, B. P., et al. Intra- and postoperative electrocochleography may be predictive of final electrode position and postoperative hearing preservation. Frontiers in Neuroscience. 11, 291(2017).
- Bester, C., et al. Electrocochleography triggered intervention successfully preserves residual hearing during cochlear implantation: Results of a randomised clinical trial. Hearing Research. , 108353(2021).
- Haumann, S., et al. Monitoring of the inner ear function during and after cochlear implant insertion using electrocochleography. Trends in Hearing. 23, 2331216519833567(2019).
- van Drongelen, W. Signal averaging. Signal processing for neuroscientists. van Drongelen, W. , Academic Press. 59-80 (2018).
- Bester, C., et al. Cochlear microphonic latency predicts outer hair cell function in animal models and clinical populations. Hearing Research. 398, 108094(2020).
Reprints and Permissions
