As the use of forced oscillation technique (FOT) is increasingly utilized to characterize respiratory mechanics, there is a need to standardize methods with respect to nascent technical guidelines and various manufacturer's recommendations. A detailed protocol is provided including FOT assessment and interpretation for two cases to facilitate the standardization of methods.
Method Article
Employing the Forced Oscillation Technique for the Assessment of Respiratory Mechanics in Adults
In This Article
Summary
Abstract
There is increasing interest in the use of the forced oscillation technique (FOT) or oscillometry to characterize respiratory mechanics in healthy and diseased individuals. FOT, a complementary method to traditional pulmonary function testing, utilizes a range of oscillatory frequencies superimposed on tidal breathing to measure the functional relationship between airway pressure and flow. This passive assessment provides an estimate of respiratory system resistance (Rrs) and reactance (Xrs) that reflect airway caliber and energy storage and dissipation, respectively. Despite the recent increase in popularity and updated Technical Standards, clinical adoption has been slow which relates, in part, to the lack of standardization regarding the acquisition and reporting of FOT data. The goal of this article is to address the lack of standardization across laboratories by providing a comprehensive written protocol for FOT and an accompanying video. To illustrate that this protocol can be utilized irrespective of a particular device, three separate FOT devices have been employed in the case examples and video demonstration. This effort is intended to standardize the use and interpretation of FOT, provide practical suggestions, as well as highlight future questions that need to be addressed.
Introduction
The forced oscillation technique (FOT) or oscillometry was first introduced over 60 years ago1 and affords measurement of respiratory mechanics via externally applied pressure oscillations superimposed during tidal breathing. In brief, pressure and airflow are measured at the mouth by transducers across a range of frequencies. Spectral analysis is then used to determine impedance (Zrs) or the amplitude and phase differences between pressure and airflow at each frequency2,3. Zrs represents the sum of forces opposing pressure oscillations and is typically characterized by components of resistance (Rrs) and reactance (Xrs). Rrs reflects the dissipative mechanical properties of the respiratory system (energy dissipation), whereas Xrs reflects dynamic elastance and inertia of the respiratory system (energy storage). Zrs assessment at multiple oscillation frequencies further allows assessment of the uniformity of airflow distribution. For a review of FOT signal processing, physiological principles, and applications: please refer to the European Respiratory Society (ERS) Task Force statements2,4.
FOT is not a substitute for spirometry, rather a complementary assessment of the lung function. It may, however, offer several advantages over spirometric testing including measurements performed during tidal breathing (effort-independent) and potential for assessing the distal or small airways that are not feasible with spirometry5. As a result, FOT has gained considerable popularity in the pediatric setting6,7, as well as for the evaluation of the symptomatic patient with normal or preserved spirometry8,9,10,11. FOT has also demonstrated clinical utility during bronchoprovocation testing whereby symptoms are more strongly associated with FOT than spirometry12. Moreover, FOT necessitates lower doses of bronchoprovocative agents to induce measurable differences in respiratory function13.
In light of these findings, interest in FOT for clinical practice and research has surged in recent years. In fact, according to a Scopus search conducted in July 2021 for the terms 'forced oscillation technique' or 'impulse oscillometry', the median number of publications on FOT increased from 35 per year (2000-2010) to 94 per year (2010-2020). Despite this surge of interest, standardization in the acquisition and reporting of FOT data has only recently received greater attention with the recent ERS Technical Standards for Respiratory Oscillometry4. At present, several FOT systems are commercially available that vary by pressure signal type (e.g., pseudorandom, train of impulses), recording epoch, frequency range, and resolution14. Despite these differences, the acquisition and reporting of FOT data as performed by the technician can follow a universal approach which is the focus of the present manuscript. Herein, a standardized protocol is provided that is consistent with the ERS Technical Standards4. This protocol is illustrated through practical examples with research and clinical data acquired in our laboratory. Specifically, the focus is on the application and interpretation of FOT in the clinical evaluation of adult dyspnea.
Protocol
The following protocol was approved by Rutgers University Institutional Review Board. All volunteers participating in this study provided written informed consent prior to all testing.
1. Pre-test preparation
- Assess the individual for allergies or sensitivity to mouthpiece or nose clip materials, for oral or facial pain preventing proper seal on the mouthpiece, for an ability to follow directions, and for known sensitivity to the bronchodilating agent that will be used.
- Ensure that the individual dresses comfortably and refrains from exercising or ingesting a heavy meal before testing. Refer to local laboratory policies regarding the use of caffeine, tobacco products, or inhaler before testing.
- Perform FOT first in situations of multiple pulmonary function tests requiring deep breaths.
- Perform testing in a quiet and comfortable environment. Prepare supplies and materials prior to the individual's arrival.
- Provide an adjustable chair without wheels to ensure that the individual's feet are flat against the floor.
- Provide the individual with a disposable anti-bacterial filter and nose clip to be used for testing.
- Adhere to local laboratory procedures for donning personal protective equipment when testing.
2. Verification with impedance test load
- Locate the test load object before testing the individual.
NOTE: Static test loads are manufacturer-supplied objects with known impedance (preferably with resistive, elastic, and inertial components) that are specific to each device. Use a test load with an impedance of approximately 15 hPa·s·L-1, which exceeds the expected Zrs for adults. - Ensure that the test load is factory calibrated (if applicable).
NOTE: Some test loads require annual factory recalibration, so follow the protocol outlined in the device manual.- Consult the manual or contact the manufacturer if the test load for verification is accidentally dropped or visually appears damaged.
- Open the calibration or verification menu within the software.
- Firmly insert the test load device into the FOT device and complete the verification procedure according to the manufacturer's recommendations.
- Review and save the verification results.
NOTE: A successful verification ensures that the measured values match the test load within a tolerance of ≤+10% or ±0.1 hPa·s·L-1. If the verification fails or gives errors, ensure that the test load was properly seated into the FOT device and there is no obstruction in the flow. Consult the manual for troubleshooting tips. - Verify the device with the test load daily, or immediately before testing.
3. Test procedure
- Provide standardized instructions and demonstration for the individual.
- Let the individual know about the approximate duration of a single acquisition and the number of replicates that will be taken (see step 3.2).
- Let the individual know about the sensations that they will experience from the oscillations, e.g., fluttering or vibrations in the chest and mouth.
- Let the individual know that the device will start oscillations after a brief period of observation to regulate breathing.
- Instruct the individual to avoid swallowing during the testing period.
- Instruct the individual to sit upright with the feet flat on the floor and the chin facing up for the duration of the testing period.
- Instruct the individual to create a seal with the lips and teeth on the mouthpiece via a demonstration.
- Instruct the individual to keep the tongue relaxed.
- Instruct the individual to firmly place open palms against cheeks with fingertips near the temple and thumbs following the mandibular line. Instruct the individual to keep the elbows slightly flared in a comfortable position to ensure chest expansion.
- Instruct the individual to maintain regular quiet breathing on the mouthpiece until asked by the technician to stop.
- Perform measurement session
- Adhere to hygiene and infection control standards as described for spirometry15.
- Attach the anti-bacterial filter to the device.
NOTE: Use filters that meet ATS/ERS guidelines with a resistance <1.5 hPa·s·L-1 at a flow rate less than 14 L/s as verified by the manufacturer. - Provide instructions as described in step 3.1 and ensure that the individual is positioned correctly with the nose clip in place and mouth tightly sealed around the mouthpiece of the device.
- After the individual completes several respiratory cycles of stable, passive, and comfortable tidal breathing, ensure that the device automatically begins acquiring data. Alternatively, the technician may trigger data acquisition using the software.
- Instruct the individual to come off the mouthpiece after at least three artifact-free breaths are acquired during a single acquisition.
NOTE: To achieve three artifact-free breaths, a minimum recording duration of 30 s is recommended. Some FOT devices' settings will automatically stop at a pre-defined recording duration and/or achievement of a certain number of breaths (see section 4 for details on identifying artifacts). - Adjust the rest intervals between replicate measurements (approximately 60-90 s) as needed to avoid any physical discomfort.
- Optionally, assess the bronchodilator response.
- Administer salbutamol to the individual in accordance with standard laboratory procedures for aerosol medications (e.g., metered dose inhaler, nebulizer) and wait for 15 min16.
NOTE: If using a metered dose inhaler with a spacer, administer four separate doses of 100 µg. - Repeat the same procedures as before (see step 3.2) to obtain post-bronchodilator replicates.
- Administer salbutamol to the individual in accordance with standard laboratory procedures for aerosol medications (e.g., metered dose inhaler, nebulizer) and wait for 15 min16.
4. Determining acceptable measurements
- Identify artifacts through visual inspection. To do so, monitor the depth (tidal volume; Vt) and rate of breathing (respiratory frequency; fR) in real-time during acquisition to visually ensure stable and quiet breathing patterns from replicate to replicate.
NOTE: For each replicate, the average Vt, fR, or their product (minute ventilation, V̇E) will be displayed within the software. Compare this value between replicates in order to provide individual feedback on the depth and rate of breathing, if necessary. - Inspect the replicate manually to exclude artifacts such as cough, swallowing, leak, or other interruptions to flow and pressure traces that can be viewed in real-time.
- Discard any replicates containing negative resistances.
- Review automatic software detection of artifacts.
NOTE: Manufacturers employ software algorithms for detecting artifacts and excluding whole or partial breaths (i.e., inspiration and expiration). Get familiarized with the algorithms applied and report this when summarizing data from a measurement session. Often, these algorithms involve identifying Rrs, Xrs, and breathing patterns outside of normal physiological ranges as well as outliers when comparing breath-by-breath. - Assess variability
- Acquire at least three acceptable replicates (i.e., those containing ≥3 artifact-free breaths). Calculate the within-session coefficient of variation (CoV) for total Rrs at the lowest frequency (e.g., Rrs at 5 Hz).
NOTE: CoV is calculated using the following formula:

- As the acceptable within-session CoV for adults is ≤10%, obtain additional replicates if the CoV is >10% or proceed to step 5 if CoV is ≤10%.
NOTE: Achieving CoV ≤10% may be difficult in individuals with airway disease.
- Acquire at least three acceptable replicates (i.e., those containing ≥3 artifact-free breaths). Calculate the within-session coefficient of variation (CoV) for total Rrs at the lowest frequency (e.g., Rrs at 5 Hz).
5. Reporting data
- Include the following details when reporting FOT results.
- Include the device name, model, software version, and manufacturer.
- Include input stimulus frequency waveform (e.g., pseudo-random noise, multi-frequency) and associated frequency range.
- Include the details on subjective and automatic quality control procedures used to determine acceptable replicates and the number of artifact-free replicates included.
- Include the repeatability or precision of measurement (CoV) and cut-off.
- Report the mean of the replicate measurements that were free of artifact and provided a CoV ≤10% for FOT parameters.
- Adhere to laboratory standards regarding which FOT parameters to report.
NOTE: While there is currently no consensus on which FOT variables to include, the ERS Technical Standard provides an example of what parameters might be reported as shown in Table 1 for the case example results presented below.
- Adhere to laboratory standards regarding which FOT parameters to report.
- Utilize reference equations from the population being studied using the same FOT device (if available).
NOTE: Many reference equations will assume accurate recording of age, sex, height, and weight14. - Optionally, report both the absolute and relative difference if FOT was performed before and after a bronchodilator. Also, include the dose of salbutamol.
6. Quality control and maintenance
- Employ a quality control program using biological controls (i.e., ≥2 healthy non-smoking individuals) that involves routine testing on a periodic basis.
- Establish a baseline (mean ± SD) through the acquisition of 10-20 artifact-free replicate measurements on different days (acquired within 2 weeks) from each biological control.
- Select a low- (5 Hz) and mid-frequency (20 Hz) parameter for resistance and reactance to follow for quality control. On subsequent routine periodic testing, compare the results to the baseline measures.
NOTE: Refer to recommended guidance for pulmonary function laboratories17 for additional details on how to assess and enact quality assurance standards. The frequency of biological control testing (e.g., weekly, monthly) should reflect the volume of testing in the laboratory.
- Follow the manufacturers' recommendations on regular maintenance such as cleaning, air filter change, software updates, and factory calibration.
Results
First, a case of a healthy adult is presented as a practical example of data acquisition and how the technician selects individual measurements for reporting (Case Example 1). Second, a clinical example is provided of a patient referred for unexplained dyspnea for FOT acquisition before and after a bronchodilator with emphasis on interpretation (Case Example 2). Note that FOT devices from two different manufacturers have been purposefully used in these case examples to illustrate a universal approach. Additional details are provided in the Table of Materials.
Case Example 1
FOT was performed in a healthy 25-year-old Hispanic female (Height: 164 cm, Weight: 84.9 kg). The participant was a never-smoker, denied respiratory symptoms, and had no history of lung disease or other significant past medical history. She had abstained from caffeine (≥8 h) and vigorous exercise (≥24 h). She had a recent spirometric examination that was read as normal without signs of obstruction or restriction: FEV1/FVC: 0.88, FEV1: 3.30 L (98% predicted), and FVC: 3.70 L (97% predicted).
After explaining and demonstrating test procedures, three FOT measurements were obtained with approximately 1-2 min between recordings. Visual inspection and the software's quality control algorithm did not identify any artifacts. Rrs at 5 Hz for the first three measurements was then examined to confirm within-session CoV (individual measurements: 3.06, 3.79, 3.46 hPa·s ·L-1; average: 3.44 hPa·s·L-1, standard Deviation: 0.36 hPa·s L-1, CoV = standard deviation / average = 0.36 / 3.44 = 0.105 * 100 = 10.5%).
Since the CoV of the first three measurements was >10%, additional measurements were necessary. A fourth measurement was obtained (Rrs at 5 Hz = 3.40 hPa·s·L-1) and within-session CoV was recalculated using all measurements (individual measurements: 3.06, 3.79, 3.46, 3.40 hPa·s·L-1; average: 3.43 hPa·s·L-1; standard Deviation: 0.30 hPa·s·L-1; CoV = standard deviation / average = 0.30 / 3.43 = 0.087 * 100 = 8.7%)
Because the within-session CoV criteria were met, average FOT indices were calculated as the average of measurements. These measurements are illustrated in Figure 1 and reported in Table 1. Additionally, to facilitate comparison to expected values, Table 2 presents predicted values across all FOT indices (where predicted values are available), lower limits of normal (LLN), upper limits of normal (ULN), % of predicted and Z-scores using standard reference equations that consider age, sex, and weight14.
Case Example 2
A 48-year-old Caucasian male (Height: 185 cm, Weight: 89 kg) was referred to our center for evaluation of chronic cough and exertional dyspnea without obvious cause (e.g., medication, respiratory or cardiovascular disease, or mental health comorbidity). He was a lifetime never-smoker but endorsed exposure to vapors, gases, dust, and fumes during a 7-month military deployment to Iraq. Complete pulmonary function testing was performed (i.e., body plethysmography, bronchodilator spirometry, and lung diffusing capacity for carbon monoxide) and all results were within normal limits. FOT was performed before and 15 min after administration of bronchodilator (4 puffs of 100 µg salbutamol via metered-dose inhaler with spacer) (Figure 2). The individual trial data and mean values are presented in Table 3 pre- and post-bronchodilator administration; as each trial was technically acceptable, the pre- and post-bronchodilator measurements, as well as their absolute and relative difference, are reported in Table 4. In addition, predicted values, % of predicted, LLN, and ULN are also reported using standard reference equations that consider age, sex, and weight14.
We delimited variables reported in Table 3 and Table 4 to simplify the illustration of two concepts: 1) determining abnormal versus normal responses, and 2) bronchodilator reversibility. For Rrs measurements, values that exceed the ULN (i.e., elevated resistance) are considered abnormal. Here, pre-bronchodilator Rrs at 4 Hz (3.32 hPa·s·L-1) exceeds the ULN (2.59 hPa·s·L-1) and is 155% of the predicted value ([3.32 / 2.14] * 100 = 155.14). Following bronchodilator administration, Rrs at 4 Hz was reduced by 45.78% exceeding the 95th percentile reported by Oostveen et al.14 (i.e., -32% for Rrs at 4 Hz). This response would indicate a positive bronchodilator response in resistance. Additionally, the post-bronchodilator observed value is normalized (i.e., became representative of what is considered a normal value) and is 84.1% of the predicted value ([1.80 / 2.14] * 100 = 84.11).
Xrs at 4 Hz is interpreted differently as observed values are negative. Therefore, abnormal values are those that exceed the LLN (i.e., more negative reactance). Here, the individual had a pre-bronchodilator (-0.98 hPa·s·L-1) and post-bronchodilator (-0.83 hPa·s·L-1) values that are above the LLN (-1.11 hPa·s·L-1). The difference in pre- versus post-bronchodilator was approximately 15%, which is below the 95th percentile reported by Oostveen et al.14 (i.e., +33.8% in Xrs at 4 Hz). Therefore, all Xrs values are considered normal.
Reactance area (or AX) is the integrated area of low-frequency reactance and, therefore, is a positive value. Abnormal AX values are those that exceed the ULN, reflecting more negative reactance. Like Xrs at 4 Hz, pre-bronchodilator AX (2.77 hPa·s·L-1) and post-bronchodilator AX (1.23 hPa·s·L-1) are both below the ULN. Although there was a reduction of -55% from pre- to post-bronchodilator value, this falls below the 95th percentile reported by Oostveen et al.14 (i.e., -56.0% for AX at 4 Hz). Taken together, AX is considered normal as well.
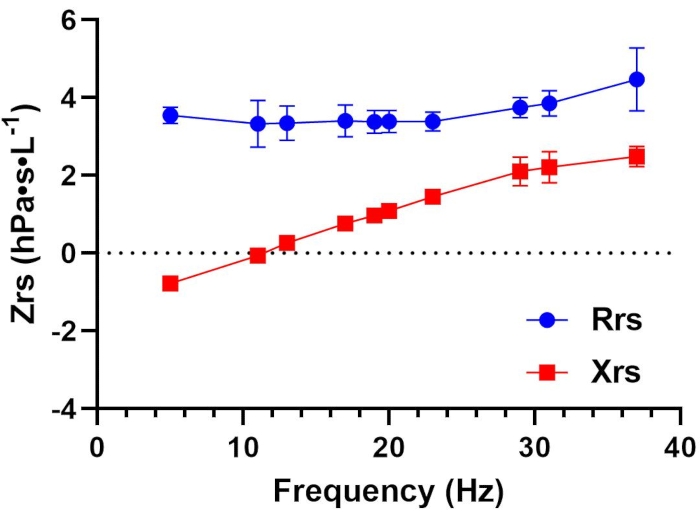
Figure 1: Respiratory resistance (Rrs) and reactance (Xrs) as a function of oscillation frequency (Hz) in a healthy adult. Mean ± SD of all replicates are plotted for Rrs (blue circles) and Xrs (red squares) at each measured frequency. Each data point represents total or whole-breath measurements. Data were collected using a device that employs a pseudorandom, relative primes signal type in the 5-37 Hz range. Please see the Table of Materials for additional details regarding this device. Please click here to view a larger version of this figure.

Figure 2: Pre- and post-bronchodilator assessment. Respiratory resistance (Rrs; blue) and reactance (Xrs; red) before (open circles) and after (open triangles) bronchodilator administration. Dashed red lines represent the upper and lower limits of normal for Rrs and Xrs, respectively14. Data were collected using a device that employs a pseudorandom signal type in the 4-48 Hz range. Please see the Table of Materials for additional details regarding this device. Please click here to view a larger version of this figure.
| Variable | T1 | T2 | T3 | T4 | Avg | SD |
| Rrs5 | 3.06 | 3.79 | 3.46 | 3.40 | 3.43 | 0.30 |
| Rrs5 (insp) | 3.30 | 3.45 | 3.34 | 3.64 | 3.43 | 0.15 |
| Rrs11 | 2.77 | 4.02 | 3.08 | 2.89 | 3.19 | 0.57 |
| Rrs19 | 2.92 | 3.71 | 3.30 | 3.13 | 3.27 | 0.33 |
| Rrs5-19 | 0.14 | 0.08 | 0.15 | 0.26 | 0.16 | 0.08 |
| Xrs5 | -0.90 | -0.76 | -0.69 | -0.90 | -0.81 | 0.11 |
| Xrs5 (insp) | -1.44 | -0.91 | -0.86 | -1.08 | -1.07 | 0.26 |
| Xrs5 (exp) | -0.63 | -0.46 | -0.55 | -0.77 | -0.60 | 0.13 |
| Delta Xrs5 | -0.81 | -0.45 | -0.31 | -0.31 | -0.47 | 0.24 |
| Xrs11 | -0.04 | -0.09 | 0.00 | -0.09 | -0.06 | 0.04 |
| Xrs19 | 0.92 | 0.86 | 1.12 | 0.94 | 0.96 | 0.11 |
| AX | 2.83 | 2.57 | 2.05 | 2.98 | 2.61 | 0.41 |
| Fres | 11.27 | 11.62 | 10.99 | 11.57 | 11.36 | 0.29 |
| Vt | 0.90 | 0.98 | 0.95 | 0.61 | 0.86 | 0.17 |
Table 1: Standard reporting of select FOT parameters: Trials summary. This table illustrates all measurement replicates across trials (T1-T4) and their summary statistics (averages and standard deviations (SD)). The average values across all trials are used to represent the test session. Common parameters are listed under Variable. Resistance (Rrs) and reactance (Xrs) are provided for whole breaths at 5, 11, and 19 Hz, as well as during inspiration at 5 Hz (Rrs5(insp) and Xrs5(insp)). Additional parameters reported include reactance area (AX) at 5 Hz, resonant frequency (Fres), and tidal volume (Vt).
| Variable | Predicted | LLN | ULN | Baseline Avg | % of Predicted | Z Score |
| Rrs5 | 3.76 | - | 4.11 | 3.43 | 91% | -0.34 |
| Rrs5 (insp) | - | - | - | 3.43 | - | - |
| Rrs11 | 2.74 | - | 3.18 | 3.19 | 116% | -0.33 |
| Rrs19 | 3.52 | - | 3.92 | 3.27 | 93% | -0.3 |
| Rrs5-19 | 0.14 | - | - | 0.16 | 118% | 0.05 |
| Xrs5 | -1.37 | -1.50 | - | -0.81 | 59% | 1.32 |
| Xrs5 (insp) | - | - | - | -1.07 | - | - |
| Xrs5 (exp) | - | - | - | -0.60 | - | - |
| Delta Xrs5 | - | - | - | -0.47 | - | - |
| Xrs11 | -0.14 | -0.26 | - | -0.05 | 36% | 0.22 |
| Xrs19 | - | - | - | 0.96 | - | - |
| AX | 4.08 | 5.11 | 2.61 | 64% | -0.64 | |
| Fres | 12.73 | - | 13.14 | 11.36 | 89% | - |
Table 2: Standard reporting of select FOT parameters: Reference and predicted values. There is currently no consensus on which FOT parameters to include in a basic report; however, the ERS Technical Standard provides an example of what parameters might be reported4, which are included in the accompanying table. This table illustrates the averaged measurement values reported from the test session as well as the accompanying reference values currently available. Common parameters are listed under Variable. Resistance (Rrs) and reactance (Xrs) are provided for whole breaths at 5, 11, and 19 Hz, as well as during inspiration at 5 Hz (Rrs5(insp) and Xrs5(insp)). Additional parameters reported include reactance area (AX) at 5 Hz and resonant frequency (Fres). For those parameters with reference values available14, predicted, % predicted, lower and upper limits of normal (LLN, ULN), and Z-score values are also calculated.
| Pre-Bronchodilator | Post-Bronchodilator | |||||||||
| Variable | T1 | T2 | T3 | Avg | SD | T1 | T2 | T3 | Avg | SD |
| Rrs | 3.34 | 3.21 | 3.42 | 3.32 | 0.11 | 1.81 | 1.89 | 1.69 | 1.80 | 0.10 |
| Xrs | -1.25 | -0.72 | -0.98 | -0.98 | 0.26 | -0.42 | -1.32 | -0.74 | -0.83 | 0.45 |
| AX | 2.50 | 2.02 | 2.79 | 2.44 | 0.39 | 0.73 | 1.95 | 1.01 | 1.23 | 0.64 |
Table 3: Interpreting low-frequency resistance (Rrs), reactance (Xrs), and reactance area (AX): Trials summary. This table illustrates all measurement replicates across trials (pre- and post-bronchodilator) and their summary statistics (averages and standard deviations (SD)). The average values across all trials are used to represent the test session's values for baseline averages (pre-bronchodilator) and post-bronchodilator averages.
| Variable | Predicted | LLN | ULN | Baseline Avg | % of Predicted | Post BD Avg | % of Predicted | Absolute Change | % Change |
| Rrs | 2.14 | NA | 2.59 | 3.32 | 155% | 1.80 | 84% | 1.52 | -45.78% |
| Xrs | -0.97 | -1.11 | NA | -0.98 | 101% | -0.83 | 86% | -0.15 | 15.31% |
| AX | 2.15 | NA | 3.08 | 2.44 | 113% | 1.23 | 57% | 1.21 | -49.59% |
Table 4: Interpreting low-frequency resistance (Rrs), reactance (Xrs), and reactance area (AX): Reference and predicted values. Low-frequency (4 Hz) Rrs, Xrs, and AX are reported along with the corresponding predicted values, % of predicted, and the lower (LLN) and upper (ULN) limits of normal14. Measurements before (Baseline Avg) and after (Post BD Avg) bronchodilator are presented along with their corresponding absolute and relative change (% Change).
Discussion
The recent ERS Technical Standard on FOT4 emphasizes the need for greater rigor and standardization of measurement. Close adherence to several critical steps before, during, and after testing is necessary. It is recommended that FOT be performed prior to more effort-dependent maneuvers requiring deep breaths such as body plethysmography and diffusing capacity. End-user verification of test load with known impedance is required at least daily or immediately prior to testing. Clear, consistent, and precise instructions given by trained personnel can minimize extrinsic variabilities in data collection. Each research or clinical laboratory should develop its own protocol implementing the minimal coaching techniques recommended by the ERS technical guidelines. It is critical that during each maneuver the end-users can observe, identify, and correct potential errors that may be encountered, such as mouth leaks, glottic closure, coughing, and unstable breathing patterns. Although certain errors may be difficult to evaluate in real-time, end-users should not solely depend on automatic detection from the specific device used. Acceptable criteria set by the manufacturer should be thoroughly reviewed, and additional criteria should adhere to the ERS statements. Though each device will generate a unique report, standardized reporting of FOT parameters is possible and can facilitate comparison across laboratories and studies. Lastly, rigorous quality control procedures, including routine assessment of healthy biological control(s), must be performed in both research and clinical settings.
Strict adherence to a standardized protocol will minimize variability in performance. However, achieving a CoV ≤10% may still be difficult, and perhaps not always possible in those with airway disease. It is incumbent on the technician to strive toward minimizing variability and there are several strategies to consider when a CoV ≤10% cannot be obtained. Firstly, ensure the measurement is acquired under similar circumstances for each replicate. This includes monitoring the individual's posture, hand placement, and adherence to other instructions. The technician may consider repeating initial instructions, providing additional visual demonstration, and offering the individual a prolonged rest interval. Based on experience, it is found that a common reason for excessive variability includes adopting a different sitting position between replicate measurements whereby individuals may re-position themselves to achieve a more comfortable position or strain to reach the mouthpiece. This is most common when using portable FOT devices designed to be held by the technician where the position of the mouthpiece is not fixed. To address this issue, flexible arm mounts may be purchased, which are designed to hold electronic devices like cameras, that can be quickly secured to a desk or table and accommodate individual positioning. After ensuring performance is appropriate and consistent between replicate measurements, the technician should acquire additional replicates.
Unlike spirometry whereby a maximum of eight attempts is recommended to avoid fatigue, there is no maximum number of replicates recommended for FOT likely because of its effort-independent approach. In practice, some investigators acquire up to eight replicate measurements18, and a similar rule of thumb of up to 10 measurements is used in our laboratory. Establishing an upper limit is practically important to define the end of a testing session. Doing so is particularly relevant for individuals with respiratory disease whereby CoV greater than 10% may reflect underlying disease processes rather than poor effort. Harkness et al.18 recently described their experience with these patient populations and suggested that a more liberal cut-off (CoV up to 20%) may still be reportable for clinical interpretation. Each clinic and research laboratory should balance between practical decisions such as time constraint, examinee's ability and fatigue level, as well as the likelihood of achieving the CoV cutoff. One approach to consider is the implementation of a grading system. For example, once at least three artifact-free replicate measurements are obtained from a maximum of 10 attempts, apply a letter grade corresponding to CoV levels - i.e., 'A' ≤10%; 'B' > 10% and ≤15%; 'C' > 15% and ≤20%; and 'D' > 20%. Additional strategies to be considered may include modification of software and hardware acquisition parameters to achieve more complete breaths. For example, some manufacturers have settings to accommodate greater recording durations and/or extended recording epochs to achieve more than the ERS-recommended minimum of three complete breaths. When reporting FOT results, it is imperative to disclose all acquisition parameters to facilitate interpretation and comparison with other published literature. FOT acquisition parameters continue to be actively investigated and will likely result in future modifications to FOT performance and measurement.
In this paper, the aim is to highlight the latest technology and application of FOT as well as provide a standardized protocol for testing in adults. It is, however, important to recognize FOT's associated limitations. First, impedance measurements are particularly suspect to artifacts such as extra-thoracic influences4. Therefore, the current protocol focuses on minimizing this influence, such as ensuring proper cheek support during acquisition. Additionally, interruptions in flow (e.g., tongue covering the mouthpiece, swallowing, errant breaths) preclude accurate measurement and result in fewer valid breaths for Zrs calculations19. Second, though FOT is easy to perform from the patient's perspective, identifying these artifacts as well as interpreting the output is challenging for the technician and clinician20. For example, current FOT devices produce a considerable amount of data to characterize an individual's respiratory mechanics; however, the paucity of reference values and consensus around key variables are factors that slow its clinical adoption. Similarly, while it is recommended to obtain at least three artifact-free trials4, if more than three trials are performed and found acceptable, there is no current consensus on the recommended methods to select which of these trials are used to represent the test session. As such, the clinical utility of FOT in a variety of airway diseases continues to be actively investigated. Lastly, from a technical perspective, there is heterogeneity across FOT manufacturers with respect to the following: i) frequency waveforms, ii) algorithms for error detection, and iii) inter-and intra-breath analyses2,21,22,23,24. Much of the aforementioned limitations may be addressed by following a standardized protocol as well as transparent reporting of output and recording parameters.
Pulmonary function tests traditionally include measurements of lung volumes and capacities, and effectiveness of gas exchange, which require significant instructions, cooperation, and effort from both examiners and examinees. In addition, a mixture of gases at various concentrations is often inhaled during maneuvers, which some might consider invasive techniques. These contrast with FOT, in which mechanical properties of the lungs such as Rrs, elastance, and inertance are examined using less invasive oscillatory frequencies. Thus, FOT can serve as a useful addition to a comprehensive pulmonary function assessment. For example, FOT may afford unique clinical insight in scenarios where symptoms are disproportionate to traditional pulmonary function testing such as those with occupational exposure and/or unexplained dyspnea9,11. Additionally, FOT may also be important for screening those at higher risk for future lung diseases such as asymptomatic smokers25 and those with environmental exposures26. Lastly, more recent data has identified that FOT may also be uniquely helpful for day-to-day monitoring of certain disease conditions such as exercise-induced bronchoconstriction27 and rheumatoid arthritis-related pulmonary symptoms28. The present article focuses on FOT's application in the adult population, though FOT's clinical and research utility has been well described in pediatric populations as well29,30.
Future directions for research should further focus on technical and performance aspects of FOT, such as standardizing data presentation and reporting, as well as characterizing associated variability and repeatability. In clinical settings, FOT can be widely used for the assessment of dyspnea and early detection of chronic airway diseases or systemic disease-associated pulmonary manifestations in all age groups.
Disclosures
All the authors declared no financial conflicts.
Acknowledgements
This work was supported, in part, by contract award #10010115CN2 from the Electric Power Research Institute. The contents do not represent the views of the U.S. Department of Veterans Affairs or the United States Government.
Materials
| Name | Company | Catalog Number | Comments |
|---|---|---|---|
| Quark i2M | Cosmed | n/a | https://www.cosmed.com/en/products/pulmonary-function/quark-i2m Software (version): PFTSuite (10.0e) Signal Type: Pseudo-random Frequencies (Hz): 4, 6, 8, ..., 48 |
| Resmon Pro | MGC Diagnostics | n/a | https://mgcdiagnostics.com/products/resmon-pro-v3-forced-oscillation-technique Software (version): Pro Full (v3) Signal Type: Pseudorandom, relative primes Frequencies (Hz): 5, 11, 19 |
| Tremoflo C-100 | Thorasys | n/a | https://www.thorasys.com/ Software (version): tremfolo (1.0.43) Signal Type: Pseudo-random, relative primes Frequencies (Hz): 5, 11, 14, 17, 19, 23, 29, 31, 37 |
References
- Dubois, A. B., Brody, A. W., Lewis, D. H., Burgess, B. F. Oscillation mechanics of lungs and chest in man. Journal of Applied Physiology. 8 (6), 587-594 (1956).
- Oostveen, E., et al. The forced oscillation technique in clinical practice: methodology, recommendations and future developments. European Respiratory Journal. 22 (6), 1026-1041 (2003).
- Goldman, M. D., Saadeh, C., Ross, D. Clinical applications of forced oscillation to assess peripheral airway function. Respiratory Physiology & Neurobiology. 148 (1-2), 179-194 (2005).
- King, G. G., et al. Technical standards for respiratory oscillometry. European Respiratory Journal. 55 (2), 1900753(2020).
- Mead, J. The lung's "quiet zone". New England Journal of Medicine. 282 (23), 1318-1319 (1970).
- Bickel, S., Popler, J., Lesnick, B., Eid, N. Impulse oscillometry: interpretation and practical applications. Chest. 146 (3), 841-847 (2014).
- Starczewska-Dymek, L., Bozek, A., Dymek, T. Application of the forced oscillation technique in diagnosing and monitoring asthma in preschool children. Advances in Respiratory Medicine. 87 (1), 26-35 (2019).
- Berger, K. I., et al. Oscillometry complements spirometry in evaluation of subjects following toxic inhalation. ERJ Open Research. 1 (2), 00043(2015).
- Butzko, R. P., et al. Forced oscillation technique in veterans with preserved spirometry and chronic respiratory symptoms. Respiratory Physiology & Neurobiology. 260, 8-16 (2019).
- Jetmalani, K., et al. Peripheral airway dysfunction and relationship with symptoms in smokers with preserved spirometry. Respirology. 23 (5), 512-518 (2018).
- Oppenheimer, B. W., et al. Distal airway function in symptomatic subjects with normal spirometry following world trade center dust exposure. Chest. 132 (4), 1275-1282 (2007).
- Zaidan, M. F., Reddy, A. P., Duarte, A. Impedance oscillometry: emerging role in the management of chronic respiratory disease. Current Allergy and Asthma Reports. 18 (1), 3(2018).
- Broeders, M. E., Molema, J., Hop, W. C., Folgering, H. T. Bronchial challenge, assessed with forced expiratory manoeuvres and airway impedance. Respiratory Medicine. 99 (8), 1046-1052 (2005).
- Oostveen, E., et al. Respiratory impedance in healthy subjects: baseline values and bronchodilator response. European Respiratory Journal. 42 (6), 1513-1523 (2013).
- Graham, B. L., et al. Standardization of spirometry 2019 update. An official American thoracic society and European respiratory society technical statement. American Journal of Respiratory and Critical Care Medicine. 200 (8), 70-88 (2019).
- Pellegrino, R., et al. Interpretative strategies for lung function tests. European Respiratory Journal. 26 (5), 948-968 (2005).
- Wanger, J., Crapo, R. O., Irvin, C. G. Pulmonary function laboratory management and procedure manual: A project of the American Thoracic Society. 3rd edn. , American Thoracic Society. (1998).
- Harkness, L. M., et al. Within-session variability as quality control for oscillometry in health and disease. ERJ Open Research. 7 (4), 00074(2021).
- Robinson, P. D., et al. Procedures to improve the repeatability of forced oscillation measurements in school-aged children. Respiratory Physiology & Neurobiology. 177 (2), 199-206 (2011).
- Pham, T. T., Thamrin, C., Robinson, P. D., McEwan, A. L., Leong, P. H. W. Respiratory artefact removal in forced oscillation measurements: A machine learning approach. IEEE Transactions on Biomedical Engineering. 64 (8), 1679-1687 (2017).
- Mori, K., et al. Colored 3-dimensional analyses of respiratory resistance and reactance in COPD and asthma. COPD. 8 (6), 456-463 (2011).
- Tanimura, K., et al. Comparison of two devices for respiratory impedance measurement using a forced oscillation technique: basic study using phantom models. The Journal of Physiological Sciences. 64 (5), 377-382 (2014).
- Alblooshi, A., Alkalbani, A., Albadi, G., Narchi, H., Hall, G. Is forced oscillation technique the next respiratory function test of choice in childhood asthma. World Journal of Methodology. 7 (4), 129-138 (2017).
- Calverley, P. M. A., Farre, R. Putting noninvasive lung mechanics into context. European Respiratory Journal. 42 (6), 1435-1437 (2013).
- Bhattarai, P., et al. Clinical application of Forced Oscillation Technique (FOT) in early detection of airway changes in smokers. Journal of Clinical Medicine. 9 (9), 2778(2020).
- Berger, K. I., et al. Oscillometry complements spirometry in evaluation of subjects following toxic inhalation. ERJ Open Research. 1 (2), 00043(2015).
- Seccombe, L. M., Peters, M. J., Buddle, L., Farah, C. S. Exercise-induced bronchoconstriction identified using the forced oscillation technique. Frontiers in Physiology. 10, 1411(2019).
- Sokai, R., et al. Respiratory mechanics measured by forced oscillation technique in rheumatoid arthritis-related pulmonary abnormalities: frequency-dependence, heterogeneity and effects of smoking. SpringerPlus. 5 (1), 1-12 (2016).
- Starczewska-Dymek, L., Bozek, A., Jakalski, M. The usefulness of the forced oscillation technique in the diagnosis of bronchial asthma in children. Canadian Respiratory Journal. 2018, 7519592(2018).
- Lauhkonen, E., Kaltsakas, G., Sivagnanasithiyar, S., Iles, R. Comparison of forced oscillation technique and spirometry in paediatric asthma. ERJ Open Research. 7 (1), 00202(2021).
Reprints and Permissions
