The protocol presents a series of best practice protocols for the collection of bone powder from eight recommended anatomical sampling locations (specific locations on a given skeletal element) across five different skeletal elements from medieval individuals (radiocarbon dated to a period of ca. 1040-1400 CE, calibrated 2-sigma range).
Method Article
Optimized Bone Sampling Protocols for the Retrieval of Ancient DNA from Archaeological Remains
In This Article
Summary
Abstract
The methods presented here seek to maximize the chances for the recovery of human DNA from ancient archaeological remains while limiting input sample material. This was done by targeting anatomical sampling locations previously determined to yield the highest amounts of ancient DNA (aDNA) in a comparative analysis of DNA recovery across the skeleton. Prior research has suggested that these protocols maximize the chances for the successful recovery of ancient human and pathogen DNA from archaeological remains. DNA yields were previously assessed by Parker et al. 2020 in a broad survey of aDNA preservation across multiple skeletal elements from 11 individuals recovered from the medieval (radiocarbon dated to a period of circa (ca.) 1040-1400 CE, calibrated 2-sigma range) graveyard at Krakauer Berg, an abandoned medieval settlement near Peißen Germany. These eight sampling spots, which span five skeletal elements (pars petrosa, permanent molars, thoracic vertebra, distal phalanx, and talus) successfully yielded high-quality ancient human DNA, where yields were significantly greater than the overall average across all elements and individuals. Yields were adequate for use in most common downstream population genetic analyses. Our results support the preferential use of these anatomical sampling locations for most studies involving the analyses of ancient human DNA from archaeological remains. Implementation of these methods will help to minimize the destruction of precious archaeological specimens.
Introduction
The sampling of ancient human remains for the purposes of DNA recovery and analysis is inherently destructive1,2,3,4. The samples themselves are precious specimens and morphological preservation should be preserved wherever possible. As such, it is imperative that sampling practices be optimized to both avoid unnecessary destruction of irreplaceable material and to maximize the probability of success. Current best practice techniques are based on a small cohort of studies limited to either forensic surveys5,6, studies of ancient specimens where the development of optimal sampling is not the direct aim of the study7, or dedicated studies utilizing either non-human remains8 or targeting a very small selection of anatomical sampling locations (used here to denote a specific area of a skeletal element from which bone powder, for use in downstream DNA analyses, was generated)9,10. The sampling protocols presented here were optimized in the first large-scale systematic study of DNA preservation across multiple skeletal elements from multiple individuals11. All samples stemmed from skeletal elements recovered from 11 individuals excavated from the church graveyard of the abandoned medieval settlement of Krakauer Berg near Peißen, Saxony-Anhalt, Germany (see Table 1 for detailed sample demographics) and, as such, may need modification for use with samples outside of this geographical/temporal range.
| Individual | Sex | Estimated age at death | 14C dates (CE, Cal 2-sigma) |
| KRA001 | Male | 25-35 | 1058-1219 |
| KRA002 | Female | 20-22 | 1227-1283 |
| KRA003 | Male | 25 | 1059-1223 |
| KRA004 | Male | 15 | 1284-1392 |
| KRA005 | Male | 10-12 | 1170-1258 |
| KRA006 | Female | 30-40 | 1218-1266 |
| KRA007 | Female | 25-30 | 1167-1251 |
| KRA008 | Male | 20 | 1301-1402 |
| KRA009 | Male | Unknown | 1158-1254 |
| KRA010 | Male | 25 | 1276-1383 |
| KRA011 | Female | 30-45 | 1040-1159 |
Table 1: Genetically determined sex, archaeologically determined estimated age at death, and radiocarbon dating (14C Cal 2-sigma) for all the 11 individuals sampled. This table has been adapted from Parker, C. et al. 202011.
These protocols allow for a relatively straightforward and efficient generation of bone powder from eight anatomical sampling locations across five skeletal elements (including the pars petrosa) with limited laboratory-induced DNA contamination. Of these five skeletal elements, seven anatomical sampling locations found on four skeletal elements have been determined to be viable alternatives to the destructive sampling of the petrous pyramid11,12. These include the cementum, dentin, and pulp chamber of permanent molars; cortical bone gathered from the superior vertebral notch as well as from the body of thoracic vertebrae; cortical bone stemming from the inferior surface of the apical tuft and shaft of the distal phalanges; and the dense cortical bone along the exterior portion of the tali. While there are several widely applied methods for the sampling of the pars petrosa4,12,13,14, dentin, and the dental pulp chamber1,2,15, published methods describing the successful generation of bone powder from the cementum16, vertebral body, inferior vertebral notch, and talus can be difficult to obtain. As such, here we demonstrate optimized sampling protocols for the petrous pyramid (step 3.1); cementum (step 3.2.1), dentin (step 3.2.2), and dental pulp (step 3.2.3) of adult molars; cortical bone of the vertebral body (step 3.3.1) and superior vertebral arch (step 3.3.2); the distal phalanx (step 3.4); and the talus (step 3.5) in order to make the effective use of these skeletal elements for both aDNA and forensic research more widely accessible.
Protocol
All research presented herein was performed in compliance with the guidelines set forth by the Max Planck Institute for the Science of Human History, Jena, Germany for working with ancient human remains. Before performing any steps of this protocol ensure to adhere to all local/state/federal ethical requirements pertaining to both obtaining permission for the scientific study and use of human remains for destructive sampling in your area. All procedures/chemical storage should be performed according to individual institutional safety guidelines.
1. Considerations before sample processing
- Treat samples with care as ancient remains are an irreplicable and finite resource (e.g., sampling should be as minimally wasteful as possible, and all remains returned to their respective and lawful providers if possible).
- Perform all steps in a clean-room environment, preferably at a dedicated ancient DNA facility17,18,19. Use personal protective equipment (PPE) consisting of sterile microporous coveralls with hood, sterile gloves (two pairs), surgical mask, protective eyewear, and sterile boots or non-slip shoes with sterile covers (see Table of Materials). Change gloves frequently, especially between samples.
- Clean and disinfect all equipment and surfaces thoroughly with bleach/DNA decontamination solution/ethanol and UV irradiation (wavelength: 254 nm) where possible (e.g., drill bits, drills, vises/clamps, etc.). Finally, it is highly recommended to take regular ergonomic breaks (every 2-3 h if possible) to avoid over-exhaustion due to the clean-room environment.
NOTE: All skeletal remains should be appropriately documented (e.g., photographed, weighed, and if possible micro-CT scanned, 3D imaged, etc.) before sampling (protocols for appropriate documentation are not covered in this manuscript). All sampling protocols may be paused between sampling iterations and the samples can be stored indefinitely in a dry, temperature controlled (25 °C), sterile environment.
2. Pretreatment
- Decontaminate all anatomical sampling locations prior to bone powder generation to minimize the risk of contamination18.
NOTE: The efficacy of bleach and/or surface removal (see NOTE in step 3.3.2 for surface removal steps) for sample decontamination is still a matter of debate among aDNA researchers8,19,20,21,22,23,24,25 as both may influence overall DNA yields, especially in highly degraded samples. As such, the following steps are considered optional and are included here as they were used in all samples to generate the representative results presented in this paper. It is recommended that the use of these pre-treatment protocols be determined on a case-by-case basis based on the molecular application, age, rarity, and level of morphological degradation of each sample set.- Perform all sampling in a dedicated clean room under a UV light equipped polymerase chain reaction (PCR) hood or biosafety cabinet with airflow turned off. Spread sterile aluminum foil across the benchtop to catch any stray bone powder/fragments.
- Ensure all bone fragments are recovered (for repatriation) before disposing of the foil. Change the foil between the treatment of each skeletal element. Dispose of used foil in an autoclavable biohazard bag/receptacle.
- Remove as much loose dirt/detritus as possible from anatomical sampling locations by gently wiping the area with a lint-free dry sterile wipe (see Table of Materials). Dispose of the wipes in autoclavable biohazard bags or receptacles.
- Decontaminate the cleaned surface by wiping with a sterile wipe moistened with diluted commercial bleach (~0.01% v/v, diluted with ultrapure DNase/RNase free water) and allow to incubate for 5 min. Dispose of the wipes in autoclavable biohazard bags or receptacles.
CAUTION: Bleach is a highly corrosive and reactive chemical; hence appropriate safety precautions should be in place before its use. - Remove as much residual bleach as possible from the anatomical sampling location with a sterile wipe moistened with ultrapure DNase/RNase-free water. Dispose of the wipes in autoclavable biohazard bags or receptacles.
- Expose all cleaned anatomical sampling locations to UV radiation for 30 min (wavelength: 254 nm), and then allow to dry fully at room temperature. Ensure that the anatomical sampling locations are completely dry before proceeding with sampling or returning to storage to not only make bone powder generation easier but also to prevent further degradation of the sample (e.g., mold).
CAUTION: Exposure to UV radiation can be harmful to the eyes. - Move immediately to sampling or store skeletal elements in a dry, temperature controlled (25 °C) sterile environment.
3. Bone powder generation
NOTE: The following protocols are intended for use in DNA extraction following the Dabney et al. 2019 protocol26.
- Sampling of pars petrosa
NOTE: This protocol is adapted from procedures described in Pinhasi et al. 20194 and is presented here for ease of use. This protocol does not represent the current, least destructive method for the sampling of pars petrosa. As such, it is recommended to use the protocol described by Sirak et al. 201713 or Orfanou et al. 202014 for samples where morphological preservation is of maximum importance.- Perform all sampling in a dedicated clean room under a UV light equipped PCR hood or biosafety cabinet (wavelength: 254 nm) with airflow turned off. Spread sterile aluminum foil across the benchtop to catch any stray bone powder/fragments.
- Ensure all bone fragments and as much powder as possible is recovered (for repatriation) before disposing of foil. Change the foil between each sampling. Dispose of the used foil in an autoclavable biohazard bag/receptacle.
- Secure the dry, decontaminated element using a sterilized clamp or vise.
- Cut the pars petrosa in half along the superior sulcus petrosus (see Figure 1) using a standard jeweler's saw equipped with a 0.6 mm blade (see Table of Materials) at medium speed to avoid overheating (see NOTE below step 3.1.6).
CAUTION: The pars petrosa is very dense, and as such may be difficult to cut. Take care to keep the element securely clamped to avoid injury. Dispose of any broken saw blades in the appropriate sharps' receptacle. - Remove the petrous portions from the clamp. Recover and save any loose/excess material.
- Place weigh paper in a sterile weighing boat
- Hold the petrous portion over the weigh paper, cut side tilted toward the weighing tray. Drill into the dense cortical bone between the facial canal and mastoid antrum (appears shinier than the surrounding material, see Figure 1) using dental drill equipped with a small gauge bit (see Table of Materials) and set to medium speed, medium torque to produce bone powder.
NOTE: Drilling/Cutting should be done in short bursts at low to medium speeds to avoid overheating the bone and potentially destroying/damaging DNA. Anecdotally, when the dense portion of the petrous begins to overheat a smell described as cooking bacon may be observed. Cease drilling/sawing immediately and allow the bone to rest until sufficiently cool before resuming. - Repeat drilling until approximately 50-100 mg of powder is collected in the weigh paper, as measured using an enclosed balance accurate to at least 0.01 mg (see Table of Materials).
NOTE: Where possible it is suggested to gather 100 mg of bone powder to allow for two replicate DNA extraction of 50 mg each. However, this may not always be possible based on either limitation of the anatomical sampling locations themselves (e.g., the distal phalanx, dental pulp chamber) or the need for morphological preservation. For other locations, such as the cementum, considerably less than 50 mg of the material may be available. However, the cementum, dental pulp chamber, and distal phalanx have all been shown to yield significant endogenous DNA11,27,28, despite lower initial input of bone powder from the extraction process. - Transfer powder from the weigh paper to a 2 mL labeled low-bind, safe-lock tube for extraction or storage. Store samples at -20 °C, indefinitely.
- Store remaining bone/excess powder in a dry, temperature controlled (25 °C) sterile environment until return/repatriation can be completed.
- Dispose of all waste in autoclavable biohazard bags or receptacles. Sterilize/decontaminate all reusable equipment (e.g., clamps, drill bits, drills, saws, etc.) using bleach/DNA decontamination solution/ethanol and UV (wavelength: 254 nm) exposure, as applicable, between each sampling.

Figure 1: Temporal bone including the pars petrosa. (A) Sample pre-cutting showing the locations of the petrous pyramid and the sulcus petrosa. (B) Petrous portion post-cutting highlighting the dense areas to be drilled. Please click here to view a larger version of this figure.
- Sampling of permanent molars
NOTE: For the sampling of permanent molars, pre-select in situ molars with fused roots and ideally void of caries, cracks in the enamel, or excessive wear for best results. Remove any dental calculus sampling and store at -20 °C for possible future analyses of the oral microbiome (procedure not covered here).- Sampling of the cementum
- Perform all sampling in a dedicated clean room under a UV light equipped PCR hood or biosafety cabinet (wavelength: 254 nm) with airflow turned off. Spread sterile aluminum foil across the benchtop to catch any stray bone powder/fragments.
- Ensure all bone fragments and as much powder as possible are recovered (for repatriation) before disposing of foil. Change the foil between each sampling. Dispose of used foil in an autoclavable biohazard bag/receptacle.
- Place a sheet of weigh paper into a sterile weighing tray.
- Hold/secure the decontaminated molar by the enamel, root down, over a weighing tray using a hand-held clamp such as an adjustable wrench (see Table of Materials).
- Equip a dental drill with a diamond-edged circular cutting wheel. With the drill set to a medium speed/torque setting, lightly touch the edge of the bit to the root at an angle of approximately -20°.
- Scrape downward into the tray to remove/collect the yellow, outermost material from the root (cementum). Stop collection when the lighter (white) material of the dentin becomes visible.
NOTE: It is important to match the direction of rotation of the cutting bit in relation to the collection tray to avoid the powder becoming aerosolized and potentially wasting the sample by missing the tray entirely. The cementum is particularly rich in DNA; however, typical yields of material are much smaller than other anatomical sampling locations (~7-20 mg)11,27,28. - Record mass of powder collected in weigh paper using an enclosed balance accurate to at least 0.01 mg (see Table of Materials).
- Transfer powder from the weigh paper to a 2 mL low-bind, safe lock tube for extraction. Store at -20 °C, indefinitely.
- Sampling of the pulp chamber
- After the cementum has been collected (if desired), section the molar along the cemento-enamel junction using a jeweler's saw to remove the crown (see Figure 2).
- Place a new sheet of weigh paper in a new weighing tray.
- Secure the crown section in a handheld clamp or vise, over the weighing tray. Hold cut side tilted downward and drill/scrape material as the first pass with a dental drill equipped with a small gauge drilling bit (see Table of Materials) along the edges of the pulp chamber within the crown portion (see Figure 2).
NOTE: Only the first pass of the interior of the pulp chamber is to be collected and labeled as pulp material (5-15 mg typical yield), anything deeper into the tooth is considered dentin. - Turn the tooth with the inferior portion facing down, tap the clamp with a hammer, and collect the liberated powder on the weigh paper.
- Record the weight of the powder collected in the weigh paper using an enclosed balance accurate to at least 0.01 mg (see Table of Materials).
- Transfer powder from the weigh paper to a 2 mL low-bind, safe-lock tube for extraction. Store at -20 °C, indefinitely.
- Sampling of the dentin
- Place a new sheet of weigh paper in a new weighing tray.
- Hold the crown section over the weighing tray (as per step 3.2.2.3), drill out and collect further 50-100 mg of dentin as measured using an enclosed balance accurate to 0.01 mg (see Table of Materials) from the interior of the pulp chamber in the same manner for further dentin sampling (see Figure 2).
- Transfer bone powder from the weigh paper to a 2 mL low-bind, safe-lock tube for extraction. Store at -20 °C, indefinitely.
- Store the remaining tooth pieces/excess powder in a dry, temperature controlled (25 °C) sterile environment until return/repatriation can be completed.
- Dispose of all waste in autoclavable biohazard bags or receptacles. Sterilize/decontaminate all reusable equipment (e.g., clamps, drill bits, drills, saws, etc.) using bleach/DNA decontamination solution/ethanol and UV (wavelength: 254 nm) exposures as applicable, between each sampling.
- Sampling of the cementum
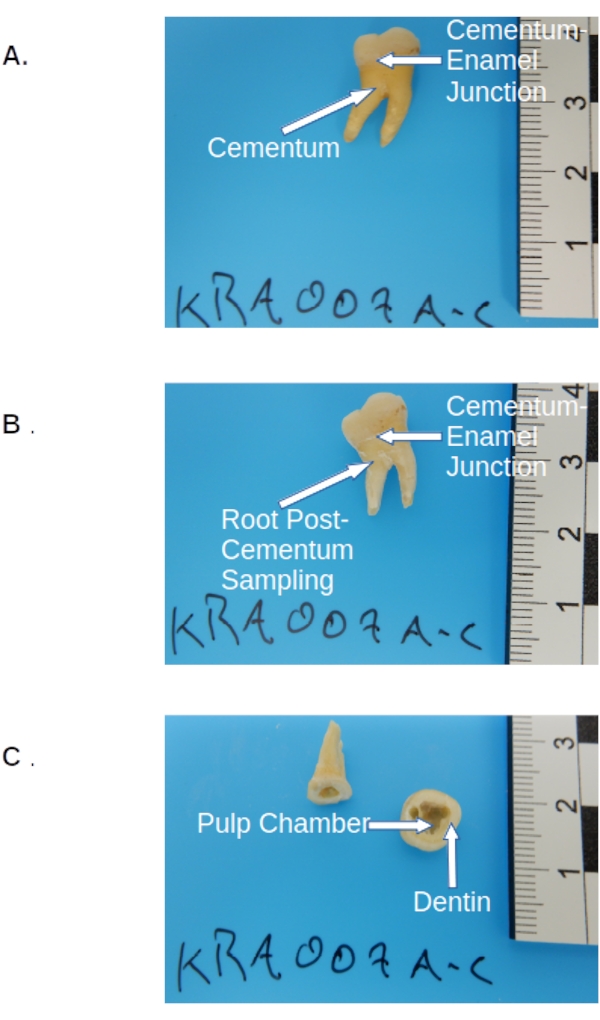
Figure 2: Permanent molar pre-sampling. (A) Pre-treated molar prior to sampling, showing crown, cementum (yellowish layer of the root), and the cutting site at the cemento-enamel junction. (B) The same molar post-cementum collection, showing the cut site at the cemento-enamel junction. (C) Molar post-cutting and sampling showing anatomical sampling locations for the dental pulp chamber and dentin within the crown. Please click here to view a larger version of this figure.
- Sampling of the thoracic vertebrae
- Sampling of the vertebral body
- Perform all sampling in a dedicated clean room under a UV light equipped PCR hood or biosafety cabinet (wavelength: 254 nm) with airflow turned off. Spread sterile aluminum foil across the benchtop to catch any stray bone powder/fragments.
- Ensure all bone fragments and as much powder as possible are recovered (for repatriation) before disposing of foil. Change the foil between each sampling. Dispose of used foil in an autoclavable biohazard bag/receptacle.
- Place a small sheet of weigh paper into a standard weighing tray.
- Secure the vertebrae with a clamp or hand vise, with the vertebral body outward.
- Hold the vertebrae over the weighing tray with the vertebral body tilted downward. Using a dental drill equipped with a small gauge drilling bit (see Table of Materials) set to low-speed high torque, drill along the outermost rim (inferior and superior) of the cortical bone surrounding the cancellous inner tissue of the vertebral body (see Figure 3).
- Scrape the bit against the cortical layer over a standard weighting tray until 50-100 mg of material is collected, as measured using an enclosed balance accurate to 0.01 mg (see Table of Materials).
- Transfer bone powder from the weigh paper to a 2 mL low-bind, safe lock tube for extraction. Store at -20 °C, indefinitely.
- Sampling of the superior vertebral arch
NOTE: This step is optional. Remove and discard the outermost layer of the cortical bone of the superior vertebral arch using a dental drill equipped with a small gauge drilling bit (see Table of Materials) by scraping it along the surface19. This is not suggested for sampling from the vertebral body, as the layer of cortical bone is generally very thin and likely to be entirely depleted by this process (see NOTE in section 2).- Place a small sheet of weigh paper into a standard weighing tray.
- Secure the vertebrae in a hand clamp/vise with the vertebral process outward, superior aspect down.
- While holding the vertebrae, superior aspect down, over a weighing tray, drill upwards into the center of the V shaped notch formed by the fusion of the spinous process with the lamellae (see Figure 3) using a dental drill with a small gauge bit (see Table of Materials) set to low speed and high torque.
- Cease drilling when there is a noticeable drop in resistance. Change the drilling position slightly and repeat until 50-100 mg of bone powder is collected, as measured using an enclosed balance accurate to 0.01 mg (see Table of Materials).
- Transfer bone powder from the weigh paper to a 2 mL low-bind tube for extraction. Store at -20 °C, indefinitely.
- Store remaining bone/excess powder in a dry, temperature controlled (25 °C) sterile environment until return/repatriation.
- Dispose of all waste in autoclavable biohazard bags or receptacles. Sterilize/decontaminate all reusable equipment (e.g., clamps, drill bits, drills, saws, etc.) using bleach/DNA decontamination solution/ethanol and UV (wavelength: 254 nm) exposure, as applicable, between each sampling.
- Sampling of the vertebral body

Figure 3: Vertebral body and superior vertebral arch cortical bone anatomical sampling locations of the thoracic vertebra. Please click here to view a larger version of this figure.
- Sampling of the distal phalanx
NOTE: This step is optional. Remove and discard the outermost layer of the cortical bone of the shaft and/or apical tuft using a dental drill equipped with a small gauge drilling bit by scraping it along the surface19. This may not be possible for samples with excessively thin cortical bone or juvenile remains (see NOTE in section 2).- Perform all sampling in a dedicated clean room, under a UV light equipped PCR hood or biosafety cabinet (UV wavelength: 254 nm) with airflow turned off. Spread sterile aluminum foil across the benchtop to catch any stray bone powder/fragments.
- Ensure all bone fragments and as much powder as possible are recovered (for repatriation) before disposing of foil. Change the foil between each sampling. Dispose of used foil in an autoclavable biohazard bag/receptacle.
- Place a small sheet of weigh paper into a standard weighing tray.
- Secure the sample in handheld clamp/vise, superior side upwards.
- Hold the sample over the weighing tray, collect bone powder from the cortical bone from the inferior side of the apical tuft and shaft by drilling through the outermost dense layers (see Figure 4) using a dental drill equipped with a small gauge drilling bit (see Table of Materials).
- Cease drilling when there is a marked decrease in resistance, as this signifies lighter, cancellous material. Repeat this process, radiating outward from the initial drilling until at least 50-100 mg of bone powder is collected, as measured using an enclosed balance accurate to 0.01 mg (see Table of Materials).
- Transfer bone powder from the weigh paper to a 2 mL low-bind, safe-lock tube for extraction. Store at -20 °C, indefinitely.
- Store the remaining bone/excess powder in a dry, temperature controlled (25 °C) sterile environment until return/repatriation.
- Dispose of all waste in autoclavable biohazard bags or receptacles. Sterilize/decontaminate all reusable equipment (e.g., clamps, drill bits, drills, saws, etc.) using bleach/DNA decontamination solution/ethanol and UV exposure, as applicable, between each sampling.
NOTE: For smaller samples (e.g., juvenile samples) there may be considerably less than the suggested 50-100 mg of cortical bone available to sample. However, even in low quantities, this anatomical sampling location has been shown to be particularly rich in DNA11.

Figure 4: Distal phalanx showing the locations of dense cortical bone along the shaft and inferior side of the apical tuft. Please click here to view a larger version of this figure.
- Sampling of the Talus
- Perform all sampling in a dedicated clean room under a UV light equipped PCR hood or biosafety cabinet (wavelength: 254 nm) with airflow turned off. Spread sterile aluminum foil across the benchtop to catch any stray bone powder/fragments.
- Ensure all bone fragments and as much powder as possible are recovered (for repatriation) before disposing of foil. Change the foil between each sampling. Dispose of used foil in an autoclavable biohazard bag/receptacle.
- Place a small sheet of weigh paper into a standard weighing tray.
- Secure the sample in handheld clamp/vise, dome upwards.
- Hold the talus, dome upward, and medial surface toward the collector, over the weighing tray. Scrape cortical bone from the neck of the talus to a depth of ~1 mm (see Figure 5) using a dental drill with a low gauge bit (see Table of Materials) set to low speed and high torque.
- Change the drilling position slightly and repeat until approximately 50-100 mg of bone powder is collected, as measured using an enclosed balance accurate to 0.01 mg (see Table of Materials).
- Transfer bone powder from the weigh paper to a 2 mL low-bind tube for extraction. Store at -20 °C, indefinitely.
- Store the remaining bone/excess powder in a dry, temperature controlled (25 °C) sterile environment until return/repatriation can be completed.
- Dispose of all waste in autoclavable biohazard bags or receptacles. Sterilize/decontaminate all reusable equipment (e.g., clamps, drill bits, drills, saws, etc.) using bleach/DNA decontamination solution/ethanol and UV (wavelength: 254 nm) exposure, as applicable, between each sampling.

Figure 5: Sampling area of the talus for cortical bone recovery. Please click here to view a larger version of this figure.
NOTE: The talus has very little cortical bone (a thin outer layer). The material should not only be collected from the surface but also the underlying dense layer of cancellous bone.
Results
In a separate study11, DNA was extracted from bone powder generated from each anatomical sampling location in 11 individuals, using a standard DNA extraction protocol optimized for short fragments from calcified tissue2. Single-stranded libraries were then produced28 and sequenced on a HiSeq 4000 (75 bp paired-end) to a depth of ~20,000,000 reads per sample. The resulting sequence data was then evaluated for endogenous human DNA content using the EAGER pipeline29 (BWA settings: Seed length of 32, 0.1 mismatch penalty, mapping quality filter of 37). All representative results are reported using the same metrics as Parker et al. 202011 for consistency. Libraries from the powdered portions of the pars petrosa yielded, on average, higher endogenous DNA than any of the other 23 anatomical sampling locations surveyed (Figure 6A-B). The seven additional anatomical sampling locations presented in this protocol (the cementum, first pass of the dental pulp chamber, and dentin of permanent molars; cortical bone from the vertebral body and superior vertebral arch of the thoracic vertebra; cortical bone from the apical tuft of the distal phalanx; and cortical bone from the neck of the talus) produced the next highest yields (with no statistical significance between these anatomical sampling locations; Figure 6A-B; Supplemental File 1: EndogenousDNAPreCap). These alternative locations all consistently produced DNA yields adequate for standard population genetics analyses such as mitochondrial analyses and single nucleotide polymorphism (SNP) analyses. Duplication rates in libraries stemming from all anatomical sampling locations were low (cluster factors < 1.2 on average, calculated as the ratio of all mapping reads to unique mapping reads, Table 2; Supplemental File 1: ClusterFactor), indicating that all libraries screened were of very high complexity. Similarly, average exogenous human DNA contamination estimates were low, averaging < 2% (X chromosome contamination in males, n = 7, as reported by the ANGSD30 pipeline) in all anatomical sampling locations except for the superior vertebral arch (average estimated contamination: 2.11%, with one sample removed as an outlier; KRA005: 19.52%, see Table 2; Supplemental File 1: Xcontamination). Average fragment length (after filtering to remove all reads < 30 bp) was lowest in the material collected from the dental pulp chamber and dentin, with no significant variation among other anatomical sampling locations (55.14 bp and 60.22 bp, respectively in comparison to an average median of 62.87, pair-wise p-values < 0.019, Table 2; Supplemental File 1: AvgFragLength). Additionally, the teeth and thoracic vertebrae each contain multiple anatomical sampling locations where high endogenous DNA recovery was observed, making them particularly suitable as alternatives to the pars petrosa.
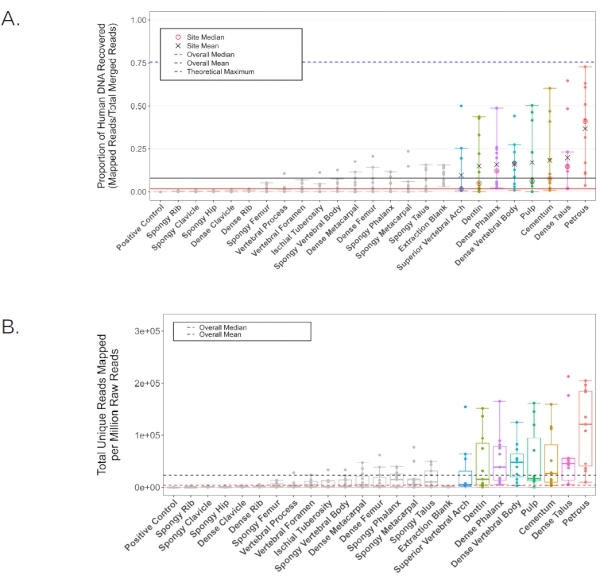
Figure 6: Human DNA content for all screened samples. Black lines represent the overall mean, while red lines represent the median (solid: human DNA proportion, dashed: mapped human reads per million reads generated). Individual anatomical sampling locations with an average human DNA proportion higher than the overall mean (8.16%) are colorized in all analyses. (A) The proportion of reads mapping to the hg19 reference genome. The blue dashed line represents the theoretical maximum given the pipeline's mapping parameters (generated using Gargammel31 to simulate a random distribution of 5,000,000 reads from the hg19 reference genome with simulated damage). Individual means (black X) and medians (red circle) are reported for those samples with a higher average human DNA proportion than the overall mean. Confidence intervals indicate upper and lower bounds excluding statistical outliers. (B) The number of unique reads mapping to the hg19 reference genome per million reads of sequencing effort (75 bp paired end). Confidence intervals indicate upper and lower bounds excluding statistical outliers. This figure has been adapted from Parker, C. et al. 202011. Please click here to view a larger version of this figure.
Table 2: Average duplication levels (mapping reads/unique reads), average and median fragment lengths, and X chromosome contamination estimates for all anatomical sampling locations. Error reported as the standard error of the mean. This table has been adapted from Parker, C. et al. 202011.
| Sampling location | Average duplication factor (# mapped reads /# unique mapped reads) | Average fragment length in bp | Average estimated proportion of X chromosome contamination |
| Petrous pyramid | 1.188 ± 0.006 | 65.40 ± 1.36 | 0.000 ± 0.003 |
| Cementum | 1.197 ± 0.028 | 67.28 ± 1.76 | 0.011 ± 0.003 |
| Dentin | 1.188 ± 0.061 | 60.22 ± 2.37 | 0.002 ± 0.007 |
| Pulp | 1.179 ± 0.024 | 55.14 ± 2.90 | 0.013 ± 0.006 |
| Distal phalanx | 1.191 ± 0.049 | 65.95 ± 1.08 | 0.013 ± 0.005 |
| Vertebral body | 1.194 ± 0.037 | 66.14 ± 1.03 | 0.008 ± 0.003 |
| Superior vertebral arch | 1.19 ± 0.017 | 63.02 ± 1.23 | 0.021 ± 0.009* |
| Talus | 1.198 ± 0.010 | 68.20 ± 1.24 | 0.011 ± 0.003 |
| *Sample KRA005 removed as an outlier at 0.1952 |
Code availability
All analyses programs and R modules used in the analyses of this manuscript are freely available from their respective authors. All custom R code is available by request.
Data availability
All raw data used in the calculation of representative results is freely available in the European Nucleotide Archive ENA data repository (accession number PRJ-EB36983) or supplemental materials of Parker, C. et al.11.
Supplemental File 1. Please click here to download this File.
Discussion
Current practice in ancient human population genetics is to preferentially sample from the pars petrosa (step 2.1) whenever possible. However, the pars petrosa can be a difficult sample to obtain, as it is highly valued for a myriad of skeletal assessments (e.g., population history32, the estimation of fetal age at death33, and sex determination34), and, historically, sampling of the pars petrosa for DNA analysis can be highly destructive3,4 (including the protocol presented here, although new, minimally invasive protocols13,14 have now been widely adopted to alleviate this concern). This is compounded by the fact that, until very recently, a large-scale, systematic study of human DNA recovery across the skeleton had not been attempted11, making finding an appropriate sampling strategy when the petrous pyramid is unavailable challenging.
The protocols presented here help to alleviate that challenge by providing a set of optimized procedures for DNA sampling from archaeological/forensic skeletal remains including the pars petrosa as well as seven alternate anatomical sampling locations across four additional skeletal elements. The critical steps included are all intended to minimize the possibility of DNA loss/damage due to either inefficient sampling (steps 2.1.6 and 3.2.1.3) or overheating of samples during drilling/cutting (step 3.1.6). Additionally, it has been noted throughout the protocol that it may be necessary to modify/omit the pre-treatment steps to ensure the best performance in highly degraded samples. It should also be noted that even among the selected elements presented here, there remain several possible alternative sampling techniques (particularly for the pars petrosa13,14), as well as ample room for further optimization of the underexploited anatomical sampling locations presented here (i.e., the talus: step 2.5 and the vertebrae: step 2.3).
It is also important to keep in mind that these protocols have been designed and tested using ancient juvenile-adult remains of high quality (good morphological preservation) for the purposes of endogenous human DNA analyses. The results presented may not extend to more highly degraded materials, other preservation contexts, infant remains, non-human remains, or studies of pathogens or the microbiome, as a greater exploration into the use of these protocols in additional contexts is still needed. Additionally, the alternative skeletal elements presented here (the teeth, vertebrae, distal phalanx, and tali) may be challenging to assign to a single individual among commingled remains, necessitating sampling from multiple elements to ensure a single origin. Despite these limitations, making these protocols widely available can help alleviate some of the heterogeneity surrounding sample selection and processing by providing a generalized and quantitatively optimized framework for use in a wide range of future aDNA/forensic studies on human remains.
Disclosures
The authors have no conflicts of interest to report.
Acknowledgements
The authors would like to thank the laboratory staff of the Max Planck Institute for the Science of Human History for their help in the development and implementation of these protocols. This work would not have been possible without the input and hard work of Dr. Guido Brandt, Dr. Elizabeth Nelson, Antje Wissegot, and Franziska Aron. This study was funded by the Max Planck Society, the European Research Council (ERC) under the European Union's Horizon 2020 research and innovation program under grant agreements No 771234 - PALEoRIDER (WH, ABR) and Starting Grant No. 805268 CoDisEASe (to KIB).
Materials
| Name | Company | Catalog Number | Comments |
|---|---|---|---|
| #16 Dental Drill Bit | NTI | H1-016-HP | example drilling bit |
| 0.6 mm scroll saw blade | Fisher Scientific | 50-949-097 | blade for Jewellers Saw |
| 22mm diamond cutting wheel | Kahla | SKU 806 104 358 514 220 | Dremel cutting attachment |
| Commercial Bleach | Fisher Scientific | NC1818018 | |
| Control Company Ultra-Clean Supreme Aluminum Foil | Fisher Scientific | 15-078-29X | |
| DNA LoBind Tubes (2 mL) | Eppendorf | 22431048 | |
| Dremel 225-01 Flex Shaft Attachment | Dremel | 225-01 | Dremel flexible extension |
| Dremel 4300 Rotary Tool | Dremel | 4300 | Example drill |
| Dremel collet and nut kit | Dremel | 4485 | Adapters for various Dremel tool attachments/bits |
| Eagle 33 Gallon Red Biohazard Waste Bag | Fisher Scientific | 17-988-501 | |
| Eppendorf DNA LoBind 2 mL microcentrifuge tube | Fisher Scientific | 13-698-792 | |
| Ethanol (Molecular Biology Grade) | Millipore Sigma | 1.08543 | |
| FDA approved level 2 Surgical Mask | Fisher Scientific | 50-206-0397 | PPE |
| Fisherbrand Comfort Nitrile Gloves | Fisher Scientific | 19-041-171X | PPE |
| Fisherbrand Safety Glasses | Fisher Scientific | 19-130-208X | PPE |
| Granger Stationary Vise | Fisher Scientific | NC1336173 | benchtop vise |
| Invitrogen UltraPure DNase/Rnase free distilled water | Fisher Scientific | 10-977-023 | |
| Jewellers Saw | Fisher Scientific | 50-949-231 | |
| Kimwipes | Sigma-Aldritch | Z188956 | |
| Labconco Purifier Logic Biosafety cabinet | Fisher Scientific | 30-368-1101 | |
| LookOut DNA Erase | Millipore Sigma | L9042-1L | |
| Medium weighing boat | Heathrow Scientific | HS120223 | |
| MSC 10pc plier/clamp set | Fisher Scientific | 50-129-5352 | Miscellaneous clamps/vise grips for securely holding samples while drilling/cutting |
| Sartorius Quintix Semi-Micro Balance | Fisher Scientific | 14-560-019 | enclosed balance |
| Tyvek coveralls with hood | Fisher Scientific | 01-361-7X | PPE |
| Weigh paper | Heathrow Scientific | HS120116 |
References
- Adler, C. J., Haak, W., Donlon, D., Cooper, A. Survival and recovery of DNA from ancient teeth and bones. Journal of Archaeological Science. 38 (5), 956-964 (2011).
- Dabney, J., Meyer, M. Extraction of highly degraded DNA from ancient bones and teeth. Ancient DNA: Methods and Protocols. , 25-29 (2019).
- Palsdottir, A. H., Bläuer, A., Rannamäe, E., Boessenkool, S., Hallsson, J. Not a limitless resource: ethics and guidelines for destructive sampling of archaeofaunal remains. Royal Society Open Science. 6 (10), 191059(2019).
- Pinhasi, R., Fernandes, D. M., Sirak, K., Cheronet, O. Isolating the human cochlea to generate bone powder for ancient DNA analysis. Nature Protocols. 14 (4), 1194-1205 (2019).
- Latham, K. E., Miller, J. J. DNA recovery and analysis from skeletal material in modern forensic contexts. Forensic Sciences Research. 4 (1), 51-59 (2019).
- Mundorff, A. Z., Bartelink, E. J., Mar-Cash, E. DNA preservation in skeletal elements from the World Trade Center disaster: Recommendations for mass fatality management. Journal of Forensic Sciences. 54 (4), 739-745 (2009).
- Gamba, C., et al. Genome flux and stasis in a five millennium transect of European prehistory. Nature Communications. 5 (1), 1-9 (2014).
- Alberti, F., et al. Optimized DNA sampling of ancient bones using Computed Tomography scans. Molecular Ecology Resources. 18 (6), 1196-1208 (2018).
- Hansen, H. B., et al. Comparing ancient DNA preservation in petrous bone and tooth cementum. PLoS ONE. 12 (1), 0170940(2017).
- Sirak, K., et al. Human auditory ossicles as an alternative optimal source of ancient DNA. Genome Research. 30 (3), 427-436 (2020).
- Parker, C., et al. A systematic investigation of human DNA preservation in medieval skeletons. Scientific Reports. 10 (1), 18225(2020).
- Pinhasi, R., et al. Optimal ancient DNA yields from the inner ear part of the human petrous bone. PLoS ONE. 10 (6), 0129102(2015).
- Sirak, K. A., et al. A minimally-invasive method for sampling human petrous bones from the cranial base for ancient DNA analysis. BioTechniques. 62 (6), 283-289 (2017).
- Orfanou, E., Himmel, M., Aron, F., Haak, W. Minimally-invasive sampling of pars petrosa (os temporale) for ancient DNA extraction. protocols.io. , Available from: https://www.protocols.io/view/minimally-invasive-sampling-of-pars-petrosa-os-tem-bqd8ms9w (2020).
- Damgaard, P. B., et al. Improving access to endogenous DNA in ancient bones and teeth. Scientific Reports. 5 (1), 1-12 (2015).
- Harney, É, et al. A minimally destructive protocol for DNA extraction from ancient teeth. Genome Research. 31 (3), 472-483 (2021).
- Cooper, A., Poinar, H. N. Ancient DNA: Do it right or not at all. Science. 289 (5482), 1139(2000).
- Llamas, B., et al. From the field to the laboratory: Controlling DNA contamination in human ancient DNA research in the high-throughput sequencing era. STAR: Science & Technology of Archaeological Research. 3 (1), 1-14 (2017).
- Llamas, B., et al. From the field to the laboratory: Controlling DNA contamination in human ancient DNA research in the high-throughput sequencing era. STAR: Science & Technology of Archaeological Research. 3 (1), 1-14 (2017).
- Boessenkool, S., et al. Combining bleach and mild predigestion improves ancient DNA recovery from bones. Molecular Ecology Resources. 17 (4), 742-751 (2017).
- García-Garcerà, M., et al. Fragmentation of contaminant and endogenous DNA in ancient samples determined by shotgun sequencing; Prospects for human palaeogenomics. PLoS ONE. 6 (8), 24161(2011).
- Malmström, H., et al. More on contamination: The use of asymmetric molecular behavior to identify authentic ancient human DNA. Molecular Biology and Evolution. 24 (4), 998-1004 (2007).
- Basler, N., et al. Reduction of the contaminant fraction of DNA obtained from an ancient giant panda bone. BMC Research Notes. 10, 754(2017).
- Kemp, B. M., Smith, D. G. Use of bleach to eliminate contaminating DNA from the surface of bones and teeth. Forensic Science International. 154 (1), 53-61 (2005).
- Korlević, P., et al. Reducing microbial and human contamination in DNA extractions from ancient bones and teeth. BioTechniques. 59 (2), 87-93 (2015).
- Dabney, J., Meyer, M. Extraction of highly degraded DNA from ancient bones and teeth. Methods in Molecular Biology. 1963, 25-29 (2019).
- Hansen, H. B., et al. Comparing ancient DNA preservation in petrous bone and tooth cementum. PLoS ONE. 12 (1), 0170940(2017).
- Gansauge, M. -T., et al. Single-stranded DNA library preparation from highly degraded DNA using T4 DNA ligase. Nucleic Acids Research. 45 (10), 79(2017).
- Peltzer, A., et al. EAGER: efficient ancient genome reconstruction. Genome Biology. 17 (1), 60(2016).
- Korneliussen, T. S., Albrechtsen, A., Nielsen, R. ANGSD: analysis of next generation sequencing data. BMC Bioinformatics. 15, 356(2014).
- Renaud, G., Hanghøj, K., Willerslev, E., Orlando, L. Gargammel: A sequence simulator for ancient DNA. Bioinformatics. 33 (4), 577-579 (2017).
- Ponce de León, M. S., et al. Human bony labyrinth is an indicator of population history and dispersal from Africa. Proceedings of the National Academy of Sciences of the United States of America. 115 (16), 4128-4133 (2018).
- Nagaoka, T., Kawakubo, Y. Using the petrous part of the temporal bone to estimate fetal age at death. Forensic Science International. 248, 188(2015).
- Norén, A., Lynnerup, N., Czarnetzki, A., Graw, M. Lateral angle: A method for sexing using the petrous bone. American Journal of Physical Anthropology. 128 (2), 318-323 (2005).
Reprints and Permissions
