The presented method offers an innovative way for engineering biomimetic fiber structures in three-dimensional (3D) scaffolds (e.g., heart valve leaflets). 3D-printed, conductive geometries were used to determine shape and dimensions. Fiber orientation and characteristics were individually adjustable for each layer. Multiple samples could be manufactured in one setup.
Method Article
Combining 3D-Printing and Electrospinning to Manufacture Biomimetic Heart Valve Leaflets
In This Article
Summary
Abstract
Electrospinning has become a widely used technique in cardiovascular tissue engineering as it offers the possibility to create (micro-)fibrous scaffolds with adjustable properties. The aim of this study was to create multilayered scaffolds mimicking the architectural fiber characteristics of human heart valve leaflets using conductive 3D-printed collectors.
Models of aortic valve cusps were created using commercial computer-aided design (CAD) software. Conductive polylactic acid was used to fabricate 3D-printed leaflet templates. These cusp negatives were integrated into a specifically designed, rotating electrospinning mandrel. Three layers of polyurethane were spun onto the collector, mimicking the fiber orientation of human heart valves. Surface and fiber structure was assessed with a scanning electron microscope (SEM). The application of fluorescent dye additionally permitted the microscopic visualization of the multilayered fiber structure. Tensile testing was performed to assess the biomechanical properties of the scaffolds.
3D-printing of essential parts for the electrospinning rig was possible in a short time for a low budget. The aortic valve cusps created following this protocol were three-layered, with a fiber diameter of 4.1 ± 1.6 µm. SEM imaging revealed an even distribution of fibers. Fluorescence microscopy revealed individual layers with differently aligned fibers, with each layer precisely reaching the desired fiber configuration. The produced scaffolds showed high tensile strength, especially along the direction of alignment. The printing files for the different collectors are available as Supplemental File 1, Supplemental File 2, Supplemental File 3, Supplemental File 4, and Supplemental File 5.
With a highly specialized setup and workflow protocol, it is possible to mimic tissues with complex fiber structures over multiple layers. Spinning directly on 3D-printed collectors creates considerable flexibility in manufacturing 3D shapes at low production costs.
Introduction
Cardiovascular disease is the leading cause of death in western countries 1. Although extensive research is done in this field, it is estimated that the burden of degenerative heart valve disease will increase even further during the next years2. Surgical or interventional heart valve replacement is possible as a therapeutic option. At this point, mechanical and bioprosthetic heart valves are available, both with individual drawbacks. Mechanical valves are thrombogenic and require lifelong anticoagulation. Although biological valves do not require anticoagulation, they show a lack of remodeling, a high rate of calcification, and concomitant degradation3.
Tissue-engineered heart valves might be able to address these drawbacks by introducing a microfibrous scaffold into the body that allows in vivo remodeling. Various methods, e.g., electrospinning (ESP), decellularization, micromolding, spray, dip-coat, and 3D-bioprinting, are available. These methods can be chosen for creating specific properties, being cheaper and faster, or just due to a lack of alternatives. Methods and materials can even be combined to create more complex structures4. For example, ESP has been a standard technique for creating scaffolds in tissue engineering, allowing for the combination of different materials and the adjustment of fiber diameters, fiber orientations, and porosities4. Furthermore, a variety of postprocessing techniques allow for optimized tissue remodeling, improved hemocompatibility, and adjustable biodegradation of electrospun scaffolds5,6,7.
Basic ESP uses either static or rotating collectors, which have a direct influence on the degree of fiber alignment and the obtained fiber diameters8. Due to manufacturing restrictions, classic ESP rotating collectors consist of rotating drums, discs, wires, or metal rods. The introduction of 3D-printing allows for the creation of more individualized collector geometries that are not limited by traditional manufacturing techniques. This individualization is especially useful for the creation of 3D constructs such as heart valve leaflets.
The natural three-layered (fibrosa, spongiosa, ventricularis) architecture of human heart valve leaflets is the tissues' response to the mechanical forces and shear stress they are exposed to during the cardiac cycle9,10. The fibers of the lamina fibrosa are oriented circumferentially, whereas the fibers of the lamina spongiosa are randomly aligned and those of the lamina ventricularis radially. A triple-layer with the corresponding fiber orientations is thus proposed to mimic the properties of these valves in a tissue-engineered scaffold.
The workflow protocol describes an innovative method to produce three-layered, 3D heart valve leaflets using 3D-printing and electrospinning. Additionally, a quality control step is presented to ensure accurate fiber orientation in every layer.
Protocol
1. Preparatory work
- 3D printing
NOTE: The following steps require the download of the "Standard Triangle Language" (STL) files provided as Supplemental File 1, Supplemental File 2, Supplemental File 3, Supplemental File 4, and Supplemental File 5 with this manuscript. Collector parts are provided as STL-files. The connecting flange is provided as "STandard for the Exchange of Product model data" (STEP) file to allow adjustment of the collector to fit individual setups. Furthermore, a technical drawing for the central metal rods is provided for conventional manufacturing as Supplemental File 6.- Open the slicing software (see the Table of Materials) and configure the active printhead for nonconductive polylactic acid (PLA) and a 0.4 mm nozzle.
NOTE: Slicing software, filament, and nozzle diameter might vary depending on the available 3D-printer. - Upload the STL-files Specimen_mount_A (Supplemental File 3) and Speciment_mount_B (Supplemental File 4) into the slicing software.
- Rotate the models, so the triangular surfaces are placed on the build plate.
- Mark all parts, right-click, and select Multiply Selected Models. Enter 1 in the prompt Number of Copies and click OK. Place a total of four models on the build plate.
- Set slice thickness to 0.1 mm, wall thickness to 1 mm, infill density to 40%, and uncheck the Generate Support box.
- Click the Slice button | Save to Removable to save the printing file to a USB drive.
- Load nonconductive PLA into the printer and start the print file.
- After the print is completed, remove the models from the build plate and check for warping at the bottom corners.
- In the slicing software, keep the material parameters and replace the models with Collector_Flange (Supplemental File 1 and Supplemental File 5) and Leaflet_Template (Supplemental File 2).
- Rotate the flange, so the flat circular surface is against the build plate. Additionally, rotate the leaflet template, so the square surface is placed directly on the build plate.
- Mark the flange and multiply the model as in step 1.1.4. Type 1 to receive 1 copy and 1 original of the flange model on the build plate.
- Mark the leaflet model and multiply by 8 to receive a total of nine leaflet models, following the steps described in 1.1.4.
- Set slice thickness to 0.1 mm, wall thickness to 1 mm, infill density to 80%, and uncheck the Generate Support box.
- Click the Slice button | Save to Removable to save the new printing file to a USB drive.
- Load conductive PLA into the printer and start the printing process.
- After completion of the print, remove the models from the build plate. Remove individual filament fibers at the bottom of the leaflet negative carefully with a wire cutter if these are present in the leaflet models (as no support structures were used).
- Open the slicing software (see the Table of Materials) and configure the active printhead for nonconductive polylactic acid (PLA) and a 0.4 mm nozzle.
- Spinning solution
CAUTION: Tetrahydrofuran (THF) and dimethylformamide (DMF) are harmful solvents that should not be inhaled or contact the skin. It is strongly recommended to wear solvent-resistant gloves and protective goggles while handling them. When handling them, work under an exhaust hood as they are extremely volatile.- Place a scale under the exhaust hood and position a 200 mL screw-cap glass bottle on it. Tare the scale.
- Pour 50 mL of DMF and 50 mL of THF into the glass bottle. Note the weight of the solvents.
- Place a magnetic bar inside the bottle, place the bottle on a magnetic stirrer, and switch it on.
- Multiply the noted weight by 0.15 (= 15% w/v) and transfer the corresponding amount of polyurethane (PU) slowly into the glass bottle containing the solvent mixture (DIN 1310).
- Close the bottle and stir for at least 12 h at room temperature to obtain a homogeneous solution.
2. Electrospinning setup
- Assembly
NOTE: As the leaflet scaffolds created with the presented collector are relatively small, the optional use of a large diameter drum mandrel (D: 110 mm) is recommended. This allows the creation of larger, multilayered scaffolds, which will be beneficial for microscopic, biocompatibility, and biomechanical assessment.- Assemble the collector using the 3D printed parts and six M3 x 15 screws.
- Use three screws to secure the metal rods to one of the flanges.
- Slide one Specimen_mount_B between the metal bars. Make sure the spaces for templates point in the opposite direction of the flange.
- Fill the three slots of the Specimen_mount_B with heart valve leaflet templates.
- Place Specimen_mount_A on top and fill the spaces with templates.
- Slide another Specimen_mount_A in and fill the spaces with templates.
- Fixate the templates by putting the second Specimen_mount_B on top.
- Put the second flange on top and use the M3 screws to secure it.
NOTE: Ensure that the leaflet templates are all oriented in the same direction (straight edge of the leaflet parallel to the metal rods). - Place the assembled leaflet collector in the electrospinning setup and tightly secure the flanges to the motor axis (i.e., M6 screws and wing nuts) (Figure 1).
CAUTION: As conductive PLA is more brittle than regular PLA, use a torque wrench at 1.4 Nm when fastening bolts that put pressure on the material to avoid snapping. - Place a needle holder 30 cm from the collector.
- Fix a 14 gauge (G) needle with a flat tip in the needle holder and fixate it at the height of the collector's axis.
- Connect a flexible, solvent-resistant (e.g., polytetrafluoroethylene (PTFE)) tube to the Luer-lock port of the needle.
NOTE: DMF and THF dissolve many plastics. It is necessary to use solvent-resistant materials when working with these solvents, e.g., metal and glass tools. When plastic tools are required (i.e., syringe or tubing), make sure to use solvent-resistant materials. - Guide the tube to the syringe pump for later connection of the polymer-filled syringe.
- Connection of power supply unit (PSU)
CAUTION: During the setup, ensure that the power supply is disconnected from the main power source.- Connect two shielded, high-voltage cables to the power supply's anode and cathode.
- Using a crocodile clip, connect the cable connected to the cathode (- pole) to the 14 G needle. Check the connection between clip and needle. Next, guide the high-voltage cable, so it runs outside the spinning area to avoid interference.
- Connect the collector to the anode (+ pole) using a crocodile clip and the second high voltage cable. Use a slip ring or a sliding contact using a stripped cable to create contact at the collector's flange.
- Preparation of the syringe
NOTE: This step should be performed immediately before the spinning process starts.- Fill a 20 mL Luer-lock syringe with the spinning solution prepared in step 1.2.
- Connect the syringe to the solvent-resistant tube and manually push the solution into the tubing system until a droplet is visible at the tip of the needle.
- Place the syringe in the syringe pump. After turning the pump on, enter the following parameters: diameter: 19.129 mm; volume: 5 mL; speed 3 mL/h.
3. Electrospinning process
- Motor test run
NOTE: Manufacturing the collector using 3D-printing might lead to off-center motion of the collector. Therefore, a test run with lower revolution speeds but without high voltage is highly recommended.- Open the motor control software by double-clicking the icon on the computer.
- Connect to the motor control by clicking the Connect button.
- After connecting, select the Profile velocity operation mode and click on the Operation tab located in the upper left corner of the screen.
- Select the Profile velocity tab below the Quick stop button framed by a red line. Type in the following settings: Target velocity: 200 rpm; profile acceleration: 100; profile deceleration: 200; quick stop: 5000.
NOTE: The direction of rotation should be upwards on the needle side, which can be adjusted by changing the sign in the "target velocity" field from "+" to "-." - Start the test run and check the collector for any unbalance. If the collector runs smoothly, proceed with the protocol. Otherwise, stop the motor and readjust the collector as described in step 2.1.9.
- Stop the motor by clicking the Switch on enabled button and change Target velocity to 2,000 rpm.
- Manufacturing process
NOTE: Electrospinning is a process with a high dependency on environmental parameters. Optimal electrospinning results were obtained between 15-20% relative humidity at a temperature between 21 and 24 °C.- First Layer
NOTE: During the setup phase, a dried droplet of PU might have formed at the tip of the needle. Remove the droplet using a long, nonconductive tool, if necessary.- In the motor control software, click the Enable Operation button to switch on the motor.
- Switch on the high-voltage power supply and adjust the voltage for both anode and cathode: minus pole (needle): 18 kV; plus pole (collector): 1.5 kV.
- Start the syringe pump at a flow rate of 3 mL/h.
- Set a timer to 20 min.
- Observe the needle tip for the formation of a tailor cone. Depending on the shape of the cone at the needle tip, adjust the voltage at the cathode in increments of ±100 V until a stable tailor cone is established.
NOTE: If the drop is hanging, the voltage is too low. However, unsteady flow can indicate that voltage is set too high. - Wait for 20 min for the cusp templates to be covered adequately with fibers.
- Turn off the syringe pump.
- Turn off the PSU by flipping the power switch.
- Stop the motor by clicking the Switch on enabled button in the motor control software.
CAUTION: To prevent injury from moving parts in the system, wait until the collector has completely stopped to open the test chamber.
- Second Layer
- In the motor control software, alter the input field Target velocity to 10 rpm.
- Repeat steps 3.2.1.1-3.2.1.9.
- Third Layer
NOTE: Before the scaffolds are fully dry, they are extremely sensitive to mechanical stress. Be very careful when performing steps 3.2.3.2-3.2.3.6. Avoid touching the scaffolds/fibers during these steps, as the scaffold might be rendered useless.- Carefully open the screws connecting the collector flanges to the motor axis and remove the leaflet collector (Figure 2B) from the electrospinning device.
- Using a scalpel, cut the electrospun fibers along the outer contour of each leaflet template (Figure 2C).
- Remove the flange on one side of the collector.
- Pull out the 3D-printed inserts and separate the leaflet templates from the nonconductive triangular holders.
- Rotate all leaflet templates by 90° and reassemble the collector.
- Insert the collector into the electrospinning setup and tightly secure it.
- Again, check for any unbalance before continuing the spinning process.
- In the motor control software, alter the input field Target velocity to 2,000 rpm.
- Repeat steps 3.2.1.1-3.2.1.9.
NOTE: After finishing the electrospinning process, it is highly recommended to flush the tubing and needle with pure DMF to prevent clogging of the tubing.
- Fluorescent dyed scaffolds (optional)
NOTE: Fluorescent dyes are used to make the fibers visible under a conventional fluorescence microscope. This is only necessary while implementing the method and for quality control after new settings have been applied. The use of fluorescent dyes is not recommended when manufacturing scaffolds using established settings.- Divide the spinning solution prepared in step 1.2 into three equal portions in separate bottles.
- Using a scale, measure 1 mg of fluorescent dye for every gram (0.1 wt%) of polymer solution. Repeat for all three fluorescent dyes (i.e., Fluorescein, Texas Red, 4',6-diamidino-2-phenylindole [DAPI]).
- Add the dye to the spinning solution, close the bottle lid, and stir for 2-3 h or until homogenization.
NOTE: To prevent the fluorescent dyes from fading, protect the spinning solution from light as much as possible, i.e., by placing an opaque cover over the magnetic stirrer. The process for fluorescent dyed scaffolds is very similar to the standard process described in steps 3.2.1-3.2.3. - In step 3.2.1, replace the standard syringe with a syringe filled with the spinning solution containing the first fluorescent dye.
- In step 3.2.2, replace the currently used tubing and needle with new or cleaned ones. Subsequently, place a syringe with the spinning solution containing the second fluorescent dye in the syringe pump.
- In step 3.2.3 again, replace the tubing and needle with new or cleaned ones and replace the syringe with one that is filled with spinning solution containing the third fluorescent dye.
NOTE: To avoid delay during the manufacturing process, it is beneficial to use three sets of tubing and needles. Alternatively, the tube and needle can be flushed thoroughly with THF and DMF in-between the production of layers until no spinning solution containing fluorescent dye is left in the system.
- First Layer
4. Postprocessing and sample acquisition
- Postprocessing scaffolds
- Remove the collector from the electrospinning device.
- Using a scalpel, cut each template free at its base as described in step 3.2.3.2.
- Open the collector, as described above, and place the templates, base down, on a tray.
- Place the tray in a drying cabinet overnight at 40 °C.
- After the samples are completely dried, use a scalpel to carefully cut along the edges of the leaflet template to remove surplus fibers.
- Afterward, carefully peel the leaflet scaffold of the template and place it on a tray for further processing.
Results
This protocol is aimed at the development of a triple-layered leaflet scaffold destined for use in cardiovascular tissue engineering of heart valves. It mimics the collagen configuration of the three layers in the native human heart valve. Each layer consists of fibers with an overall diameter of 4.1 ± 1.6 µm (Figure 1).
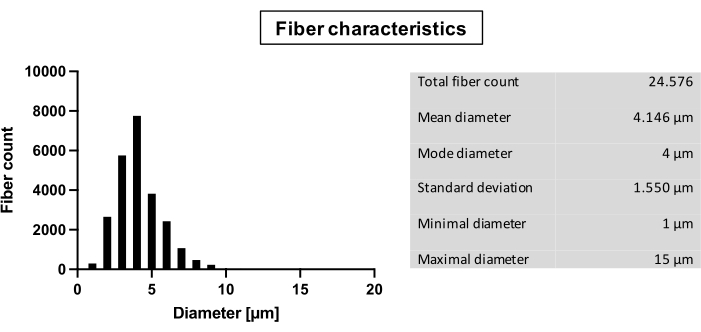
Figure 1: Fiber characteristics. Analysis of fibers: Total fiber count; Diameter in µm: mean, mode, standard deviation, minimal diameter, maximal diameter. Please click here to view a larger version of this figure.
The leaflet templates are designed to fit a Ø 24 mm aortic valve prosthesis (Figure 2C). After drying, the leaflet scaffolds kept their shape of a 3D heart valve cusp (Figure 3A).
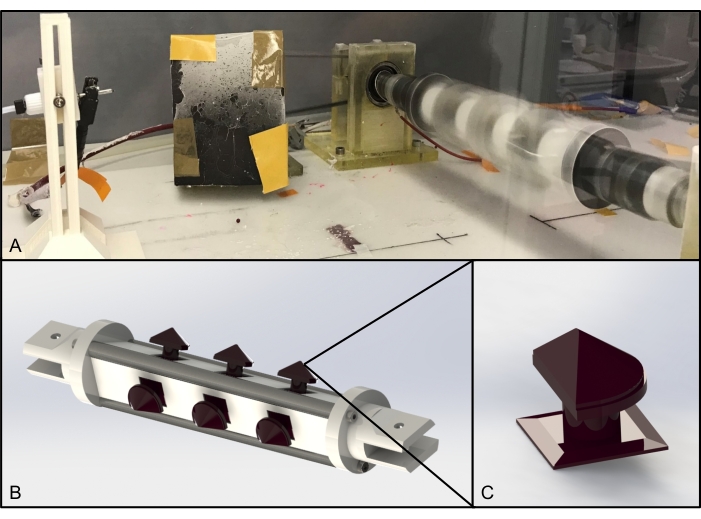
Figure 2: Electrospinning setup. (A) Assembled 3D-printed collector in the rotary setup; (B) CAD rendering of the 3D-printable collector; (C) CAD rendering of the heart valve leaflet negative shown in B; triangle indicates zoomed-in part. Abbreviation: CAD = computer-aided design. Please click here to view a larger version of this figure.
SEM imaging was used to assess the aligned and unaligned layers (TEMP F3512-21). Photographs were taken at 100x, 500x, and 2,000x magnification in three different locations on a scaffold. Aligned fiber scaffolds appear with a smooth surface and strict orientation in the circumferential direction (Figure 3B). Visual analysis of the 2,000x image with respect to the fiber orientation confirms the primary alignment of the fibers (Figure 3C). Unaligned fiber scaffolds show a similarly smooth surface compared to the aligned fibers. Fiber orientation is disordered, with many prominent intersections between fibers (Figure 3D). Subsequent visual analysis confirms the unalignment of fibers with no primary orientation visible (Figure 3E).
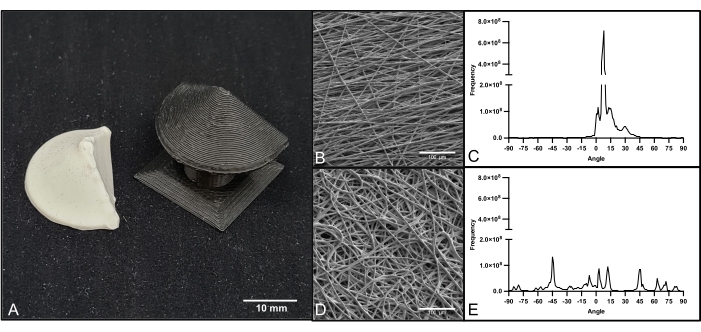
Figure 3: Electrospun leaflet and SEM imaging. (A) Electrospun multilayered leaflet and 3D-printed leaflet collector; (B) SEM image of unaligned fibers (magnification 1,000x); (C) Fiber orientation analysis of unaligned fibers; (D) SEM image of aligned fibers (magnification 1,000x); (E) Fiber orientation analysis of aligned fibers. Scale bars = 10 mm (A), 100 µm (B, D). Abbreviation: SEM = scanning electron microscopy. Please click here to view a larger version of this figure.
Imaging of fluorescent dyed multilayered scaffolds revealed three individual layers with distinct fiber orientations (Figure 4D). The bottom layer (Figure 4A; blue) shows aligned fibers in horizontal orientation with very little intersection between the fibers. The middle layer (Figure 4B; green) shows unaligned fibers with no primary fiber orientation. The top layer (Figure 4C; red) shows aligned fibers in a perpendicular orientation. Visual analysis of the top and bottom layers reveals an average angle between the two layers of 89°, which is in accordance with the 90° rotation of the collector during the spinning process (Figure 4E).
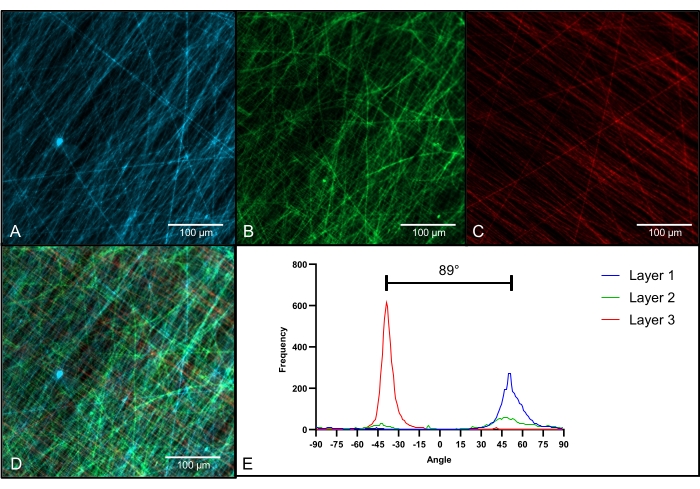
Figure 4: Fluorescence microscopy of multilayered scaffold. (A) Fluorescence image of the first layer with primary orientation from bottom left to top right; (B) Fluorescence image of the second layer with unaligned fiber orientation; (C) Fluorescence image of the third layer with primary orientation from bottom right to top left; (D) Fluorescence image of all three layers combined in one scaffold; (E) Fiber orientation analysis for all three layers (Layer 1: blue; Layer 2: green; Layer 3: red); magnification = 400x (A-D); scale bars = 100 µm (A-D). Please click here to view a larger version of this figure.
Thickness measurement was done on 21 samples (Figure 5A) (TEMP F3510-21). All samples were created applying the same parameters. Temperature and humidity could differ between 20.3 °C and 26.1 °C and 35% and 55% humidity, respectively. The results showed a relatively linear increase in thickness of ~2.65 µm per min.
Another experiment showed the consistency of the results after 60 min of spinning under matching parameters (Figure 5B). Humidity and temperature could differ between 35% and 50% humidity and 20.3 °C to 26.1 °C, respectively. The results were scaffolds between 126 and 181 µm in thickness. The average thickness was 151.11 ± 13.17 µm. The increase in thickness was ~2.52 µm per min, on average.
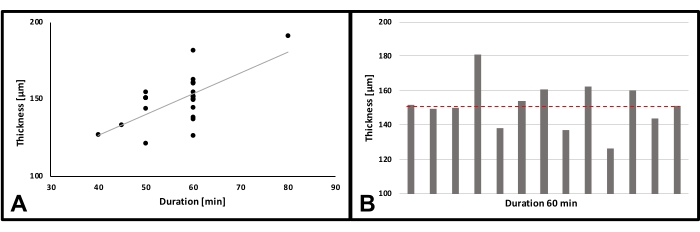
Figure 5: Thickness measurement. (A) Thickness of scaffolds per time spun; n = 21; Correlation coefficient (r) = 0.653; p** = 0.00132; (B) Thickness of samples after 60 min; n = 13; red line: mean. Please click here to view a larger version of this figure.
Tensile tests for aligned and unaligned fiber scaffolds were performed in two directions, along the circumferential direction and perpendicular to it. Each grout consisted of 15 specimens. Samples were taken out of plane scaffolds according to DIN 53504:2017-03. The thickness was measured at three different spots on each sample and used to calculate the maximal force values per square mm.
The thickness values lay between 0.03 and 0.2 mm. The comparison of ultimate tensile strength revealed a significant difference (p < 0.001) between orientations for the aligned fiber scaffolds (Figure 6A). The scaffolds reached a maximum strength of 12.26 ± 2.59 N/mm2 along the circumferential orientation. The tensile strength was reduced to 3.86 ± 1.08 N/mm2 in the perpendicular direction.
Unaligned fiber scaffolds show no difference in the ultimate tensile strength for the different orientations (F1: 7.19 ± 1.75 N/mm2, F2: 7.54 ± 1.59 N/mm2; p = 0.60). The comparative analysis of the elongation at break for the aligned fiber scaffolds revealed significant differences (p < 0.001) in distensibility between the directions (Figure 6B). The extensibility reached 187.01 ± 39.37% in the circumferential direction compared to 107.16 ± 30.04% in the perpendicular direction.
In contrast, the elongation at break for the unaligned fiber mats revealed uniform extensibility in both directions (F1: 269.74 ± 24.78 % ; F2: 285.01 ± 25.58 %; p = 0.69). Representative stress-strain curves show huge differences in the behavior of the material, depending on the direction in which the tensile force is applied. Unaligned fiber mats showed linear elastic behavior, while aligned fiber mats showed nonlinearity in the axial direction.
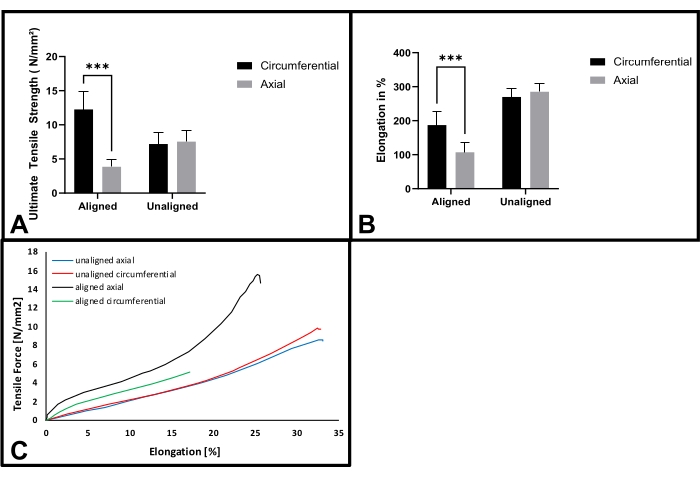
Figure 6: Tensile tests of aligned and unaligned fibers. (A) Ultimate tensile strength for aligned and unaligned fiber mats in circumferential and axial directions; n = 15; (B) Elongation at break for aligned and unaligned fiber mats in circumferential and axial directions; n = 15; (C) Representative stress-strain curves of aligned and unaligned scaffolds, pulled in axial and circumferential directions, respectively. (***p < 0.001). Please click here to view a larger version of this figure.
| Manufacturing Metrics | |||||||||
| Name | Material | Amount | Total Time | Total Weight [g] | Cost [€ per kg] | Total Cost | |||
| 1 | Specimen_Mount_A | Regular PLA | 2 | 18:19 | 159 | 51.33 € | 8.16 € | ||
| 2 | Specimen_Mount_B | Regular PLA | 2 | 19:42 | 161 | 51.33 € | 8.26 € | ||
| 3 | Collector Flange | Conductive PLA | 2 | 10:40 | 95 | 99.98 € | 9.50 € | ||
| 4 | Leaflet_Inlet | Conductive PLA | 9 | 05:32 | 31 | 99.98 € | 3.10 € | ||
| Total | 29.02 € | ||||||||
Table 1: Manufacturing metrics. Table specifying quantity, manufacturing time, amount of material needed, and costs for 3D-printed parts. Abbreviation: PLA = polylactic acid.
Supplemental File 1: Adaptable collector flange. Step-file to adapt and print collector flange. Please click here to download this File.
Supplemental File 2: Leaflet template. STL-file to print leaflet template. Please click here to download this File.
Supplemental File 3: Specimen mount A. STL-file to print specimen mount A. Please click here to download this File.
Supplemental File 4: Specimen mount B. STL-file to print specimen mount B. Please click here to download this File.
Supplemental File 5: Collector flange. STL-file to print collector flange. Please click here to download this File.
Supplemental File 6: Connecting metal rod. Technical drawing to construct connecting metal rods. Please click here to download this File.
Discussion
The described protocol presents two innovations in the field of (cardiovascular) tissue engineering: low-cost manufacturing of completely 3D-printed phantoms for electrospinning and the usage of a versatile collector to produce adaptable, multilayered heart valve leaflets.
Recently, 3D-printing has become a valuable tool for the production of laboratory equipment, e.g., bioreactors or manufacturing and testing setups11,12. Therefore, it was possible to manufacture the electrospinning setup presented in this study in a short amount of time and for an affordable budget (Table 1). This stays in line with previous findings for the low-cost production of electrospinning setups by using 3D-printing13.
Moreover, to the best of the authors' knowledge, this is the first time that a conductive 3D-printing material was used to create an electrospinning collector for heart valve leaflets. So far, 3D-printed collectors were either fabricated by metal laser sintering14 or using nonconductive polymer printing and subsequent postprocessing with a conductive coating15. In contrast to this novel approach, those procedures are at a significant disadvantage as they are more expensive, take much longer, or require more manual labor.
Electrospinning depends on a multitude of variables that impact the morphology of the created fibers. Although different commercial electrospinning setups are available on the market, many research groups use highly individualized setups to match their specific needs16. Taking this into account, the described values in this protocol (voltage, distance, and rotation speed) might need to be adapted for individual setups and should be seen as a starting point rather than fixed values. Furthermore, it is known that environmental parameters can have a significant influence on electrospinning results17,18. Therefore, it is highly recommended to control at least temperature and humidity within the electrospinning rig. Optimal electrospinning results were obtained between 15-20% relative humidity at a temperature between 21 and 24 °C. To follow this protocol, the following equipment is essential: a motor capable of accelerating a collector weighing approximately 300 g to a revolution speed of 2,000 rpm, a syringe pump suited for small volume flow rates of 1-3 mL/h, and a dual-pole power supply unit capable of ±20 kV direct current (DC).
In line with previous studies, it was possible to visualize the fibrous structure of the electrospun scaffolds by fluorescence microscopy19. It was possible to successfully demonstrate the multilayered structure of the scaffold, including the varying fiber orientations. Especially when working with multiple layers or multiple materials, the introduction of fluorescent dyes should be considered as a standard procedure for stringent quality control. It could improve the visual assessment of results after changes in the parameters or workflow protocol. The application of dye in scaffolds to be used for in vivo or in vitro assessment cannot be recommended. This is important to avoid interference with established analytical methods.
Mimicking natural heart valve morphology is of great importance to produce a tissue-engineered replicate to be used as a heart valve prosthesis (Figure 4B). It has been shown that the specific valve geometry has a high impact on in vivo remodeling20. In this context, 3D-printing of the leaflet geometry for electrospinning is of advantage, as iterations are easy and quick to implement. Even the production of personalized valve geometries is conceivable and subsequent development of individual and personalized 3D models of heart valve abnormalities, for example, for teaching purposes, is possible.
Further improvement of tissue-engineered heart valve properties is at the center of current research efforts, as several research groups have worked on developing multilayered scaffolds with defined fiber orientations. Masoumi et al. fabricated composite scaffolds from a molded polyglycerol sebacate layer and electrospun polycaprolactone (PCL) fiber mats21. Thus, a triple layer could be created out of two orientated electrospun layers separated by a sheet of microfabricated polyglycerol sebacate. However, in contrast to the scaffolds on hand, they were neither in a 3D shape nor did they adequately mimic the middle layer (spongiosa). Another approach to producing a bioinspired tissue-engineered heart valve was pursued by Jana et al.22,23. They successfully produced triple-layered scaffolds with orientated fibers using aluminum collectors for PCL-based electrospinning. Again, these scaffolds also presented morphological imperfections, as they only have a 2D appearance, and the final scaffold is pervaded by spokes.
Even though the protocol gives detailed information on how 3D, triple-layered heart valve leaflets are produced, there are several more steps needed to create an actual heart valve prosthesis. A stent of 24 mm diameter is recommended for the leaflets described here. Complementary to the stent used, the leaflets can be provided with additional support structures for stitching. To allow maximal flexibility, the leaflets shown here are not individualized to a specific stent design. This can be done by simply altering the template using CAD software.
Although used for heart valve tissue engineering, the presented method will be readily applicable for electrospinning setups in orthopedics24, urology25, otolaryngology26, and others. The production of sophisticated and/or individualized 3D constructs is feasible by the implementation of other 3D-printed collectors. Although the material of the collector has changed, the principle of electrospinning stays intact27. Therefore, the usage of different polymers is theoretically possible, although adjustment of the electrospinning parameters may be necessary.
Overall, the presented protocol describes an easy and cost-effective way to manufacture multilayered heart valve leaflets. The application of 3D-printing allows for fast adaptation and modifications of the collector and the inserts. This allows the production of patient-specific prostheses without a complicated manufacturing process of, for example, metal collectors. Multiple samples can be created in one run under identical conditions. Therefore, material destructive tests can be performed on the samples with the benefit of having (nearly) identical ones remaining to build the actual valve. The inclusion of the printing files as Supplemental Files in this study is meant to support the advancement of multilayered heart valve scaffolds. This new electrospinning technique also has a high potential for other fields of regenerative medicine, as modified collectors and other 3D-printed, spinning templates are easy to implement.
Disclosures
The authors declare no conflicts of interest.
Acknowledgements
This work was supported by the Clinician Scientist Program In Vascular Medicine (PRIME), funded by the Deutsche Forschungsgemeinschaft (DFG, German Research Foundation), project number MA 2186/14-1.
Materials
| Name | Company | Catalog Number | Comments |
|---|---|---|---|
| BTC-FR2.5TN.D09 | ZwickRoell GmbH & Co. KG | Traction engine (Tensile tests) | |
| C5-E Motor Controller | Nanotec Electronic GmbH & Co. KG | Motor controll unit | |
| CH1: CPN 30 kV | 0.3 mA | iseg Spezialelectronik GmbH | Power Supply Unit Anode | |
| CH1: CPN 30 kV | 0.3 mA | iseg Spezialelektronik GmbH | Power Supply Unit Kathode | |
| Conductive Composite PLA | ProtoPasta | Conductive PLA | |
| Cura 4.7.1 | Ultimaker BV | Slicing Software Ultimaker, step 1.1.2 | |
| DAPI Stock Solution c = 0.1 mg/mL | Sigma-Aldrich Chemie GmbH | DAPI | |
| Disposable Scalpel No. 23 | FEATHER | Scalpel | |
| Fluorescein (C.I. 45350) M 376.28 g/mol | Carl Roth GmbH + Co. KG | Fluorescein | |
| Fume Hood as per DIN 12924 Class 2 | Köttermann GmbH | Fume Hood | |
| Leica Applicatin Suite X 3.5.5.19976 | Leica Microsystems GmbH | Software for Confocal Laser Scanning Microscope | |
| Luerlock Syringe 20 mL | BD Plastipak | Luerlock Syringe | |
| Metal needle plane 2.50/2.00 x 20 mm | Unimed S.A. | Needle with plane tip | |
| Montage-complet-tubes; inner diameter x outer diameter: 1/16" x 1/8", length 1.000 mm | Bohlender GmbH | F740-28 | Solvent resistant tubes |
| N,N-Dimethylformamide ≥99.8% | Sigma-Aldrich Chemie GmbH | Dimethylformamide | |
| Pellethane 2363 80AE | Velox GmbH Hamburg | Polyurethane | |
| PLA | Ultimaker BV | PLA | |
| Plug&Drive Studio (1.0.4) | Nanotec Electronic GmbH & Co. KG | Motor operation software | |
| SEM Evo LS 10 | Zeiss MicroImaging GmbH | Scanning Electron Microscope | |
| SHT 31-D | Adafruit Industries | Temperature and Humidity Sensor | |
| SolidWorks 2020 CAD Software | Dassault Systèmes | Commercial CAD Software | |
| Sulforhodamine 101 50 mg | Sigma - Aldrich | S 7635 | Texas Red |
| Syringe Pump Model: Fusion 100 | Chemyx Inc. | Syringe Pump | |
| TCS SP8 inverted CEL BMi8 | Leica Microsystems GmbH | Confocal Laser Scanning Microscope | |
| testXpert V11.02 | ZwickRoell GmbH & Co. KG | Software Tensile Test | |
| Tetrahydrofuran ≥99.9% | Sigma-Aldrich Chemie GmbH | Tetrahydrofuran | |
| Type 1511530000202 #980361 | Binder Labortechnik GmbH | Heating Cabinet | |
| Ultimaker 3 Extended | Ultimaker BV | 3D Printer |
References
- Van Camp, G. Cardiovascular disease prevention. Acta Clinica Belgica. 69 (6), 407-411 (2014).
- Iung, B., Vahanian, A. Epidemiology of valvular heart disease in the adult. Nature Reviews Cardiology. 8 (3), 162-172 (2011).
- Fioretta, E. S., et al. Cardiovascular tissue engineering: From basic science to clinical application. Experimental Gerontology. 117 (1), 1-12 (2019).
- Xue, J., Wu, T., Dai, Y., Xia, Y. Electrospinning and electrospun nanofibers: methods, materials, and applications. Chemical Reviews. 119 (8), 5298(2019).
- Grande, D., Ramier, J., Versace, D. L., Renard, E., Langlois, V. Design of functionalized biodegradable PHA-based electrospun scaffolds meant for tissue engineering applications. New Biotechnology. 37, Pt A 129-137 (2017).
- Tara, S., et al. Well-organized neointima of large-pore poly(l-lactic acid) vascular graft coated with poly(l-lactic-co-ε-caprolactone) prevents calcific deposition compared to small-pore electrospun poly(l-lactic acid) graft in a mouse aortic implantation model. Atherosclerosis. 237 (2), 684-691 (2014).
- Voorneveld, J., Oosthuysen, A., Franz, T., Zilla, P., Bezuidenhout, D. Dual electrospinning with sacrificial fibers for engineered porosity and enhancement of tissue ingrowth. Journal of Biomedical Material Research. 105 (6), 1559-1572 (2017).
- Kishan, A. P., Cosgriff-Hernandez, E. M. Recent advancements in electrospinning design for tissue engineering applications: A review. Journal of Biomedical Materials Research. 105 (10), 2892-2905 (2017).
- Sacks, M. S., David Merryman, W., Schmidt, D. E. On the biomechanics of heart valve function. Journal of Biomechanics. 42 (12), 1804-1824 (2009).
- Buchanan, R. M., Sacks, M. S. Interlayer micromechanics of the aortic heart valve leaflet. Biomechanics and Modeling in Mechanobiology. 13 (4), 813-826 (2014).
- Gensler, M., et al. 3D printing of bioreactors in tissue engineering: A generalised approach. PLoS One. 15 (11), 0242615(2020).
- Grab, M., et al. Customized 3D printed bioreactors for decellularization-High efficiency and quality on a budget. Artificial Organs. 45 (12), 1477-1490 (2021).
- Huang, J., Koutsos, V., Radacsi, N. Low-cost FDM 3D-printed modular electrospray/electrospinning setup for biomedical applications. 3D Printing in Medicine. 6 (1), 8(2020).
- Fukunishi, T., et al. Preclinical study of patient-specific cell-free nanofiber tissue-engineered vascular grafts using 3-dimensional printing in a sheep model. Journal of Thoracic and Cardiovascular Surgery. 153 (4), 924-932 (2017).
- Jana, S., Lerman, A. In vivo tissue engineering of a trilayered leaflet-shaped tissue construct. Regenerative Medicine. 15 (1), 1177-1192 (2020).
- Hasan, A., et al. Electrospun scaffolds for tissue engineering of vascular grafts. Acta Biomaterialia. 10 (1), 11-25 (2014).
- Wang, X., Ding, B., Yu, J., Yang, J. Large-scale fabrication of two-dimensional spider-web-like gelatin nano-nets via electro-netting. Colloids and Surfaces B: Biointerfaces. 86 (2), 345-352 (2011).
- Yang, G. -Z., Li, H. -P., Yang, J. -H., Wan, J., Yu, D. -G. Influence of working temperature on the formation of electrospun polymer nanofibers. Nanoscale Research Letters. 12 (1), 55(2017).
- Ekaputra, A. K., Prestwich, G. D., Cool, S. M., Hutmacher, D. W. Combining electrospun scaffolds with electrosprayed hydrogels leads to three-dimensional cellularization of hybrid constructs. Biomacromolecules. 9 (8), 2097-2103 (2008).
- Motta, S. E., et al. Geometry influences inflammatory host cell response and remodeling in tissue-engineered heart valves in-vivo. Scientific Reports. 10 (1), 19882(2020).
- Masoumi, N., et al. Tri-layered elastomeric scaffolds for engineering heart valve leaflets. Biomaterials. 35 (27), 7774-7785 (2014).
- Jana, S., Lerman, A. Behavior of valvular interstitial cells on trilayered nanofibrous substrate mimicking morphologies of heart valve leaflet. Acta Biomaterialia. 85, 142-156 (2019).
- Jana, S., Franchi, F., Lerman, A. Trilayered tissue structure with leaflet-like orientations developed through in vivo tissue engineering. Biomedical Materials. 15 (1), 015004(2019).
- Zhou, Y., Chyu, J., Zumwalt, M. Recent progress of fabrication of cell scaffold by electrospinning technique for articular cartilage tissue engineering. International Journal of Biomaterials. 2018, 1953636(2018).
- Zamani, M., Shakhssalim, N., Ramakrishna, S., Naji, M. Electrospinning: application and prospects for urologic tissue engineering. Frontiers in Bioengineering and Biotechnology. 8, 579925(2020).
- Heilingoetter, A., Smith, S., Malhotra, P., Johnson, J., Chiang, T. Applications of Electrospinning for Tissue Engineering in Otolaryngology. Annals of Otology, Rhinology & Laryngology. 130 (4), 395-404 (2020).
- Xue, J., Xie, J., Liu, W., Xia, Y. Electrospun nanofibers: new concepts, materials, and applications. Accounts of Chemical Research. 50 (8), 1976-1987 (2017).
Reprints and Permissions
