Here, we present a protocol to isolate murine intestinal mesenchyme, including telocytes. These can be used for several applications, such as co-culture with mouse or human-derived organoids, to support growth and better reflect the situation in the original tissue.
Method Article
Isolation of Murine Intestinal Mesenchyme Resulting in a High Yield of Telocytes
* These authors contributed equally
Opens in a new tab
In This Article
Summary
Loading...
$$\rightleftharpoonup{xx}$$
$$\longleftharp{xx}$$,
$$\longrightharp{xx}$$,
Abstract
Loading...
$$\rightleftharpoonup{xx}$$
$$\longleftharp{xx}$$,
$$\longrightharp{xx}$$,
The murine small intestine, or colon mesenchyme, is highly heterogenous, containing distinct cell types including blood and lymphatic endothelium, nerves, fibroblasts, myofibroblasts, smooth muscle cells, immune cells, and the recently identified cell type, telocytes. Telocytes are unique mesenchymal cells with long cytoplasmic processes, reaching a distance of tens to hundreds of microns from the cell body. Telocytes have recently emerged as an important intestinal stem cell niche component, providing Wnt proteins that are essential for stem and progenitor cell proliferation.
Although protocols on how to isolate mesenchyme from the mouse intestine are available, it is not clear whether these procedures allow the efficient isolation of telocytes. Isolating telocytes efficiently requires special protocol adjustments that would allow dissociation of the strong cell-cell contact between telocytes and neighboring cells without affecting their viability. Here, available intestinal mesenchyme isolation protocols were adjusted to support the successful isolation and culture of mesenchyme containing a relatively high yield of viable single-cell telocytes.
The obtained single-cell suspension can be analyzed by several techniques, such as immunostaining, cell sorting, imaging, and mRNA experiments. This protocol yields mesenchyme with sufficiently conserved antigenic and functional properties of telocytes, and can be used for several applications. For example, they can be used for co-culture with mouse- or human-derived organoids to support organoid growth with no growth factor supplementation, to better reflect the situation in the original tissue.
Introduction
Loading...
$$\rightleftharpoonup{xx}$$
$$\longleftharp{xx}$$,
$$\longrightharp{xx}$$,
Both the small intestine and colon are highly regenerative tissues due to the presence of stem cells, which proliferate and fuel regeneration1. The mesenchyme surrounding the epithelium provides structural and functional support by secreting extracellular matrix proteins and signaling molecules2, which modulate the response of epithelial cells. Telocytes are large mesenchymal cells, mainly described so far by electron microscopy as cells with long cytoplasmic processes called telopodes, which overlap to create a labyrinthic network3,4,5,6,7. Recently, intestinal telocytes expressing the transcription factor FOXL1 have emerged as an important stem cell niche component providing Wnt proteins, which are crucial for stem and progenitor cell function. Intestinal telocytes express high levels of key signaling pathway proteins such as Wnt, Bmp, Tgfb, and Shh, as well as many growth factors8.
Given that telocytes are a critical stem cell niche component in vivo, developing protocols to isolate and culture them ex vivo will allow their use as a source for signaling molecules and growth factors, to support growth and differentiation ex vivo. Using well-established protocols, colon or intestinal epithelial crypts can be isolated and form 3D structures known as organoids9,10,11. Three-dimensional organoids represent a powerful tool to investigate both the physiology and pathology of the intestinal epithelium ex vivo. In an ex vivo system, organoids rely on exogenous supplementation of factors for survival and growth10. Isolated mesenchyme can be cultured with both mouse and human-derived organoids and used as a source of growth factors, instead of exogenous supplementation, to better reflect the situation in the original tissue. Studying telocytes ex vivo has numerous benefits in investigating normal or pathological cellular behaviors, mechanisms of tissue homeostasis, and cell-cell interactions in greater detail.
Although protocols describing how to isolate mesenchyme from the mouse intestine are available, it is not clear whether these procedures result in the efficient isolation of telocytes. Successful isolation of telocytes requires special protocol adjustments that would allow dissociation of the strong cell-cell contact between the telocytes and neighboring cells, without affecting their viability. To overcome these limitations, this paper presents a modified protocol that consistently yields a highly viable, single-cell suspension containing a relatively high quantity of telocytes with sufficiently conserved antigenic and functional properties. These telocytes can be used for several applications, including co-culture with mouse- or human-derived organoids, to support growth with no growth factor supplementation. This in turn better reflects the situation in the original tissue.
We used the FOXL1-Cre: Rosa-mTmG mouse model8, in which telocytes are labeled with a membrane-bound version of green fluorescent protein (GFP) in green, which allows the investigator to follow telocytes in their entirety; all the other mesenchymal cells are labeled with a membrane-bound tdTomato in red. The current protocol was modified from a protocol isolating intestinal mesenchyme12 to improve telocyte yield and viability.
Protocol
Loading...
$$\rightleftharpoonup{xx}$$
$$\longleftharp{xx}$$,
$$\longrightharp{xx}$$,
All procedures described below were approved by the Institutional Animal Care and Use Committee (IACUC) at the Hebrew University of Jerusalem.
1. Preparation of reagents and buffers
- Preheat a water bath to 37 °C.
- Prepare all the solutions in Table 1.
2. Intestinal mesenchyme isolation
- Euthanize the mouse by CO2 inhalation, immediately followed by cervical dislocation.
- Place the mouse in a supine position and spray the abdomen with 70% EtOH. Lift the abdominal skin and cut longitudinally along the midline to expose the peritoneal cavity (see Figure 1 I,II).
- Locate the stomach, cut from the esophagus, and slowly pull the intestine out of the peritoneal cavity. Clean excess fat and connective tissue using forceps. Excise the small intestine from the duodenum to approximately 0.5 cm from the cecum (Figure 1 III,IV).
- Wash the intestine in a Petri dish containing cold sterile PBS. Using ball-tip scissors, open the intestinal tube longitudinally and wash out the feces (Figure 1 V). Transfer the intestine into a new dish containing fresh cold PBS and wash again.
- Cut the small intestine into 1 cm long segments and transfer into a 15 mL conical tube filled with 8 mL of PBS. Shake the tube manually at one or two cycles/s for 1 min.
- Transfer the segments using forceps into a 50 mL conical tube filled with 20 mL of freshly made solution A (see Table 1). Place the tubes in an orbital shaker incubator at 37 °C for 20 min. After incubation, shake the tube vigorously by hand at four or five cycles/s for 1 min to dissociate the epithelium.
- Repeat step 2.6 once.
- Transfer the segments into a new 50 mL tube filled with 10 mL of sterile PBS, and invert the tube at one or two cycles/s for 1 min.
- Transfer the segments into a new 15 mL tube filled with 10 mL of sterile PBS, and tilt up and down gently at one or two cycles/s for 2 min.
- Under a biosafety cabinet, use forceps to place the segments on a sterile laboratory wipe to dry them out. Once dried, cut the segments further into 0.5 cm pieces.
- Transfer the small segments using forceps into a 6-well plate filled with 4 mL of prewarmed digestion solution per well. Incubate at 37 °C for 50 min. Gently shake the plate by hand every 20 min.
- Transfer the segments using a Pasteur pipette into a 15 mL conical tube filled with 4 mL of DMEM. Shake the tube manually at four or five cycles/s for 1 min to get a single-cell suspension.
- Filter the suspension through a 100 µm strainer into a 50 mL conical tube. Centrifuge the filtrate at 700 × g for 5 min at 4 °C.
- Discard the supernatant by aspiration and resuspend the cell pellet in 5 mL of 2% FBS/PBS. Centrifuge the suspension at 700 × g for 5 min at 4 °C.
- Discard the supernatant by aspiration, resuspend the cell pellet with 12 mL of culture medium, and seed 1 mL per well onto two 6-well plates. The following day, wash and aspirate any dying cells and replace the spent medium with fresh medium.
NOTE: For optimal maintenance of the culture, it is recommended to change the medium every 2 days. Depending on the mouse strain, genetic background, and age, 4 days to 2 weeks are needed for the mesenchyme to be ready for co-culture experiments. For further co-culture experiments, mesenchyme should reach confluency, displaying flat and fully stretched cellular morphology as shown in Figure 2. In general, cells with round morphology are not viable or functional.
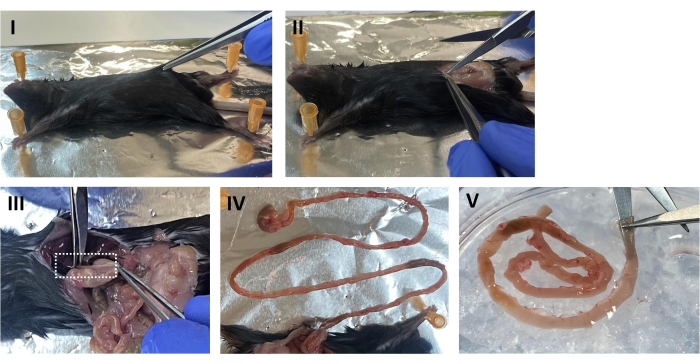
Figure 1: Mouse dissection. (I) Place the mouse in a supine position and spray the abdomen with 70% EtOH. Lift the abdominal skin. (II) Open the peritoneal cavity longitudinally along the midline. (III) While gently pulling the stomach, sever the esophagus. (IV) Pinch the stomach and slowly pull out the intestine. (V) Insert the tip of the ball-tip scissors in the lumen and open the intestinal tube longitudinally. Please click here to view a larger version of this figure.
3. Mesenchyme resuspension for passaging or co-culture
- Resuspend the mesenchyme with 2 mL of 0.25% trypsin-0.5 mM EDTA/well in a 6-well plate. Incubate for 5 min at 37 °C. Following incubation, if several cells have not already started detaching from the dish, incubate for an extra 2 min.
- Using a cell scraper, gently scrape the surface of the well. Transfer the cell suspension into a 15 mL conical tube. Add 2 mL of DMEM-F12/well and gently pipette the suspension up and down.
NOTE: It is important not to overfill the tube with more than 50% of the tube volume. It is therefore recommended to use a 15 mL conical tube filled with 8 mL of suspension for every two wells. - Count the cells.
NOTE: A fully confluent well yields between 2 × 10⁶ cells and 2.5 × 10⁶ cells. - Dilute the cell suspension to achieve a seeding density of 3-5 × 10⁵ cells/mL. Centrifuge for 5 min at 500 × g at 4 °C and discard the supernatant by careful aspiration.
NOTE: It is important to remove as much liquid as possible. - Resuspend the cell pellet in prewarmed culture medium and plate.
4. Flow cytometry analysis for telocyte purification
- Obtain the mesenchymal cell pellet (step 2.14). Resuspend the cell pellet in 1 mL of FACS buffer and filter through a 40 µm strainer.
- Incubate the cell suspension with allophycocyanin (APC)-conjugated CD326 (1:100), CD45 (1:400), and CD31 (1:250) antibodies in 400 µL of FACS buffer for 15 min at room temperature to exclude epithelial, immune, and endothelial cells, respectively, from the sort.
- Wash the cells by adding 1 mL of FACS buffer and spin down at 700 × g for 5 min at 4 °C. Resuspend in 400 µL of FACS buffer and add 4',6-diamidino-2-phenylindole (DAPI, 5 mg/mL, 1:1,000) for flow cytometry analyses. Gate the single cells according to the SSC-height by SSC-area. Gate the DAPI- live cells and gate out CD45+/CD31+/CD326+ to sort the GFP+ telocytes, as shown in Figure 3.
Results
Loading...
$$\rightleftharpoonup{xx}$$
$$\longleftharp{xx}$$,
$$\longrightharp{xx}$$,
The above intestinal mesenchyme isolation protocol was modified from protocols described in both Wu et al.12 and Shoshkes-Carmel et al.8. The protocol described in Wu et al. is for the colon, and the one by Shoshkes-Carmel et al. is for the small intestine, thus the digestion condition is different in enzyme combination, work concentration, and incubation time between these two protocols. Here, the described protocol has been successfully used to isolate and culture intestinal mesenchymal cells, including telocytes. Briefly, we dissected the small intestine from the duodenum to the ileum using a FOXL1-Cre: Rosa-mTmG mouse model8, in which the telocytes were labeled with membrane-GFP (green), while other mesenchymal cells were labeled with membrane-tdTomato (red). We dissociated the tissue using digesting enzymes and seeded the mesenchyme in a 6-well plate. Following dissociation, telocytes lose their cellular characteristics, showing round cellular morphology (Figure 2A) which is reflected in the under-quantification of GFP+ cells at day 1 compared with following days (Figure 2F). After a few days, telocytes exhibit a small stretched cell morphology with short cellular processes (Figure 2B,C). However, 7-10 days following seeding, telocytes regain their cellular characteristics, showing large stretched cell morphology with long cytoplasmic processes (Figure 2D,E), and are ready to be used in co-culture with organoids and support their growth.

Figure 2: Cultured mesenchyme isolated from FOXL1Cre: Rosa-mTmG mouse intestine. FOXL1+ telocytes are labeled with GFP, while other mesenchymal cells are tdTomato+. (A-E) Representative images of cultured mesenchyme isolated using the current protocol, plated in a 6-well plate, and imaged following 1 (A), 4 (B,C), and 7 (D,E) days of culture. Scale bars = 100 µm. (F) Quantification of GFP/tdTomato cell ratio per field of view (percentages) at days 1, 4, and 7 of culture. Abbreviations: FOXL1 = Forkhead box L1 protein; GFP = green fluorescent protein. Please click here to view a larger version of this figure.
To evaluate this isolation protocol and reveal the cell composition, we analyzed the obtained cell suspension by flow cytometry (Figure 3). Overall, 69% of the isolated cells were viable based on DAPI staining (Figure 3 III); out of the live cells, 60.9% represented epithelial contamination and immune and endothelial cells (CD326+, CD45+, and CD31+; Figure 3 IV). The telocyte fraction (GFP+) scattered above 100k and 70k FSC and SSC, respectively (Figure 3 VI), and represented almost 10% from the gated mesenchyme (live CD45-, CD326-, CD31-) (Figure 3 V).
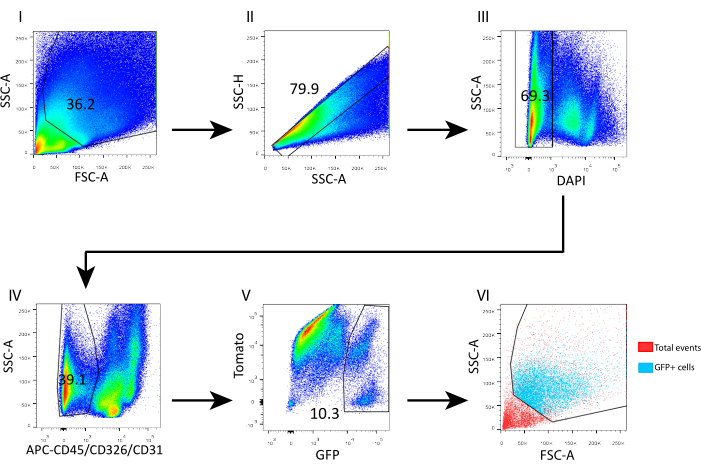
Figure 3: Flow cytometry gating strategy for sorting telocytes from isolated adult mouse intestinal mesenchyme. (I) Low-level side scatter events were excluded. (II) Single cells were gated according to SSC-height by SSC-area. (III) DAPI+ events were gated out to exclude dead cells from the sort. (IV) DAPI- CD45+/CD326+/CD31+ events were gated out to exclude immune, epithelial, and endothelial cells, respectively. (V) GFP+ telocytes accounted for 10.3% of DAPI- CD45-/CD326-/CD31- cells. (VI) Back-gating analysis revealed the coordinates of GFP+ telocytes in an FSC-A/SSC-A plot. Abbreviations: SSC-A = side scatter-peak area; FSC-A = forward scatter-peak area; SSC-H = side scatter-peak height; DAPI = 4',6-diamidino-2-phenylindole; GFP = green fluorescent protein; APC = allophycocyanin. Please click here to view a larger version of this figure.
In parallel, we also isolated mesenchyme from a wild-type (WT) C57Bl6 mouse intestine, in which the telocyte fraction was evaluated by using a combination of surface markers previously analyzed on mesenchyme isolated from a FOXL1Cre: Rosa-mTmG mouse model, in which the telocyte fraction was GFP-labeled. We found that a subset of the telocytes can be defined by a positive staining to CD201 and podoplanin (GP38) (Figure 4). Moreover, using these markers in immunostaining 1 day following isolation and culture confirmed that, although the cells did not yet exhibit their cellular characteristics, they obtained the expression of these molecular markers, showing staining in 70%-80% of the GFP+ telocytes (Figure 5).
The telocyte fraction defined by surface markers is not identical to the one obtained by using the FOXL1-driven reporter mouse; the telocyte is highly heterogenous and contains several subsets. It is necessary to combine the surface marker with FOXL1 labeling for telocyte definition. In the small intestine of theFOXL1Cre: Rosa-mTmG mouse, 60%-70% of the GFP+ cells are CD201 positive, and 65%-80% are positive for GP38. When using surface markers, it is important to note that inappropriate storage and repetitive freeze-thawing cycles of antibodies decreases the binding efficiency. In addition, enzymatic digestion may disrupt surface marker expression. We observed that the expression of CD138, a transmembrane proteoglycan expressed on mesenchymal cells, was disrupted and greatly decreased with dissociation.
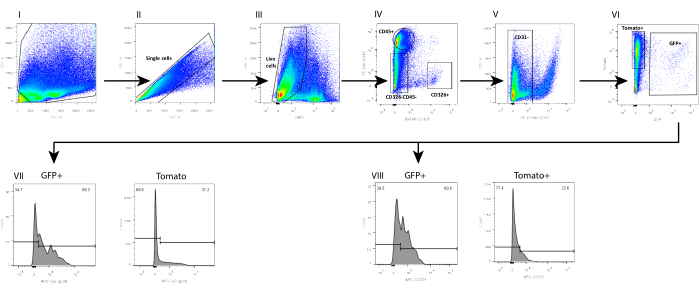
Figure 4: FACS analysis of single-cell mesenchyme suspension isolated from FOXL1Cre: Rosa-mTmG mouse small intestine using the current protocol. FACS analysis on (I-II) single cells, (III) DAPI-, (IV-VI) Lin-(CD45-, CD326-, CD31-) GFP+ cells, showing that (VII) 65.3% of the GFP+ and 31.2% of the Tomato+ are positive for GP38, whereas (VIII) 60.5% of the GFP+ and 22.6% of the Tomato+ are positive for CD201. Abbreviations: SSC-A = side scatter-peak area; FSC-A = forward scatter-peak area; SSC-H = side scatter-peak height; DAPI = 4',6-diamidino-2-phenylindole; GFP = green fluorescent protein; APC = allophycocyanin; PE = phycoerythrin. Please click here to view a larger version of this figure.
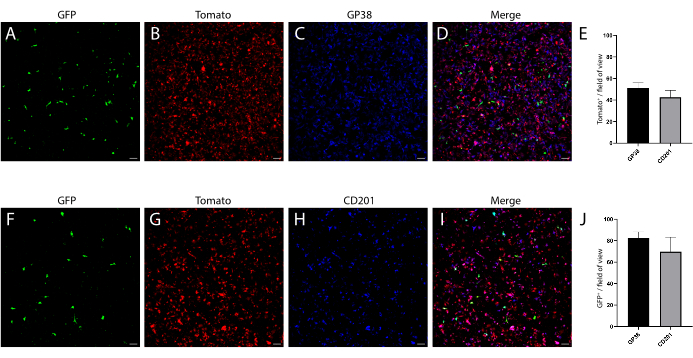
Figure 5: Day one cultured mesenchyme, fixed and stained for mesenchymal markers. (A-D) Representative images of cultured mesenchyme stained for GP38. (F-I) Representative images of cultured mesenchyme stained for CD201. Scale bars = 100 µm. (E) Quantification of Tomato+ GP38+ and Tomato+ CD201+ double-positive from total Tomato+. (J) Quantification of GFP+ GP38+ and GFP+ CD201+ double-positive from total GFP+. Please click here to view a larger version of this figure.
| Solution A: | HBSS supplemented with 2% FBS, 1 mM DL-dithiothreitol (DTT), 2 mM EDTA (pH 8.0). | |||
| Complemented medium 1640 (CM1640): | RPMI 1640 medium supplemented with 10% FBS, Pen/Strep (100 units penicillin/mL, 100 µg streptomycin/mL). | |||
| Digestion solution: | 100 U/mL collagenase type VIII, 75 mg/mL DNase I in 4 mL of prewarmed CM1640. Note: Add collagenase and DNase I just before digestion procedure starts. | |||
| Culture media: | DMEM-F12 media supplemented with 10 µg/mL gentamicin, 10 mM HEPES, glutamine, Pen/Strep (100 units penicillin/mL, 100 µg streptomycin/mL). | |||
| FACS buffer: | PBS supplemented with 5% FBS and 1 mM EDTA. | |||
Table 1: Composition of all the solutions used in the protocol.
Supplemental Table S1: The major differences between the current protocol and the two reference protocols are listed here. Please click here to download this File.
Discussion
Loading...
$$\rightleftharpoonup{xx}$$
$$\longleftharp{xx}$$,
$$\longrightharp{xx}$$,
Here, we developed a protocol to isolate mesenchyme from mouse small intestine using the FOXL1-Cre: Rosa26-mTmG mouse model, which enables researchers to distinguish telocytes from other mesenchymal cells. There are some critical steps to follow in this protocol. First, it is important to shake the tube vigorously at four or five cycles/s, to discard the majority of epithelial cells during mesenchyme isolation. The incubation time for enzymatic digestion must be optimized based on digestion efficiency. During incubation, the plates are to be gently shaken horizontally for a few seconds every 20 min. Once the tissue becomes filament-like, the incubation must be stopped by proceeding to protocol step 2.12. Exposing the tissue for long digestion times may result in low cell viability rate and yield. Following enzymatic digestion, the tube must be mechanically shaken to release more single cells into suspension; ideally, the solution should look cloudy, and no tissue fragments should be visible. If this is not the case, prolong the enzymatic digestion to 60 min.
Keeping sterile conditions and avoiding potential bacterial contamination is one of the critical steps when working with primary tissue culture. Sterile dissecting tools, reagents, and buffers must be used; gloves must be changed, and the working area must be cleaned when working with animals is done. Once the cell suspension is obtained, work should be conducted under a laminar biological hood. Following plating, cells should be incubated overnight with no disturbances, since this can affect adherence. In addition, it is important to replace the culture medium one day post seeding, since non-adherent cells may affect culture viability.
Surface markers used in this protocol strongly reacted with their epitopes; however, it is possible that enzymatic digestion may affect binding reactivity, and therefore, FACS analysis results. Another limitation of this protocol is the underrepresentation of the muscularis layer. To improve the efficiency of muscle layer cell isolation, we recommend mechanical separation of the muscle from the mucosa layers, and separate enzymatic digestion for each of the layers. For dissociating the epithelium from the stroma, either mechanical separation or chelating agents (EDTA or DTT) can be used; however, enzymatic digestion for obtaining single cells has been optimized in this protocol.
Isolation of intestinal mesenchyme has been previously described8; scraping off the villi with a coverslip would cause the loss of some mesenchyme alongside the villus, especially villus tip mesenchymal cells such as Lgr5+ villus tip telocytes13. In this protocol, we utilize collagenase type VIII instead of dispase II and trypsin in combination with DNase I, as collagenase more efficiently releases mesenchymal cells from the matrix. Although it prolongs the processing time (>90 min vs. 35 min), the two protocols yielded similar cell viability rates; the current protocol improved the yield of the mesenchymal cells in general, and more specifically of the telocyte fraction. The current protocol yielded approximately 10% GFP+ telocytes, confirmed both by visualization and by FACS analysis, while the earlier protocol yielded 2% GFP+ telocytes. The major differences between the current protocol and the two reference protocols are listed in Supplemental Table S1.
The identification of FOXL1+GFP+ cells as subepithelial telocytes is based on in vivo studies. The need to develop and modify available mesenchyme isolation protocols to produce higher yields of telocytes, and the knowledge of how to achieve this was based on our understanding of the structure and function of FOXL1+ telocytes in vivo, as large cells with long cellular projections closely attached to epithelial cells.
Interestingly, ex vivo GFP+ telocytes exhibit cellular characteristics similar to their features in vivo in the intestine and are, therefore, suggested to serve as an ideal support for organoid growth. Although this protocol mainly discusses telocyte isolation from the small intestine, a similar protocol with minor modification can be used and easily applied for colon mesenchymal cells, such as the recently described MAP3K2-regulated intestinal stromal cell (MRISC)12.
Once the mesenchymal cells have stretched and reached confluency, they can be used for several additional applications, such as 3D co-culture with mouse- or human-derived organoids, using growth factor-free Matrigel. The mesenchyme typically forms a network fully supporting organoid formation and growth with no exogenous growth factor supplementation. The intestinal stroma has intrinsic 3D features that can provide the epithelium with mechanical support14. Therefore, this protocol can also be used to isolate mesenchyme to be integrated into a 3D bio-printed scaffold and utilized for further xenograft experiments.
Disclosures
Loading...
$$\rightleftharpoonup{xx}$$
$$\longleftharp{xx}$$,
$$\longrightharp{xx}$$,
The authors have no conflicts of interests to declare.
Acknowledgements
Loading...
$$\rightleftharpoonup{xx}$$
$$\longleftharp{xx}$$,
$$\longrightharp{xx}$$,
This work was supported by grants from the Israel Science Foundation (MSC personal grant) and the joint program between the Israel Science Foundation and the National Natural Science Foundation of China.
Materials
| Name | Company | Catalog Number | Comments |
|---|---|---|---|
| 15 mL Centrifuge Tubes | Corning | 430052 | |
| 50 mL Centrifuge Tubes | Corning | 430828 | |
| 5 mL Polystyrene Round-Bottom Tube with Cell-strainer cap | Corning | 352235 | |
| 6 Well Cell Culture Plate | Costar | 3516 | |
| APC Anti-Mouse CD31 | Biolegend | 102509 | |
| APC Anti-Mouse CD326 | Biolegend | 118213 | |
| APC Anti-Mouse CD45 | Biolegend | 103111 | |
| Cell Lifter | Corning | 3008 | |
| Cell Strainer 100μm Nylon Yellow | Corning | CLS431752 | |
| Collagenase type VIII | Sigma | C2139-500MG | |
| DL-Dithiothreitol (DTT) | Sigma | 43815-1G | |
| DMEM/F-12 (HAM) 1:1 | Biological Industries | 01-170-1A | |
| DNase I | Sigma | DN25-1G | |
| Dulbecco's Modified Eagle Medium (DMEM) | Biological Industries | 01-055-1A | |
| Dulbecco's Phosphate Buffered Saline | Sigma | D1283-500ML | 10x |
| EDTA 0.5 M, pH 8.0 | Biological Industries | 01-862-1B | |
| FBS | Biological Industries | 04-007-1A | |
| Gentamicin | Sigma | G1914-250MG | 100x |
| Gluta Max-I | Gibco | 35050-038 | 100x |
| Hank’s Balanced Salt Solution (HBSS) | Biological Industries | 02-017-5A | 10x |
| HEPES | Gibco | 15630-080 | 100x |
| Penicillin-Streptomycin (Pen/Strep) | Biological Industries | 03-033-1B | 100x |
| RPMI 1640 medium | Gibco | 21875-034 | |
| Trypsin EDTA Solution B | Sartorius | 03-052-1A |
References
Loading...
$$\rightleftharpoonup{xx}$$
$$\longleftharp{xx}$$,
$$\longrightharp{xx}$$,
- Lgr5+ intestinal stem cells reside in an unlicensed G1 phase. The Journal of Cell Biology. 217 (5), 1667-1685 (2018).">Carroll, T. D., Newton, I. P., Chen, Y., Blow, J. J., Näthke, I. Lgr5+ intestinal stem cells reside in an unlicensed G1 phase. The Journal of Cell Biology. 217 (5), 1667-1685 (2018).
- Structural remodeling of the human colonic mesenchyme in inflammatory bowel disease. Cell. 175 (2), 372-386 (2018).">Kinchen, J., et al. Structural remodeling of the human colonic mesenchyme in inflammatory bowel disease. Cell. 175 (2), 372-386 (2018).
- TELOCYTES - a case of serendipity: The winding way from Interstitial Cells of Cajal (ICC), via Interstitial Cajal-Like Cells (ICLC) to TELOCYTES. Journal of Cellular and Molecular Medicine. 14 (4), 729-740 (2010).">Popescu, L. M., Faussone-Pellegrini, M. -S. TELOCYTES - a case of serendipity: The winding way from Interstitial Cells of Cajal (ICC), via Interstitial Cajal-Like Cells (ICLC) to TELOCYTES. Journal of Cellular and Molecular Medicine. 14 (4), 729-740 (2010).
- Telocytes in endocardium: electron microscope evidence. Journal of Cellular and Molecular Medicine. 14 (9), 2330-2334 (2010).">Gherghiceanu, M., Manole, C. G., Popescu, L. M. Telocytes in endocardium: electron microscope evidence. Journal of Cellular and Molecular Medicine. 14 (9), 2330-2334 (2010).
- Telocytes in human skin—are they involved in skin regeneration. Journal of Cellular and Molecular Medicine. 16 (7), 1405-1420 (2012).">Ceafalan, L., Gherghiceanu, M., Popescu, L. M., Simionescu, O. Telocytes in human skin—are they involved in skin regeneration. Journal of Cellular and Molecular Medicine. 16 (7), 1405-1420 (2012).
- Telocytes in pleura: two- and three-dimensional imaging by transmission electron microscopy. Cell and Tissue Research. 343 (2), 389-397 (2011).">Hinescu, M. E., Gherghiceanu, M., Suciu, L., Popescu, L. M. Telocytes in pleura: two- and three-dimensional imaging by transmission electron microscopy. Cell and Tissue Research. 343 (2), 389-397 (2011).
- Telocytes in human epicardium. Journal of Cellular and Molecular Medicine. 14 (8), 2085-2093 (2010).">Popescu, L. M., et al. Telocytes in human epicardium. Journal of Cellular and Molecular Medicine. 14 (8), 2085-2093 (2010).
- Subepithelial telocytes are an important source of Wnts that supports intestinal crypts. Nature. 557 (7704), 242-246 (2018).">Shoshkes-Carmel, M., et al. Subepithelial telocytes are an important source of Wnts that supports intestinal crypts. Nature. 557 (7704), 242-246 (2018).
- A functional CFTR assay using primary cystic fibrosis intestinal organoids. Nature Medicine. 19 (7), 939-945 (2013).">Dekkers, J. F., et al. A functional CFTR assay using primary cystic fibrosis intestinal organoids. Nature Medicine. 19 (7), 939-945 (2013).
- Long-term expansion of epithelial organoids from human colon, adenoma, adenocarcinoma, and Barrett’s epithelium. Gastroenterology. 141 (5), 1762-1772 (2011).">Sato, T., et al. Long-term expansion of epithelial organoids from human colon, adenoma, adenocarcinoma, and Barrett’s epithelium. Gastroenterology. 141 (5), 1762-1772 (2011).
- Protocol for application, standardization and validation of the forskolin-induced swelling assay in cystic fibrosis human colon organoids. STAR Protocols. 1 (1), 100019(2020).">Vonk, A. M., et al. Protocol for application, standardization and validation of the forskolin-induced swelling assay in cystic fibrosis human colon organoids. STAR Protocols. 1 (1), 100019(2020).
- MAP3K2-regulated intestinal stromal cells define a distinct stem cell niche. Nature. 592 (7855), 606-610 (2021).">Wu, N., et al. MAP3K2-regulated intestinal stromal cells define a distinct stem cell niche. Nature. 592 (7855), 606-610 (2021).
- Lgr5+ are a signaling source at the intestinal villus tip. Nature Communication. 11 (1), 1936(2020).">Bahar Halpern, K., et al. Lgr5+ are a signaling source at the intestinal villus tip. Nature Communication. 11 (1), 1936(2020).
- Mesenchymal cells in colon cancer. Gastroenterology. 152 (5), 964-979 (2017).">Koliaraki, V., Pallangyo, C. K., Greten, F. R., Kollias, G. Mesenchymal cells in colon cancer. Gastroenterology. 152 (5), 964-979 (2017).
Reprints and Permissions
Request permission to reuse the text or figures of this JoVE article
Request Permission