Early life social learning is enhanced by interactions with effectively designed environments. Four events were held at different city parks using inexpensive, temporary waterslides to stimulate social learning. This study describes the prototypes used and the evaluation of the children's interactions.
Method Article
Four Temporary Waterslide Designs Adapted to Different Slope Conditions to Encourage Child Socialization in Playgrounds
In This Article
Summary
Abstract
Increased urbanization has decreased children's access to various natural outdoor environments. To counteract this deficiency in early life experiences, we designed four temporary waterslides, each tailored to different city-side park conditions. The waterslides were simple to construct, with frames built from easy-to-attain resources such as bamboo rods from a local forest and simple pipes and joints overlaid by a tarp. Plywood boards, cardboard, and a tarp were used to create a pool at the foot of the slides, which were placed on existing slopes or stairs in each park. Water was continually released down the slide during each 1-2 h event. At each park event, children gathered spontaneously to use the slides and interact socially. No serious accidents occurred during the waterslide trials. To understand how the children used each waterslide, the activity at the waterslides was recorded by video. The minute of the highest activity level at the waterslide was quantitatively analyzed to determine the lines of flow surrounding the waterslide and the mean and maximum speeds attained while using the waterslide.
Introduction
Increased urbanization has led to decreased opportunities for children to explore the natural outdoor environment. In particular, due in part to the declining birthrate and increasing prevalence of small nuclear families, Japanese children are losing opportunities to learn experientially about diversified social structures1. The Ministry of Education, Culture, Sports, Science and Technology of Japan has reported an increasing number of elementary school students with developmental disabilities and associated social disability, although a causal relationship has been not demonstrated2,3. Moreover, an Organization for Economic Co-operation and Development (OECD) survey found that Japanese children in junior high school interact with social media more frequently than children in other countries, despite the fact that many families do not allow their children access to smartphones at an early age4. As parents have become more educationally oriented, children are no longer playing outside in high-risk activities and are spending more time indoors under the watchful eye of adults5. However, outside the home, which is diverse and full of unknowns and potential threats, is often the best educational environment in which children can learn and grow while finding their own challenges and learning to overcome difficulties by working together with friends6.
To encourage outdoor play, we held playpark events to afford children the opportunity to voluntarily experience nature through play and to socially interact and share challenges with friends and others7. The playpark is a special section in a city park where children can experience a variety of outdoor activities such as climbing trees, building playground equipment out of natural materials, and learning to build and manage a fire8. In a collaborative project to create a playpark in Ube City, Yamaguchi Prefecture, Japan, during 2018-2019, we explored how citizens could proactively create a nature-based experience for children. We set the following goals: (i) to facilitate social interaction by encouraging children to gather spontaneously, and (ii) to create an environment full of creative opportunity by utilizing natural resources such as the sky, soil, water, and trees9,10, and clean up the environment by using scrap cardboard. The events were scheduled to take place in four urban towns during the summer and fall. Given that most children instinctively love to play in water, we designed four waterslides that would take advantage of the regional resources. This report describes the results of Yamaguchi University's Ube City 2019 collaborative project "Play Leader Training Course", which was created through cooperation between the university and local citizens. Three events were completed in 2019; the fourth event occurred in 2021 during the period when COVID-19 was interfering with child socialization. The date and time of the playpark events is shown in Table 1. "Time" is the duration of the event and "Max time" is the 1 min period at each event that was quantitatively analyzed (the most active 1 min). This paper presents the four designs used, their implementation, and a quantitative evaluation of how the children interacted with the waterslides and each other during our observations.
Protocol
This study protocol was approved by the Yamaguchi University Review Committee for Non-Medical Research Involving Human Participants. See Table of Materials for a list of all materials, equipment, and software used in this protocol. Public announcements were made regarding the date, time, and location that children, along with their parent(s) or guardian(s), could gather to voluntarily collaborate to create, use, and then clean up a playpark in an environment designed to encourage their creativity.
1. Park landscapes and resources
- Conduct on-site surveys of the topography and resources of each park and specifically design the waterslides for each park to utilize the specific resources available. If possible, place the waterslides in an open area so they are visible from all directions to attract visitors to the playground.
NOTE: Figure 1 shows the Google Maps aerial view of each park, indicating the location and direction of the waterslide (WS). - Design and build waterslides based on the existing terrain.
NOTE: The slope and length of each waterslide is shown in Table 1.- To make a waterslide for a flat park (Park 1, WS1; Video 1):
- Design a tower structure using scaffolding pipes and clamps to allow for easy assembly of a strong but temporary structure (Figure 2Ab).
- Build the frame for the pool section of the waterslide from 3 m long bamboo rods (Figure 2Aa1). Ensure the waterslide (Figure 2Aa2) has an angle of 25°, a length of 1.8 m, and includes a pool at the bottom.
NOTE: Kuroishi Park is flat (Figure 2A).
- To make a waterslide for a hilly park (Park 2, WS2; Video 2), take advantage of the natural slope.
- As in step 1.2.1, construct a frame for the pool section from bamboo rods and plywood using regional resources (Figure 2B). Ensure that the waterslide has an angle of 30°, a length of 6 m, and includes a pool at the bottom.
NOTE: Kotosaki Park is hilly (Figure 1B).
- As in step 1.2.1, construct a frame for the pool section from bamboo rods and plywood using regional resources (Figure 2B). Ensure that the waterslide has an angle of 30°, a length of 6 m, and includes a pool at the bottom.
- If a park has a small slope in its center (Park 3, WS3; Video 3), create the waterslide using this small slope.
- Use bamboo rods and scaffolding to increase the natural slope (Figure 2C) upon which to build a waterslide, as in step 1.2.1. Ensure that the waterslide has an angle of 21° at its steepest, a length of 4 m, and includes a pool at the bottom.
NOTE: Kiwanami Park has small slope in its center (Figure 1C).
- Use bamboo rods and scaffolding to increase the natural slope (Figure 2C) upon which to build a waterslide, as in step 1.2.1. Ensure that the waterslide has an angle of 21° at its steepest, a length of 4 m, and includes a pool at the bottom.
- If present, use stairs to create a waterslide (School 4, WS4; Video 4).
- To cover the staircase, build a structure with plywood and square wooden rods (Supplemental File 1) covered with cardboard to form a rail to keep the children on the slide (Figure 2D, center drawing). Ensure that the waterslide has an angle of 27° and length of 6 m.
NOTE: Kamiube elementary school has a staircase in the schoolyard (Figure 1D).
- To cover the staircase, build a structure with plywood and square wooden rods (Supplemental File 1) covered with cardboard to form a rail to keep the children on the slide (Figure 2D, center drawing). Ensure that the waterslide has an angle of 27° and length of 6 m.
- Consider the safety of the playparks (Supplemental File 1).
- To verify the safety of the structures, calculate the strength using simulations such as Finite Element Methods (FEM) (e.g., Adobe Fusion 360; Supplemental File 1).
- Make a prototype. Have multiple people pilot the prototype to find any potential risks, such as hard/protruding parts. If found, eliminate or cover such parts with soft caps. Consider leaving some minimal risks to allow children to learn how to overcome the risks on their own (Supplemental File 1).
- To make a waterslide for a flat park (Park 1, WS1; Video 1):
- Cover the slope with a tarp to create a waterslide and pool area (Supplemental File 1).
- Supply water to the waterslide via a hose from the park water supply.
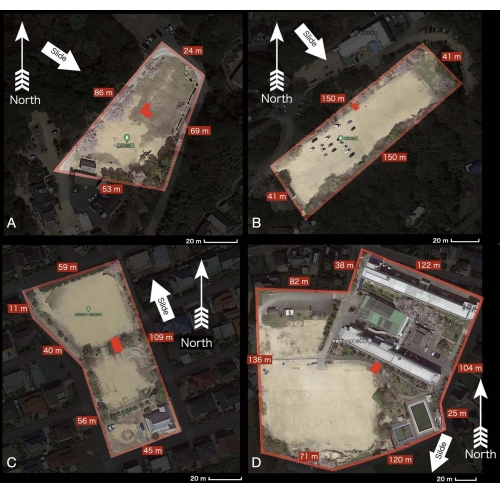
Figure 1: Park landscapes on Google maps. (A) WS1 at Park 1: Kuroishi. (B) WS2 at Park 2: Kotosaki. (C) WS3 at Park 3: Kiwanami. (D) WS4 at Elementary School 4: Kamiube. Scale bars = 20 m (A-D). Abbreviation: WS = waterslide. Please click here to view a larger version of this figure.
2. Assembling materials (see Table of Materials)
- Smooth and clean the material surface.
- Assemble the framework with pipes, boards, joints, screws, and ropes, using an impact driver and a saw (Supplemental File 1).
- Stake the corners of the framework into the ground.
- Fix cardboard cushions at the steps.
- Cover with the tarp to fit the shapes and secure with stakes and waterproof tape (Supplemental File 1).
- Run hose water down from the slide top.
- Check the safety repeatedly and reinforce as needed.
- Continually monitor the safety during use and repair any issues immediately.
3. Recording and quantitative analyses of activity
- Capture the children's use of the slides using video cameras.
- Estimate the ages of the children using each waterslide based on their height (Table 2).
- Assess the relationships between flow lines and activity level through qualitative observations and quantitative analyses, as shown in Figure 3.
- Convert video data to JPEG image files per second using Python (Supplemental File 2).
- Use Keynote to track each child's location with respect to the waterslide. Manually transform the location information to the top view image of the waterslide design (Supplemental File 2).
- Convert screenshots of a series of the object tracks to MP4 files (Supplemental File 2).
- Use Python detection on the MP4 files to determine object coordinates (Supplemental File 2) and calculate velocity (Supplemental File 2).
- Perform one-way ANOVA to determine the child motion [m/s] differences in WS1-4 against one another (put * if the p-value is <0.05).
Results
Children gathered, interacted socially, and played together at all the waterslides (Figure 4). Children using WS4 were estimated to be older that those at the other slides (Table 2). The representative child motion tracking pattern during 1 min of the maximum speed at each WS is visualized in Video 5. Figure 5 shows the representative IN-OUT line of motion around each waterslide. Two different motion lines, between substructure a and b, were detected for WS1 (Figure 5A). However, since the line at b did not connect to the waterslide, only the line at a was defined as being relevant to the waterslide. For waterslides with a pool at the bottom (WS1-3), some motion lines indicated use of the pool without using the slide (Figure 5A-C). Repeated up-and-down movement on the slide without exiting was also frequently observed (Figure 5A-C). Compared to WS1-3, the flow line for WS4 included repeated series of sliding down, then going up the side stairs, and sliding again without exiting (Figure 5D).
Additionally, we compared the mean and maximum movement of each individual child considering the area (Table 1) and the number of children using the waterslide (Figure 6A,B). The areas of WS1, WS2, and WS3 differed greatly from one another, but the children's level of movement at each were similar. The movement around WS4 was significantly higher than at the other slides.

Figure 2: Waterslide designs. (A) WS1 at Park 1. (B) WS2 at Park 2. (C) WS3 at Park 3. (D) WS4 at School 4. Abbreviation: WS = waterslide. Please click here to view a larger version of this figure.

Figure 3: Quantification analysis application flowchart and protocol. See protocol step 3. Please click here to view a larger version of this figure.
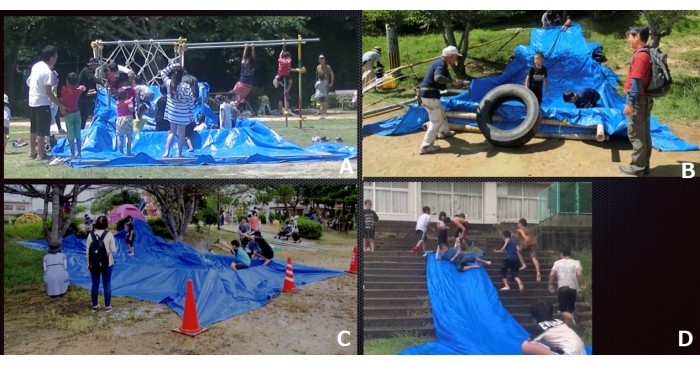
Figure 4: Scenes at the four waterslides. (A) WS1 at Kuroishi park. (B) WS2 at Kotosaki park. (C) WS3 at Kiwanami park. (D) WS4 at School 4. Please click here to view a larger version of this figure.
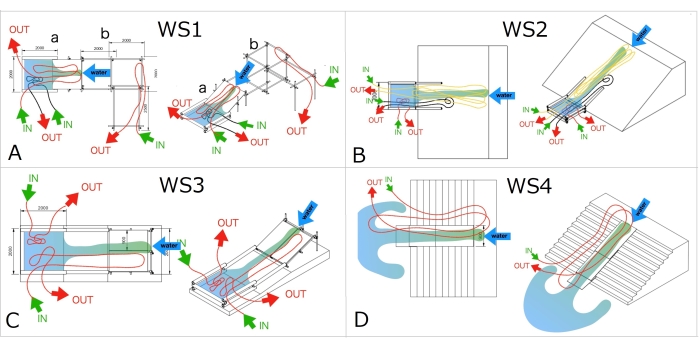
Figure 5: Representative IN-OUT lines of motion around each waterslide. (A) WS1: The most representative line at substructure a was red. Two different patterns were also seen: a black line at a, using the pool only, or an individual red line at b, not directing to a. (B) WS2: Three patterns appeared: a blue line using the whole slide with high speed, a black line using the slide partially, and a red line staying in the pool. (C) WS3: Two red lines represented either using or not using the slope substructure. (D) WS4: The behavioral pattern was unified (they used the slide). A-D: a = pool, b = waterslide; red = out; green = in. Abbreviation: WS = waterslide. Please click here to view a larger version of this figure.

Figure 6: Quantitative comparison of the four types of waterslides. Black circles represent means. Dots represent individual children. (A) The means of motion are compared. The numbers under WS1-4 labels indicate the highest number of children gathered on the slide during the same 1 min. (B) The maximum speed derived from the same data as A. * WS4 is significantly higher than the other WSs (one-way ANOVA, p < 0.05). Please click here to view a larger version of this figure.
| Park/School | Date | Time | Max Time | Slide Area (m2) | Slope (°) | Length (m) | ||
| Park 1 “Kuroishi” | 16-06-2019 | 13:00-16:00 | 14:21:30-14:22:30 | 3.2 | 25.0 | 1.8 | ||
| Park 2 “Kotosaki” | 31-08-2019 | 13:00-16:00 | 13:43:00-13:44:00 | 12.0 | 30.0 | 6.0 | ||
| Park 3 “Kiwanami” | 28-09-2019 | 12:00-16:00 | 12:49:00-12:50:00 | 8.0 | 21.0 | 4.0 | ||
| School 4 “Kamiube” | 08-08-2021 | 13:00-18:00 | 17:14:00-17:15:00 | 5.4 | 27.0 | 6.0 | ||
Table 1: Times of the playpark events and analytical target time, and waterslide information.
| WS # | Number of children | Child height [cm] | |
| mean | SD | ||
| Park 1 | 12 | 130.4 | 22.0 |
| Park 2 | 5 | 132.0 | 14.7 |
| Park 3 | 3 | 116.7 | 12.5 |
| School 4 | 8 | 147.5 | 12.0 |
Table 2: Height (mean and standard deviation) of the children playing at each waterslide during the "Max Time". The approximate heights of the children contributed to the prediction of age.
Video 1: The most active 1 min, "Max time", at WS1 at Kuroishi Park. This waterslide was designed at a park with no slope. Having to build a slope for the waterslide resulted in the waterslide having a relatively smaller area compared to the other waterslides. Many children still played together at this waterslide. Abbreviation: WS = waterslide. Please click here to download this Video.
Video 2: The most active 1 min, "Max time", at WS2 at Kotosaki Park. This waterslide was constructed at a park with a natural wide, steep (30°) and long slope. There was variation in how children used this slide. Some children sped down the slide, while others carefully walked up and down. Abbreviation: WS = waterslide. Please click here to download this Video.
Video 3: The most active 1 min, "Max time", at WS3 at Kiwanami Park. This event took place in 2019 prior to the COVID19 pandemic. At this waterslide, younger children were seen playing for longer times on the gentle slope. Please click here to download this Video.
Video 4: The most active 1 min, "Max time", at WS4 at Kamiube School. The fourth waterslide event took place in 2021 during the COVID19 pandemic. At this waterslide, older children repetitively sped down the slide together. The use of the stairs in this design may have contributed to this behavior. Please click here to download this Video.
Video 5: Each representative pattern of the most active child tracking motion at WS1-4. Please click here to download this Video.
Supplemental File 1: Safety considerations and assembly. Please click here to download this File.
Supplemental File 2: Child motion tracking methods with Python codes and keynote files. Please click here to download this File.
Discussion
These waterslides were set up with the goal of encouraging children to spontaneously gather in a city park and interact with one another and the natural environment. We emphasized the collaborative creative processes in which children, adults, students, and citizens worked together to design, build, and clean up the waterslides. All enjoyed working together to overcome the challenges11,12. Animal models have shown that deficits in this type of critical period learning experience13,14 may affect future social adaptability and psycho-emotional function2,15,16.
To create the waterslides, a ground slope (WS2, WS3) or stairs (WS4) were used. If there was no slope, a simple temporary slope was created by building a platform from boards and a single-pipe scaffold (WS1). Bamboo, a readily available regional resource17, was used for the waterslide frameworks in Parks 1-3. Bamboo grows quickly and must be controlled to prevent overgrowth, making its use in this application ideal18.
Regarding WS1, before confirming the motion tracking lines (Figure 5A), we had expected that the whole framework (Figure 2Aa1,a2,b) would be included in the waterslide structure. However, the motion tracking analysis revealed a clear division into two different substructure lines. Consequently, after this first trial and analysis of WS1, we simplified the waterslide design by removing the additional tower. Thus, the tower of WS1 (Figure 2Ab) was removed from the quantitative analysis.
All four types of slides attracted children to gather spontaneously. Activity at WS4 was higher than at the other slides, potentially because, based on our estimates (Table 2), the children using WS4 were older than at the other waterslides and therefore likely had more developed personalities. This could translate to children with more advanced social skills, construction ideas, and collaborative abilities. The activity difference could also be caused by the different waterslide designs; unlike the other slides that had a pool at the bottom where children could stay after sliding down, WS4 had no pool but side stairs that allowed the children to easily climb up again after sliding down, perhaps encouraging the simpler repetitive behavior. The location of the waterslide may also have been responsible for the higher activity at WS4. WS1-3 were at local parks, while WS4 was in a schoolyard, where it is reasonable to assume that the students were able to relax and play in their familiar surroundings. If educational and socioeconomic surveys could be collected for individuals using this equipment, the combination of information could provide insight into the children's neuropsychological development. In addition, the potential impact of COVID-19 must also be considered. Activity at WS4 was assessed in 2021, a time of ongoing COVID-related restrictions, whereas activity at WS1-3 took place prior to the pandemic. The activity level at WS4 could represent a response to the long period of reduced social play opportunities19. Due to the limitations inherent in these single observation events, further detailed studies including individual personal surveys are required.
To determine the mechanical safety of the framework designs20,21, a finite element simulation analysis22 was performed using Adobe Fusion (free version)23 for the bending of the plywood on the auxiliary support frame in the slide section. The auxiliary structure was designed to withstand a weight of 100 kg, assuming that four children weighing 25 kg each would use the slide at the same time (not shown). All the waterslides were successfully used by the children with no serious accidents. The tarp slipped down slightly and was corrected a few times. Only one incident was observed; this case involved a first-grade boy diagnosed with autism7,24. At first, the child seemed scared, but after watching the other children, he too wanted to join. The boy approached timidly and began to slide down slowly. After a few attempts, he slipped, fell, and hit his mouth on the slide surface. He suffered a small cut on the inside of his mouth. After this experience, he returned to his mother. We were concerned that this might be a negative experience for him. However, he subsequently participated in playpark events with great excitement and increased risk taking.
Disclosures
The authors declare no conflicts of interest associated with this manuscript.
Acknowledgements
We thank all the participants. The playpark events were supported by Ube city and Kuroishi, Kotosaki, Kiwanami, and Kamiube towns and schools along with Yamaguchi University.
Materials
| Name | Company | Catalog Number | Comments |
|---|---|---|---|
| WS1 | |||
| pipes (6) | NFG Ecostar 700N Φ48.6 mm x 0.9 m | ||
| pipes (27) | NFG Ecostar 700N Φ48.6 mm x 1.8 m | ||
| pipes (2) | NFG Ecostar 700N Φ48.6 mm x 2.4 m | ||
| cover (35) | for Φ48.6 mm | ||
| joint (36) | for Φ48.6 mm | ||
| Plywood boards (2) | 13 x 900 x 1800 mm | ||
| tarp (blue) (1) | 0.25 x 4500 x 4500 mm | ||
| bamboo rod (8) | 15 mm x 2000 mm | ||
| rope (1) | Φ18 mm x 200 m | ||
| PP rope (1) | Φ6 mm x 200 m | ||
| WS2 | |||
| tarp (blue) (1) | 0.25 x 4500 x 4500 mm | ||
| bamboo rod (8) | 15 mm x 2000 mm | ||
| PP rope (1) | Φ6 mm x 200 m | ||
| WS3 | |||
| Plywood boards (2) | 13 x 900 x 1800 mm | ||
| joint (11) | for Φ48.6 mm | ||
| tarp (blue) (1) | 0.25 x 4500 x 4500 mm | ||
| bamboo rod (7) | 15 mm x 2000 mm | ||
| PP rope (1) | Φ6 mm x 200 m | ||
| WS4 | |||
| Plywood boards (2) | 13 x 900 x 1800 mm | ||
| Plywood board (1) | 13 x 900 x 900 mm | ||
| wood SPF 2x4 | 38 x 89 x1820 mm | ||
| cardboard | free size | ||
| wood screw (1 box) | 3.3x50 mm | ||
| packing tape (2) | 50mmx50m | ||
| peg (4) | Φ9mmx300mm | ||
| Tool | |||
| Impact driver | 18v 160N • m | ||
| Hammer | 2 kg | ||
| Impact socket | 17mm | ||
| Bit for impact driver | + 65mm | ||
| Software | |||
| AUTODESK FUSION 360 2.0.12164 | Drawing designs | ||
| Blender (Version 3.0.0 2021-12-03) | Drawing designs | ||
| R | one-way ANOVA | ||
| Equipment | |||
| video cameras | (JVC, G Z -RX690-D) |
References
- Tei, S., et al. Decision flexibilities in autism spectrum disorder: an fMRI study of moral dilemmas. Social Cognitive and Affective Neuroscience. 17 (10), 904-911 (2022).
- Koshiba, M., et al. A cross-species socio-emotional behaviour development revealed by a multivariate analysis. Scientific Reports. 3, 2630(2013).
- Kishi, R., et al. Hokkaido birth cohort study on environment and children's health: cohort profile 2021. Environmental Health and Preventive Medicine. 26 (1), 59(2021).
- Schleicher, A. OECD programme for international student assessment 2018. Japanese Journal of Anesthesiology. 64 (1), 12-17 (2018).
- Løndal, K., Haugen, A. L. H., Lund, S., Riiser, K. Physical activity of first graders in Norwegian after-school programs: A relevant contribution to the development of motor competencies and learning of movements? Investigated utilizing a mixed methods approach. PLoS One. 15 (4), 0232486(2020).
- Moula, Z., Palmer, K., Walshe, N. A systematic review of arts-based interventions delivered to children and young people in nature or outdoor spaces: impact on nature connectedness, health and wellbeing. Frontiers in Psychology. 13, 858781(2022).
- Koshiba, M., et al. Psycho-cognitive intervention for ASD from cross-species behavioral analyses of infants, chicks and common marmosets. CNS & Neurological Disorders. Drug Targets. 5 (5), 578-886 (2016).
- Fjørtoft, I. The natural environment as a playground for children: The impact of outdoor play activities in pre-primary school children. Early Childhood Education Journal. 29 (2), 111-117 (2001).
- Chaney, A. J. Effects of Nature Play in Early Childhood Education. , (2021).
- Dowdell, K., Gray, T., Malone, K. Nature and its influence on children's outdoor play. Journal of Outdoor and Environmental Education. 15 (2), 24-35 (2011).
- Kemp, N., Josephidou, J. Babies and toddlers outdoors: a narrative review of the literature on provision for under twos in ECEC settings. Early Years. , 1-14 (2021).
- Spellings, M. Helping your child become a responsible citizen. Department of Education. , Washington, DC USA. Available from: https://www2.d.gov/parents/academic/help/citizen/citizen.pdf 4-5 (2005).
- Hensch, T. K. Critical period plasticity in local cortical circuits. Nature Reviews Neuroscience. 6 (11), 877-888 (2005).
- Nardou, R., et al. Oxytocin-dependent reopening of a social reward learning critical period with MDMA. Nature. 569 (7754), 116-120 (2019).
- Koshiba, M., et al. Peer attachment formation by systemic redox regulation with social training after a sensitive period. Scientific Reports. 3, 2503(2013).
- Koshiba, M., et al. A susceptible period of photic day-night rhythm loss in common marmoset social behavior development. Frontiers in Behavioral Neuroscience. 14, 539411(2021).
- Curriculum for excellence through outdoor learning. Education Scotland. , Available from: https://education.gov.scot/Documents/cfethrough-outdoor-learning.pdf (2010).
- Shozo, S. Bamboo resources for new usage in Japan. Proceeding of 10th World Bamboo Congress. , Korea. (2015).
- Combatting COVID-19's effect on children. Tackling Coronavirus. Contributing to a Global Effort. OECD. , Available from: https://www.oecd.org/coronavirus/policy-responses/combatting-covd-19-s-effect-on-children-2e1f3b2f#abstract-d1e24 1-41 (2020).
- Brooks, D., et al. Playground and division of early childhood development. , (2022).
- Consumer Product Safety Division. Public playground safety handbook: publication# 325. Consumer Product Safety Division. , (2015).
- Szabó, B. A., Actis, R. L., Holzer, S. M. Solution of elastic-plastic stress analysis problems by the p-version of the finite element method. Modeling, Mesh Generation, and Adaptive Numerical Methods for Partial Differential Equations. , Springer. New York, NY. 395-416 (1995).
- Fiedler, M. Understanding and Improving Your Results in Fusion 360 Simulation. , Available from: https://static.au-uw2-prd.autodesk.com/Class_Handout_MFG225930_Understanding_and_Improving_Your_Results_in_Fusion_360_Simulation_Michael_Fiedler.pdf 1-53 (2022).
- Vincent, L. B., Openden, D., Gentry, J. A., Long, L. A., Matthews, N. L. Promoting social learning at recess for children with ASD and related social challenges. Behavior Analysis in Practice. 11 (1), 19-33 (2018).
Reprints and Permissions
