The article is based on the creation of an adapted protocol to scan, detect, sort, and identify digitized objects corresponding to benthic river macroinvertebrates using a semi-automatic imaging procedure. This procedure allows the acquisition of the individual size distributions and size metrics of a macroinvertebrate community in about 1 h.
A subscription to JoVE is required to view this content. Sign in or start your free trial.
Method Article
Automatic Image Processing to Determine the Community Size Structure of Riverine Macroinvertebrates
In This Article
Summary
Abstract
Body size is an important functional trait that can be used as a bioindicator to assess the impacts of perturbations in natural communities. Community size structure responds to biotic and abiotic gradients, including anthropogenic perturbations across taxa and ecosystems. However, the manual measurement of small-bodied organisms such as benthic macroinvertebrates (e.g., >500 µm to a few centimeters long) is time-consuming. To expedite the estimation of community size structure, here, we developed a protocol to semi-automatically measure the individual body size of preserved river macroinvertebrates, which are one of the most commonly used bioindicators for assessing the ecological status of freshwater ecosystems. This protocol is adapted from an existing methodology developed to scan marine mesozooplankton with a scanning system designed for water samples. The protocol consists of three main steps: (1) scanning subsamples (fine and coarse sample size fractions) of river macroinvertebrates and processing the digitized images to individualize each detected object in each image; (2) creating, evaluating, and validating a learning set through artificial intelligence to semi-automatically separate the individual images of macroinvertebrates from detritus and artifacts in the scanned samples; and (3) depicting the size structure of the macroinvertebrate communities. In addition to the protocol, this work includes the calibration results and enumerates several challenges and recommendations to adapt the procedure to macroinvertebrate samples and to consider for further improvements. Overall, the results support the use of the presented scanning system for the automatic body size measurement of river macroinvertebrates and suggest that the depiction of their size spectrum is a valuable tool for the rapid bioassessment of freshwater ecosystems.
Introduction
Benthic macroinvertebrates are broadly used as bioindicators to determine the ecological status of water bodies1. Most indices to describe macroinvertebrate communities focus on taxonomic metrics. However, new bioassessment tools that integrate body size are encouraged to provide an alternative or complementary perspective to taxonomic approaches2,3.
Body size is considered a metatrait that is related to other vital traits such as metabolism, growth, respiration, and movement4. Furthermore, body size can determine trophic position and interactions5. The relationship between individual body size and the normalized biomass (or abundance) by size class in a community is defined as the size spectrum6 and follows the general pattern of a linear decrease in normalized biomass as individual size increases on a logarithmic scale7. The slope of this linear relationship has been extensively studied theoretically, and empirical studies across ecosystems have used it as an ecological indicator of the community size structure4. Another synthetic indicator of community size structure that has been successfully used in biodiversity-ecosystem functioning studies is community size diversity, which is represented as the Shannon index of the size classes of the size spectrum or its analog, which is calculated based on the individual size distributions8.
In freshwater ecosystems, the size structure of different faunal groups is used as an ataxic indicator to assess the response of biotic communities to environmental gradients9,10,11 and to anthropogenic perturbations12,13,14,15,16. Macroinvertebrates are not an exception, and their size structure also responds to environmental changes17,18 and anthropogenic perturbations, such as mining19, land use20, or nitrogen (N) and phosphorus (P) enrichment20,21,22. However, measuring hundreds of individuals to describe the community size structure is a tedious and time-consuming task that is often avoided as a routine measurement in laboratories due to a lack of time. Thus, several semi-automatic or automatic imaging methods to classify and measure specimens have been developed23,24,25,26. However, most of these methods are focused on taxonomic classification more than on the individual size of the organisms and are not ready to use for all kinds of macroinvertebrates. In marine plankton ecology, a scanning image analysis system has been extensively used to determine the size and taxonomic composition of zooplankton communities27,28,29,30,31. This instrument can be found in several marine institutes worldwide, and it is used to scan preserved zooplankton samples to obtain high-resolution digital images of the entire sample. The present protocol adapts the use of this instrument to estimate the macroinvertebrate community size spectrum in rivers in a rapid automatic manner without investing in creating a new device.
The protocol consists of scanning a sample and processing the whole image to automatically obtain single images (i.e., vignettes) of the objects in the sample. Several measures of shape, size, and grey-level features characterize each object and allow for the automatic classification of the objects into categories, which are then validated by an expert. The individual size of each organism is calculated using the ellipsoidal biovolume (mm3), which is derived from the area of the organism measured in pixels. This allows for obtaining the size spectrum of the sample in a rapid manner. To the best of our knowledge, this scanning imaging system has only been used to process mesozooplankton samples, but the device may potentially allow for working with freshwater benthic macroinvertebrates.
The overall goal of this study is, therefore, to introduce a method to rapidly obtain the individual size of preserved river macroinvertebrates by adapting an existing protocol previously used with marine mesozooplankton27,32,33. The procedure consists of using a semi-automatic approach that operates with a scanning device to scan water samples and three open software to process the scanned images. An adapted protocol to scan, detect, and identify digitized river macroinvertebrates to automatically acquire the community size structure and related size metrics is herein presented. The assessment of the procedure and guidelines to enhance the efficiency are also presented based on 42 scanned images of riverine macroinvertebrate samples collected from three basins in the North-Eastern (NE) Iberian Peninsula (Ter, Segre-Ebre, and Besòs).
The samples were collected at 100 m river stretches following the protocol for field sampling and laboratory analysis of benthic river macroinvertebrates in fordable rivers from the Spanish Government34. The samples were collected with a surber sampler (frame: 0.3 m x 0.3 m, mesh: 250 µm) following a multi-habitat survey. In the laboratory, the samples were cleaned and sieved through a 5 mm and a 500 µm mesh to obtain two subsamples: a coarse subsample (5 mm mesh) and a fine subsample (500 µm mesh), which were stored in separate vials and preserved in 70% ethanol. Separating the sample into two size fractions allows for a better estimation of the community size structure, since large organisms are rarer and fewer than the small organisms. Otherwise, the scanned sample has a biased representation of the large size fraction.
Access restricted. Please log in or start a trial to view this content.
Protocol
NOTE: The protocol described here is based on the system developed by Gorsky et al.27 for marine mesozooplankton. A specific description of the scanner (ZooSCAN), scanning software (VueScan 9x64 [9.5.09]), image processing software (Zooprocess, ImageJ), and automatic identification software (Plankton Identifier) steps can be found in previous references32,33. To best adjust the sizes of the benthic macroinvertebrates with respect to the mesozooplankton, once the project is created following the original protocol32,33, change the parameter of minimum size (minsizeesd_mm) to 0.3 mm and the parameter of maximum size (maxsizeesd_mm) to 100 mm in the configuration file. To help follow the protocol, this is summarized in a work chart (Figure 1). The created project is stored in the computer's C folder and is organized in the following folders: PID_process, Zooscan_back, Zooscan_check, Zooscan_config, Zooscan_meta, Zooscan_results, and Zooscan_scan. Each folder is composed of several subfolders that the different software applications use in the following steps of the protocol.
1. Acquisition of digital images for macroinvertebrate samples
- Scanning and processing the blank
NOTE: Create two blank images daily before scanning to extract the background scans while processing the scanned images on the same day.- Turn on the scanner and switch on the light in the dual position to project white light from the top and from the bottom.
NOTE: When scanning mesozooplankton samples, the upward light direction is used, but because macroinvertebrates are more opaque, it is recommended to switch the light to a dual position. - Clean and rinse the scan tray with tap water.
- Pour 110 mL of tap water stored at room temperature (RT) into the scan tray until the glass is covered. Place the large frame (24.5 cm x 15.8 cm) on the scan tray in the correct position (with the corner at the top-left part of the scan tray), and fill it with tap water until the step of the frame is covered to avoid a meniscus effect, which would alter the scanned image. Close the scanner lid.
NOTE: Use water at RT to avoid condensation and bubble formation. Clean the frame without marks or droplets to avoid light reflection. - Go to the image processing software, select the working project, and click on Scan (Convert) Background Image.
- Go to the scanning software and click on Preview. Ensure to preview the scanned image, check that there are no lines or spots, and wait for at least 30 s before starting another scan. Click on Scan and press OK in the instructions window before the second scan to send the data from the scanning software to the image-processing software.
NOTE: Scan twice to obtain the two background scans that will comprise the blank. This step is done once every day before starting the sample processing, and the images are stored in the Zooscan_back folder. - Close the scanning software after finishing the scan.
- Turn on the scanner and switch on the light in the dual position to project white light from the top and from the bottom.
- Sample preparation and scanning
CAUTION: Ethanol is a flammable liquid and could cause serious eye damage/irritation.- Fill in the sample metadata. Go to the image processing software and select Fill in Sample Metadata. Enter the sample identity, click on OK, and fill in the metadata.
NOTE: The metafile is specifically created for mesozooplankton samples, so it does not fit the benthic macroinvertebrate sampling methodology, yet all fields of the file need to be filled in before the scan, or an error flag will pop up. - Pour 110 mL of 70% ethanol into the scan tray until the glass is covered and place the large frame (24.5 cm x 15.8 cm) with the corner at the top-left part of the scan tray.
NOTE: Work with ethanol instead of water, as the macroinvertebrates are preserved in ethanol. In water, they float and drift in the scan tray, preventing a sharp image and, thus, reliable size measurements. Ethanol should be preserved at RT to avoid condensation and bubble formation. - Pour the macroinvertebrates sample into the scan tray edged by the frame, and cover the frame step with more ethanol if needed.
NOTE: Refrain from adding too much ethanol to avoid the organisms floating and drifting. - Homogenize the sample throughout the frame area, placing the largest individuals in the center of the tray for proper image processing, and sink the floating organisms using a wooden needle.
NOTE: If a subsample numerically contains more than 1,000 individuals, divide the subsample into two or more fractions to minimize touching organisms in the scanned image, and scan the fractions separately. - Separate the touching organisms and the organisms touching the frame edges using the wooden needle.
NOTE: This step requires 5-20 min. Touching organisms are considered a single object by the software; thus, in those cases, the calculated individual sizes do not correspond to actual single organisms and can bias the estimate of the community size structure. There is the possibility of editing the image with the image processing software to separate them, but this additional step involves at least 1.5 h of reprocessing; thus, manual separation is highly recommended. - To scan the sample, close the scanner lid, go to the image processing software, select the working project, and click on SCAN Sample with Zooscan (For Archive, No Process).
- Select the sample and follow the instructions.
- Go to the scanning software and click on Preview. Ensure to preview the scanned image, check that there are no lines or spots, and wait at least 30 s before starting another scan.
- After at least 30 s, click on the Scan button in the scanning software.
NOTE: Press OK in the image processing software after pressing Scan in the scanning software. Do not press any key on the computer keyboard, and avoid vibrations of the scan during the scanning. Three files are generated in the Zooscan_scan > _raw folder: (i) a tagged image file format (.tif) (16 bit); (ii) a standard text document named LOG (.txt) that records information on the scanning parameters; and (iii) a standard text document named META (.txt) with information on the sampling methods. - Verify that the raw scan is correct.
NOTE: If the scan has light stripes or other visible issues, consider repeating the scan to avoid problems in the following steps.
- Fill in the sample metadata. Go to the image processing software and select Fill in Sample Metadata. Enter the sample identity, click on OK, and fill in the metadata.
- Sample recovery
- Remove the frame and rinse it above the scan tray using a squeeze bottle filled with 70% ethanol to recover any attached macroinvertebrates.
- Lift the upper part of the scanner to retrieve all the organisms and ethanol from the tray through the scan retrieval funnel into a beaker. With the upper part of the scanner still lifted, rinse the tray with the squeeze bottle to sweep along any remaining organisms.
- Pass the specimens and ethanol from the beaker through a 500 µm mesh to retain the invertebrates in the mesh, and store them back in a vial with 70% ethanol.
- Once all the specimens are recovered in the vial, clean the tray with tap water.
NOTE: Wash the tray with tap water between samples to minimize ethanol precipitation, which alters the image processing. Rinse the frame with tap water to avoid potential damages related with ethanol use. At the end of the day, clean the tray using tap water and dry it gently with paper to avoid scratches.
- Image processing
- Go to the image processing software and select CONVERT & PROCESS Images and Organisms in Batch Mode and then Convert AND Process Image AND Particles (Image in RAW Folder). Keep the default settings and click on OK. NORMAL END will appear at the end of the process.
NOTE: A PID file and the vignettes corresponding to all the detected objects in the scanned image (in a Joint Photographic Group file [.jpg]) will be created in the Zooscan_scan > _work folder. A PID file is a single file that stores all the metadata (metafile), the technical data associated with the log file, and a table with 36 measured variables of all the objects detected in the image. The measured variables correspond to different estimates of grey level, fractal dimension, shape, and size. The variables that can be used for size estimation are the area and the major and minor axes of an ellipse with an equal area to the object (see section 3 of the protocol). The processing time depends on the image density and the computer characteristics, and can be launched between samples while recovering and preparing the next sample. Otherwise, it is recommended to launch the processing of the samples scanned each day in batch mode during the night and check for proper image processing the next morning. - Check if the background in the processed image is appropriately subtracted from the sample image using the image processing software or by checking the mask images (terminated in msk1.gif) located in Zooscan_scan > _work. If the background contains saturated areas or many dots, consider repeating the scan to ensure high-quality images.
NOTE: To avoid saturated areas in the background, the scan tray should be rinsed with tap water after every scan with ethanol. It is also important to (1) reduce the number of scanned individuals (by fractionating the sample and scanning in different folds); (2) ensure that big organisms are placed in the center of the scan tray; (3) use clean, filtered ethanol; (4) reduce dirtiness on the samples; (5) ensure that the volume of ethanol for the scanning is adequate; and (6) ensure that the delay between the preview of the sample and the scan is at least 30 s.
- Go to the image processing software and select CONVERT & PROCESS Images and Organisms in Batch Mode and then Convert AND Process Image AND Particles (Image in RAW Folder). Keep the default settings and click on OK. NORMAL END will appear at the end of the process.
- Separation of touching organisms
NOTE: When there are several vignettes with touching organisms, it is necessary to separate the images of the touching organisms from other organisms and/or from fibers/debris to ensure a proper estimate of the community size structure.- Go to the image processing software to detect the vignettes with multiple objects. Select SEPARATION Using Vignettes and press on OK. In the configuration selection window, keep the default settings and click on OK.
- In the SEPARATION from VIGNETTES window, keep the default settings, additionally select ADD Outlines on Vignettes, and then select the sample to edit.
- Separate the touching organisms in each vignette that pops up by drawing a line with the mouse (press the roll button to draw). Once the separation in a vignette is complete, click the X button in the upper-right corner of the window, and press YES to process the next one. Press NO to end and save the changes. At the end of the process, NORMAL END will appear if everything is correct.
- After separation, reprocess the image to obtain the updated object data. Go to the image processing software, click on PROCESS (Converted) Image (Process One), and select Process Again Particles from Processed Images in WORK Sub-Folders. Select the sample, and in the Single Image Process window, keep the default settings, check Work with Separation Mask (CREATE-MODIFY-INCLUDE), and then click on OK. At the end of the process, NORMAL END will appear if everything is correct.
- In the Separation Control window, press OK to save the image with the contours before the processing; if a previous image exists, it will be replaced.
- In the Separation Control Mask window, if needed, select EDIT to add separation lines to the mask using the mouse to separate touching organisms that have not appeared before in the separation using vignettes step. When finished, end the process, and in the Separation Mask Control window, select YES to accept the mask. At the end of the process, NORMAL END will appear if everything is correct.
NOTE: Reprocessing a sample with a separation mask is time-consuming (this could take more than 1.5 h per sample). It is preferable to dedicate the required time in step 1.2.5 to avoid this additional step.
2. Automatic recognition of the objects
NOTE: Create a learning set to automatically predict the identity of the detected objects, thus separating the organisms from the debris in the sample.
- Learning set creation
- Copy the images and the .pid files associated with the images that will be used to create the categories of the learning set from Zooscan_scan > _work to PID_process > Unsorted_vignettes_pid.
NOTE: Select a subset of samples with high taxa diversity and different sampling sites and/or sampling seasons to ensure maximum representativeness of organisms in the samples. - In the PID_process > Learning set folder, create a subfolder with the name of the new learning set (i.e., yyyymmdd_raw_LS), and inside it, create the subfolders that will correspond to each category of the learning set (i.e., macroinvertebrates, debris, other invertebrates).
NOTE: To efficiently obtain the community size structure of river macroinvertebrate samples, it is recommended to use a learning set based on just three categories: macroinvertebrates, other invertebrates, and debris. This learning set basically separates the vignettes of objects corresponding to organisms from those corresponding to debris (e.g., fibers, particles, or filamentous algae). - Go to the image processing software (Advanced mode only) and choose EXTRACT Vignettes for PLANKTON IDENTIFIER (unsorted vignettes for training). Keep the default options and check the Add Outlines box.
- Go to the automatic identification software, click on Learning, select from PID_process > Learning_set the created subfolder for the new learning set (step 2.1.2), and press OK.
- In the left section (Unsorted Thumbs) of the open window, select the folder Unsorted vignettes_pid. Select the vignettes and drag them with the mouse from the unsorted thumbs to the folder of their corresponding category in the right section, Sorted Thumbs, to classify each object into the defined categories. The moved vignettes will be marked with a red X.
NOTE: Define the categories manually by creating subfolders in the sorted thumbs folder or create them by clicking on the folders icon in the software. Do not move more than 50 vignettes at the same time. - Once all the categories are completed with the selected objects (about 300 objects per category), click on Create Learning File and save it with the desired name.
NOTE: The learning set will be saved as a .pid file in the PID_process > Learning set folder of the project. It is recommended to create and test several learning sets with different levels of categories (from coarse to fine forms) and with a different balance of the number of objects within each category. Start with a coarse learning set with a low number of categories and at least 50 objects per category, and then increase the number of objects in each category and/or create finer learning sets. A category should be representative of its variability in the set of samples.
- Copy the images and the .pid files associated with the images that will be used to create the categories of the learning set from Zooscan_scan > _work to PID_process > Unsorted_vignettes_pid.
- Evaluation of the learning set
NOTE: Perform cross-validation with two folds and five trials using the Random Forest method with the automatic identification software to obtain a confusion matrix of the resulting classification of the objects.- Go to the automatic classification software and click on Data Analysis.
- In Select learning file, select the created learning set file from PID_process > Learning set.
- In Select a method, choose the Cross-Validation Random Forest method. In Original Variables, untick the position variables (X, Y, XM, YM, BX, BY, and Height). In Customized Variables, tick only ESD.
NOTE: This method uses one random part of the learning set to recognize the other part (two folds), and this is repeated five times to ensure it is statistically robust. - Click on Start Analysis, and save the results as Analysis_name.txt in the PID_process > Prediction folder. When the analysis has been successfully completed, quit the data analysis.
- Go to the PID_process > Prediction folder and click on the cross-validation file. A window will pop up with the confusion matrix of the true classification (rows) versus the automatic classification (columns).
NOTE: The recall is the percentage of organisms belonging to a group that was automatically well recognized, whereas 1-precision is the percentage of organisms classified by the algorithm as a group that is not recognized (contamination in a group). The recall should be above 70%, and the contamination (1-precision) should be lower than 20%. - Repeat steps 2.1-2.5 if several learning sets were created and the recall and 1-precision of each one need to be obtained.
NOTE: If several learning sets have been created, choose the one with the greatest recall (good recognition) and precision (low contamination) of the group of interest (i.e., macroinvertebrates) to test the automatic prediction of a set of samples in the next step.
- Prediction of the identification of macroinvertebrates
NOTE: Use the selected learning set to predict the identity of all the objects in a subset of samples using the automatic identification software with a random forest algorithm.- Go to the automatic identification software and click on Data Analysis.
- In Select Learning file, select the learning set file from PID_process > Learning set that must be used for the prediction.
- In Select Sample File(s), select from the PID_results folder the samples (PID files) that are going to be predicted.
NOTE: Process a maximum of 20 .pid files at the same time to avoid errors related to memory problems. If too many .pid files are processed at the same time, the process will show a correct end but may not be processed well, and an error may occur in the next steps when processing with the image processing software. - In Select a Method, choose the Random Forest method. Tick Save Detailed Results for Each Sample. In Original Variables, untick the position variables (X, Y, XM, YM, BX, BY and Height). In Customized Variables, tick only ESD.
- Click on Start Analysis, and save the results as Analysis_name.txt in the PID_process > Prediction folder.
- Manual validation
NOTE: An expert manually validates the prediction from the previous step to reclassify misclassified objects into the correct category.- Copy the Analysis_sample_dat1.txt files to be validated from the PID_process > Prediction folder to the PID_process > Pid_results folder.
- Go to the image processing software and select EXTRACT Vignettes in Folders According to PREDICTION or VALIDATION. Then, select Use PREDICTED Files From "pid_results" Folder. Keep the default settings and press OK.
- The software creates a folder called sample_yyyymmdd_hhmm_to_validate with the predicted objects in the PID_process > Sorted vignettes folder.
- Go to the PID_process > Sorted vignettes folder, and copy the folder sample_yyyymmdd_ hhmm_to_validate. Replace the folder name _to validate with _validated.
- To manually validate the automatic classification, open the folder sample_yyyymmdd_ hhmm_validated, and review all the vignettes from each subfolder (category) in order to identify if there are misclassified objects. When one object is misclassified, drag the vignette using the mouse to the correct folder (category).
- Go to the image processing software and select LOAD Identifications from Sorted Vignettes. Keep the default settings and select yyyymmdd_hhmm_name_validated to be processed.
- Go to PID_process > Pid_results > Dat1_validated, where a file named Id_from_sorted_vignettes_yyyymmdd_hhmm.txt and one .txt file for each one of the validated samples (sample_tot_1_dat1.txt) have been created.
NOTE: These .txt files contain a new column that presents the prediction, called pred_valid_Id_yyyymmdd_hhmm, which specifies the expert classification of each object (i.e., the validated classification). New categories (e.g., finer taxonomic categories) could be created at this point, during validation. However, keep the name of the original category in the new name (e.g., macroinvertebrate_chironomidae). This allows for retracing the original category when calculating the recall and precision and for easily grouping all the macroinvertebrates to calculate the community size structure parameters (i.e., the size spectrum and size diversity). The text file provides the data associated with each object, including the minor and major axes that are used to obtain the ellipsoidal volume of each organism as a measure of individual body size. Moreover, the last two columns of the table contain the predicted and validated categories of each object (row), which allow for calculating, by category, the recall and precision of the learning set on the subset of samples.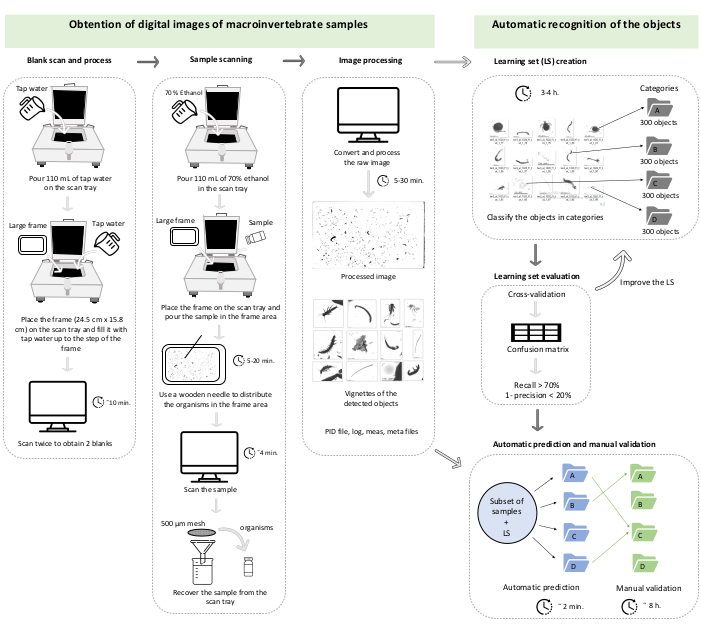
Figure 1: Work chart representing section 1 and section 2 of the protocol. The times are illustrative and could change depending on the computer, the abundance of vignettes to process, and the number of categories of the learning set. This case corresponds to the validation of a learning set of three categories on a set of 42 subsamples (in total, 47,473 vignettes). Please click here to view a larger version of this figure.
3. Calculating the individual size distribution, size spectra, and size metrics
NOTE: The calculations mentioned in this section were performed using Matlab (see script as Supplementary File 1).
- Individual size distribution
- The last column of the Id_from_sorted_vignettes_YYYYMMDD_HHHH.txt file contains the validated classification of the objects. Select only the objects classified as macroinvertebrates to depict their individual size distribution in the sample.
NOTE: Individual body size corresponds to the ellipsoidal volume of the macroinvertebrate organisms. The system provides measurements in pixels. - Concatenate the vectors with the size measurements from both scans, because each fraction has a different subsampling exponent. Before concatenation, correct for the fractionation by replicating the size vectors as many times as the corresponding subsample has been fractionated.
NOTE: This step is needed if a scan corresponds to a fraction of a sample (i.e., coarse or fine). - Calculate the ellipsoidal volume from the major (M) and minor (m) axes of prolate ellipsoids with the same pixel areas as the organisms. Before computing the ellipsoidal volume, convert the major (M) and minor (m) axes from pixels to millimeters (mm) with the following conversion factor (cf):
1 pixel = 2,400 dpi
1 in = 25.4 mm
cf = 25.4/2400
The ellipsoidal volume (ellipVol with units in mm3) corresponds to:

- Depict the probability density function of the individual size distribution on the log2 scale.
- The last column of the Id_from_sorted_vignettes_YYYYMMDD_HHHH.txt file contains the validated classification of the objects. Select only the objects classified as macroinvertebrates to depict their individual size distribution in the sample.
- Size diversity
- Calculate the size diversity (Sd) following Quintana et al. (2008)8, as in García-Comas et al. (2016)35:

where px(x) is the probability density function of size x, and x represents log2 (ellipVol). This measure is, therefore, the Shannon diversity index adapted to a continuous measure, such as the individual size distribution in a community.
- Calculate the size diversity (Sd) following Quintana et al. (2008)8, as in García-Comas et al. (2016)35:
- Normalized biovolume size spectrum (NBSS)
- Define the size classes of the NBSS, establishing the lower bound of the spectrum as the 0.01 quantile of the macroinvertebrate size distribution in the samples and creating size classes by a geometrical scale of base 2 until the largest organism in the samples is encompassed.
NOTE: The size class width increases with size to account for the greater variability associated with greater sizes. The NBSS of the macroinvertebrate communities analyzed here had 14 size classes (Table 1). - Obtain the normalized biovolume by dividing the total biovolume in each size class by the size class width.
- Define the size classes of the NBSS, establishing the lower bound of the spectrum as the 0.01 quantile of the macroinvertebrate size distribution in the samples and creating size classes by a geometrical scale of base 2 until the largest organism in the samples is encompassed.
- Size spectrum slope
- Calculate the linear slope of the NBSS.
NOTE: The slope (µ) is calculated based on the relationship between the log2 (size class mid-point) and the log2 (normalized biomass) in the size classes greater than the mode, ignoring any empty ones (in this study, the size classes from 3 to 14).
- Calculate the linear slope of the NBSS.
| Size class limits (mm3) | Size class mid-point (mm3) |
| 0,1236 | 0,1855 |
| 0,2473 | 0,3709 |
| 0,4946 | 0,7418 |
| 0,9891 | 1,4837 |
| 1,9783 | 1,4837 |
| 3,9560 | 5,9348 |
| 7,9131 | 11,8696 |
| 15,8261 | 23,7392 |
| 31,6522 | 47,4783 |
| 63,3044 | 94,9567 |
| 126,6089 | 189,9133 |
| 253,2178 | 379,8267 |
| 506,4300 | 7597,7000 |
| 1012,9000 | 15193,0000 |
| 2025,7000 |
Table 1: Size classes of the normalized biomass size spectrum (NBSS). The table also shows the 15 size class limits and the size class mid-points of the organisms.
Access restricted. Please log in or start a trial to view this content.
Results
Acquisition of digital images of macroinvertebrate samples
Scanning nuances: Ethanol deposition in the scan tray
While testing the system for macroinvertebrates, several scans were of poor quality. A dark saturated area in the background prevented normal processing of the image and the measurement of the individual sizes of the macroinvertebrates (Figure 2). Several reasons have been given for the appearance of saturated areas in the background or hi...
Access restricted. Please log in or start a trial to view this content.
Discussion
The adaptation of the methodology described by Gorsky et al. 2010 for riverine macroinvertebrates allows for high classification accuracy in estimating the community size structure in freshwater macroinvertebrates. The results suggest that the protocol can reduce the time for estimating the individual size structure in a sample to about 1 hour. Thus, the proposed protocol is intended to promote the routine use of macroinvertebrate size spectra as a fast and integrative bioindicator to assess the impact of perturbations i...
Access restricted. Please log in or start a trial to view this content.
Disclosures
The authors declare no potential competing interests.
Acknowledgements
This work was supported by the Spanish Ministry of Science, Innovation and Universities (grant number RTI2018-095363-B-I00). We thank the CERM-UVic-UCC members Èlia Bretxa, Anna Costarrosa, Laia Jiménez, María Isabel González, Marta Jutglar, Francesc Llach, and Núria Sellarès for their work in macroinvertebrate field sampling and laboratory sorting and David Albesa for collaborating in the sample scanning. We finally thank Josep Maria Gili and the Institut de Ciències del Mar (ICM-CSIC) for the use of the laboratory facilities and scanner device.
Access restricted. Please log in or start a trial to view this content.
Materials
| Name | Company | Catalog Number | Comments |
|---|---|---|---|
| Beaker | Labbox | Other containers could be used | |
| Dionized water | Icopresa | 8420239600123 | To dilute the ethanol |
| Funnel | Vitlab | 41094 | |
| Glass vials 8 ml | Labbox | SVSN-C10-195 | 1 vial/subsample |
| ImageJ Software | Free access | Version 4.41o/ Image processing software | |
| Large frame | Hydroptic | Provided by ZooScan | 24.5 cm x 15.8 cm |
| Monalcol 96 (Ethanol 96) | Montplet | 1050JE001 | |
| Plankton Identifier Software | Free access | Version 1.2.6/ Automatic identification software | |
| Sieve | Cisa | 26852.2 | Nominal aperture 500µ and nominal aperture 0,5 cm |
| Tweezers | Bondline | B5SA | Stainless, anti-magnetic, anti-acid |
| VueScan 9 x 64 (9.5.09) Software | Hydroptic | Version 9.0.51/ Sacn software | |
| Wooden needle | Any plastic or wood needle can be used | ||
| Zooprocess Software | Free access | Version 7.14/Image processing software | |
| ZooScan | Hydroptic | 54 | Version III/ Scanner |
References
- Birk, S., et al. Three hundred ways to assess Europe's surface waters: An almost complete overview of biological methods to implement the Water Framework Directive. Ecological Indicators. 18, 31-41 (2012).
- Basset, A., Sangiorgio, F., Pinna, M. Monitoring with benthic macroinvertebrates: advantages and disadvantages of body size descriptors. Aquatic Conservation: Marine and Freshwater Ecosystems. 14, S43-S58 (2004).
- Reyjol, Y., et al. Assessing the ecological status in the context of the European Water Framework Directive: Where do we go now. Science of the Total Environment. 497-498, 332-344 (2014).
- Brown, J. H., Gillooly, J. F., Allen, A. P., Savage, V. M., West, G. B. Toward a metabolic theory of ecology. Ecology. 85 (7), 1771-1789 (2004).
- Woodward, G., et al. Body size in ecological networks. Trends in Ecology & Evolution. 20 (7), 402-409 (2005).
- Sprules, W. G., Barth, L. E. Surfing the biomass size spectrum: Some remarks on history, theory, and application. Canadian Journal of Fisheries and Aquatic Sciences. 73 (4), 477-495 (2016).
- White, E. P., Ernest, S. K. M., Kerkhoff, A. J., Enquist, B. J. Relationships between body size and abundance in ecology. Trends in Ecology & Evolution. 22 (6), 323-330 (2007).
- Quintana, X. D., et al. A nonparametric method for the measurement of size diversity with emphasis on data standardization. Limnology and Oceanography - Methods. 6 (1), 75-86 (2008).
- Blanchard, J. L., Heneghan, R. F., Everett, J. D., Trebilco, R., Richardson, A. J. From bacteria to whales: Using functional size spectra to model marine ecosystems. Trends in Ecology & Evolution. 32 (3), 174-186 (2017).
- Petchey, O. L., Belgrano, A. Body-size distributions and size-spectra: Universal indicators of ecological status. Biology Letters. 6 (4), 434-437 (2010).
- Emmrich, M., et al. Geographical patterns in the body-size structure of European lake fish assemblages along abiotic and biotic gradients. Journal of Biogeography. 41 (12), 2221-2233 (2014).
- Arranz, I., Brucet, S., Bartrons, M., García-Comas, C., Benejam, L. Fish size spectra are affected by nutrient concentration and relative abundance of non-native species across streams on the NE Iberian Peninsula. Science of the Total Environment. 795, 148792(2021).
- Vila-Martínez, N., Caiola, N., Ibáñez, C., Benejam, L. l, Brucet, S. Normalized abundance spectra of the fish community reflect hydropeaking on a Mediterranean large river. Ecological Indicators. 97, 280-289 (2019).
- Benejam, L. l, Tobes, I., Brucet, S., Miranda, R. Size spectra and other size-related variables of river fish communities: systematic changes along the altitudinal gradient on pristine Andean streams. Ecological Indicators. 90, 366-378 (2018).
- Sutton, I. A., Jones, N. E. Measures of fish community size structure as indicators for stream monitoring programs. Canadian Journal of Fisheries and Aquatic Sciences. 77 (5), 824-835 (2019).
- Murry, B. A., Farrell, J. M. Resistance of the size structure of the fish community to ecological perturbations in a large river ecosystem. Freshwater Biology. 59, 155-167 (2014).
- Townsend, C. R., Thompson, R. M. Body size in streams: Macroinvertebrate community size composition along natural and human-induced environmental gradients. In Body Size: The Structure and Function of Aquatic Ecosystems. Hildrew, A. G., Raffaelli, D. G., Edmonds-Brown, R. , Cambridge University Press. Cambridge, UK. (2007).
- Gjoni, V., et al. Patterns of functional diversity of macroinvertebrates across three aquatic ecosystem types, NE Mediterranean. Mediterranean Marine Science. 20 (4), 703-717 (2019).
- Pomeranz, J. P. F., Warburton, H. J., Harding, J. S. Anthropogenic mining alters macroinvertebrate size spectra in streams. Freshwater Biology. 64 (1), 81-92 (2019).
- García-Girón, J., et al. Anthropogenic land-use impacts on the size structure of macroinvertebrate assemblages are jointly modulated by local conditions and spatial processes. Environmental Research. 204, 112055(2022).
- Demi, L. M., Benstead, J. P., Rosemond, A. D., Maerz, J. C. Experimental N and P additions alter stream macroinvertebrate community composition via taxon-level responses to shifts in detrital resource stoichiometry. Functional Ecology. 33 (5), 855-867 (2019).
- Basset, A., et al. A benthic macroinvertebrate size spectra index for implementing the Water Framework Directive in coastal lagoons in Mediterranean and Black Sea ecoregions. Ecological Indicators. 12 (1), 72-83 (2012).
- Ärje, J., et al. Automatic image-based identification and biomass estimation of invertebrates. Methods in Ecology and Evolution. 11 (8), 922-931 (2020).
- Raitoharju, J., et al. Benchmark database for fine-grained image classification of benthic macroinvertebrates. Image and Vision Computing. 78, 73-83 (2018).
- Lytle, D. A., et al. Automated processing and identification of benthic invertebrate samples. Journal of the North American Benthological Society. 29 (3), 867-874 (2010).
- Serna, J. P., Fernández, D. S., Vélez, F. J., Aguirre, N. J. An image processing method for recognition of four aquatic macroinvertebrates genera in freshwater environments in the Andean region of Colombia. Environmental Monitoring and Assessment. 192, 617(2020).
- Gorsky, G., et al. Digital zooplankton image analysis using the ZooScan integrated system. Journal of Plankton Research. 32 (3), 285-303 (2010).
- Marcolin, C. R., Schultes, S., Jackson, G. A., Lopes, R. M. Plankton and seston size spectra estimated by the LOPC and ZooScan in the Abrolhos Bank ecosystem (SE Atlantic). Continental Shelf Research. 70, 74-87 (2013).
- Silva, N., Marcolin, C. R., Schwamborn, R. Using image analysis to assess the contributions of plankton and particles to tropical coastal ecosystems. Estuarine, Coast and Shelf Science. 219, 252-261 (2019).
- Vandromme, P., et al. Assessing biases in computing size spectra of automatically classified zooplankton from imaging systems: A case study with the ZooScan integrated system. Methods in Oceanography. 1-2, 3-21 (2012).
- Naito, A., et al. Surface zooplankton size and taxonomic composition in Bowdoin Fjord, north-western Greenland: A comparison of ZooScan, OPC and microscopic analyses. Polar Science. 19, 120-129 (2019).
- García-Comas, C., Picheral, E. Zooprocess/Plankton Identifier protocol for computer assisted zooplankton sorting. , Available from: https://manualzz.com/doc/43116355/zooprocess—plankton-identifier-protocol-for (2013).
- Picheral, E. ZooSCAN: Manual to scan and process samples. Quantitative Imaging Platform of Villefranche sur Mer (PlQv). , Available from: http://www.hydroptic.com/assets/uploads/files/documentations/ae4e0-zooscan_user_manual.pdf (2020).
- Protocolo de muestreo y laboratorio de fauna bentónica de invertebrados en ríos vadeables. CÓDIGO: ML-Rv-I-2013. Ministerio de Agricultura, Alimentación y Medio Ambiente. , Available from: https://www.miteco.gob.es/es/agua/temas/estado-y-calidad-de-las-aguas/ML-Rv-I-2013_Muestreo%20y%20laboratorio_Fauna%20bent%C3%B3nica%20de%20de%20invertebrado_%20R%C3%Ados%20vadeables_24_05_2013_tcm30-175284.pdf (2013).
- García-Comas, C., et al. Prey size diversity hinders biomass trophic transfer and predator size diversity promotes it in planktonic communities. Proceedings of the Royal Society Biological Sciences. 283 (1824), 20152129(2016).
- García-Comas, C., et al. Mesozooplankton size structure in response to environmental conditions in the East China Sea: How much does size spectra theory fit empirical data of a dynamic coastal area. Progress in Oceanography. 121, 141-157 (2014).
- Marquina, D., Buczek, M., Ronquist, F., Lukasik, P. The effect of ethanol concentration on the morphological and molecular preservation of insects for biodiversity studies. PeerJ. 9, 10799(2021).
- Bell, J. L., Hopcroft, R. R. Assessment of ZooImage as a tool for the classification of zooplankton. Journal of Plankton Research. 30 (12), 1351-1367 (2008).
- Colas, F., et al. The ZooCAM, a new in-flow imaging system for fast onboard counting, sizing and classification of fish eggs and metazooplankton. Progress in Oceanography. 166, 54-65 (2018).
- Bachiller, E., Fernandes, J. A., Irigoien, X. Improving semiautomated zooplankton classification using an internal control and different imaging devices. Limnology and Oceanography Methods. 10 (1), 1-9 (2012).
Access restricted. Please log in or start a trial to view this content.
Reprints and Permissions
