We report a stage-top, flexible environmental chamber for time-lapse imaging of live cells using upright stimulated Raman scattering microscopy with transmitted signal detection. Lipid droplets were imaged in SKOV3 cells treated with oleic acid for up to 24 h with a 3 min time interval.
Method Article
A Flexible Chamber for Time-Lapse Live-Cell Imaging with Stimulated Raman Scattering Microscopy
In This Article
Summary
Abstract
Stimulated Raman scattering (SRS) microscopy is a label-free chemical imaging technology. Live-cell imaging with SRS has been demonstrated for many biological and biomedical applications. However, long-term time-lapse SRS imaging of live cells has not been widely adopted. SRS microscopy often uses a high numerical aperture (NA) water-immersion objective and a high NA oil-immersion condenser to achieve high-resolution imaging. In this case, the gap between the objective and the condenser is only a few millimeters. Therefore, most commercial stage-top environmental chambers cannot be used for SRS imaging because of their large thickness with a rigid glass cover. This paper describes the design and fabrication of a flexible chamber that can be used for time-lapse live-cell imaging with transmitted SRS signal detection on an upright microscope frame. The flexibility of the chamber is achieved by using a soft material - a thin natural rubber film. The new enclosure and chamber design can be easily added to an existing SRS imaging setup. The testing and preliminary results demonstrate that the flexible chamber system enables stable, long-term, time-lapse SRS imaging of live cells, which can be used for various bioimaging applications in the future.
Introduction
Optical microscopy is used to observe the microstructures of samples. Optical imaging is rapid, less invasive, and less destructive than other technologies1. Live-cell imaging with optical microscopy is developed to capture the dynamics of cultured live cells over a long period2. Different types of optical contrasts provide distinct information about biological samples. For instance, optical phase microscopy shows the subtle difference in the refractive indices across the sample3. Fluorescence microscopy is widely used to image specific biomolecules or cellular organelles. However, the broadband excitation and emission spectra of fluorescence usually result in spectral overlapping when multicolor imaging is performed4. Fluorescent molecules are light-sensitive and can be bleached after long-term, periodic light exposure. In addition, fluorescence labeling may change the biodistribution of the molecules in cells5. SRS microscopy is a label-free chemical imaging technology6. The contrast of SRS relies on the vibrational transition of specific chemical bonds. The vibrational frequency of a chemical bond often exhibits a narrow spectral bandwidth, making it feasible to image multiple Raman bands in the same samples7. SRS microscopy is a unique tool for live-cell imaging, providing multiple chemical contrasts in a label-free manner8.
While SRS imaging of unstained cells has been used for many studies, long-term time-lapse SRS imaging of live cells has not been widely adopted. One reason is that commercial open chambers cannot be directly used for SRS imaging because of their large thickness9,10,11,12. These chambers with a glass lid are mostly designed for brightfield or fluorescence imaging using a single high NA objective with a backward detection scheme. However, SRS imaging prefers transmitted detection using both a high NA objective and a high NA condenser, which leaves only a very short gap (typically a few millimeters) between the objective and the condenser. To overcome this problem, we designed a flexible chamber using a soft material to enable time-lapse SRS imaging of live cells using an upright microscope frame. In this design, the water dipping objective was enclosed in the soft chamber and can freely move in three dimensions for focusing and imaging purposes.
The optimal temperature for culturing most mammalian cells is 37 °C, while the room temperature is always 10° lower than this. Temperature higher or lower than 37 °C has a dramatic effect on cell growth rate13. Therefore, temperature control of the cell culture environment is required in a live-cell imaging system. It is known that temperature instability will lead to defocusing issues during long-term imaging14. To achieve a stable 37 °C environment, we built a large enclosure chamber to cover the entire microscope frame, including a thermal insulation layer underneath the microscope (Figure 1). Within the sizeable temperature-control chamber, the small flexible chamber helps to accurately maintain the physiological humidity and pH via the regulated air flow supplemented with 5% CO2 (Figure 2). The temperature and humidity of the chambers were measured to confirm that the double-chamber design provided the optimal cell culture condition for cell growth under long-term, periodic SRS imaging (Figure 3). We then demonstrated the application of the system for time-lapse imaging and tracking lipid droplets (LDs) in SKOV3 cancer cells (Figure 4, Figure 5, and Figure 6).
Protocol
1. Build the microscope environmental enclosure
NOTE: This large microscope environmental enclosure is used to control the temperature of the microscope body and the imaging environment to be stabilized at 37 °C (Figure 1A).
- Mark the locations of the feet of the SRS microscope frame and the motorized stage using a marker pen on the optical table. Mount two Iris Diaphragms in front of the Galvanometer scanner of the microscope and adjust to make the pump and Stokes laser beams pass through the center of the Iris Diaphragms.
- Remove the microscope frame and the stage from the optical table.
- Lay the silicone rubber sheet (size: 31 x 29 inches, thickness: 1/8 inch) on the optical table (Figure 1B).
- Cut the silicone rubber along the marks using a knife, remove small rubber pieces, and place the square MICA ceramic sheets (size: 6 x 6 inches, thickness: 1/4 inch) into the same locations.
NOTE: MICA ceramic is an easy-to-machine material15. It is as hard as aluminum but is an excellent thermal insulator. MICA ceramic sheets were used to stop heat transfer from the metal microscope frame and stage to the stainless-steel optical table. A few through-holes should be drilled on the MICA sheets to allow the use of ¼-20 screws for mounting the feet of the frame and the stage. - Move the microscope frame and the stage back to the optical table and carefully align the feet onto the MICA ceramic sheets along the marker lines. Use ¼-20 screws to mount the frame and the stage on the table.
- Realign the SRS optical path. Adjust the mirror mounts of Mirror 1 and Mirror 2 to make the laser beam pass through the center of the two premounted Iris Diaphragms (Figure 2).
NOTE: Technical details of the lab-built SRS microscope used for the current live-cell imaging work are described previously16. The pulse width of the pump and Stokes beams are ~3-4 ps with glass rod dispersion. The system is controlled using the ScanImage17 software. - On top of this thermal insulation foundation, assemble the environmental enclosure to cover the entire microscope frame using five pieces of large polycarbonate sheets (size: 31 x 29 x 28 inches, thickness: 0.25 inch).
NOTE: The size of the enclosure box is determined based on the dimensions of the microscope frame and the stage. The front panel of the microscope enclosure box will need to be removed temporarily to install the flexible chamber and load the cell culture dish.- To assemble the enclosure, carry out simple machining work, including cutting, drilling, and tapping screw holes on each edge of the polycarbonate sheets. Cut two large holes with a diameter of 2.6 inches on the right and the left sheets of the enclosure to fit the inlet and outlet tubing, respectively. Cut a small hole with a diameter of 5 mm on the back sheet to allow the laser beams to enter the enclosure.
- Seal the edges and interfaces of the box using aluminum foil tape.
- Connect the flexible duct hose to the inlet and the outlet ports of the enclosure box to allow circulated warm airflow pumped and controlled by the heater module. Place the thermal sensor of the heater module in the flexible chamber where the cells are cultured and imaged. Set the targeted temperature at 37 °C.
NOTE: A diffuser may be used to get a more uniform airflow distribution in the environmental enclosure.
2. Assemble the flexible chamber
- Mount the machined hollow cylindrical aluminum piece 1 (material: aluminum 6061) to the nosepiece of the objective using three set screws (Figure 2).
- Mount the machined hollow cylindrical aluminum piece 2 to the sample holder using four ¼-20 screws (Figure 2).
NOTE: The sample holder must be modified to hold the 50 mm cover glass-bottom cell culture dish. Drill a through hole in the center of the sample holder using a 1-7/8 inches hole saw. Counterbore the hole using a 50 mm hole saw and keep the depth of the through hole ~1 mm. - Fit the sample holder with the aluminum piece 2 onto the motorized stage and mount it using screws.
- Place the natural rubber film sleeve (thickness: 0.01 inch; glued with cyanoacrylate adhesive) between the two machined aluminum pieces and mount it using rubber bands at each end.
- Connect the compressed CO2 cylinder to the gas mixer module using proper tubing and connectors. Set the CO2 input pressure at 20-25 psi. Use a built-in CO2 sensor and a controller to ensure the air mixer module can regulate and mix 5% CO2 into the airflow. Use inline filters to clean up the airflow.
- Using proper tubing and connectors, guide the mixed air (with 5% CO2) to the presterilized water bottle placed on the hot plate, and then guide the humidified air to the flexible chamber. Set the hot plate at 37 °C. Bubble the airflow in the warm water to increase the humidity of the airflow.
3. Preparation for time-lapse live-cell SRS imaging experiments
- Wipe all parts of the flexible chamber with 70% ethanol, including the nosepiece, the water dipping objective, and the sample holder.
- Decontaminate the entire enclosure system using a UV lamp placed in the enclosure for 20 to 30 min.
NOTE: Do not stay in the lab room during the UV disinfection process for safety. - Culture SKOV3 cells in a 50-mm glass-bottom Petri dish for 12 h under normal physiological conditions in a regular incubator.
NOTE: Start the SKOV3 cell culture18 in a standard biosafety cabinet. - Disconnect the machined aluminum piece 2 from the sample holder by removing the screws.
NOTE: This is the way to open the flexible chamber to load the cell culture dish. - Load the cell culture dish. Remember to add immersion oil on the top of the condenser before placing the cell culture dish. Remove the cover of the dish and immobilize the dish using the clamps.
NOTE: To avoid contamination, all the operations should be performed with gloves. - Lower the objective into the cell culture media for coarse focusing. Lower the aluminum piece 2 to enclose the flexible chamber and mount it to the sample holder using screws.
NOTE: A 2 mm silicone rubber cushion pad is attached to the bottom of the aluminum piece 2 to seal the gap tightly. - Set the air supply with 5% CO2 and 19% O2 for normal cell culture with an airflow rate of 200 cc/min.
NOTE: A lower airflow rate may be used. It depends on how well the flexible chamber is sealed.
4. Conduct time-lapse live-cell SRS imaging experiments
- Tune the laser wavelength to 805 nm to target the 2854 cm-1 Raman shift, which is attributed to the vibration of CH2 chemical bonds. Use low laser power to reduce photodamage to the cells. To follow this protocol, use ~15 mW average power of the pump laser and ~7.5 mW of the Stokes laser (fixed at 1,045 nm) for long-term live-cell imaging.
NOTE: Higher laser power will yield better SRS imaging quality. However, too high laser power will induce photodamage to live cells. There is a tradeoff between image quality and photodamage. - Adjust and focus the objective to achieve good SRS imaging of the cells using the FOCUS button on the MAIN CONTROLS panel of the software. To perform rapid focusing, set the pixel number to be 512 × 512 pixels with a pixel dwell time of 4.8 µs on the CONFIGURATION panel.
- Set the lock-in amplifier input range (typically 5 mV) to be twice the maximal signal voltage. Set the low-pass filter to be the same as the pixel dwell time (4.8 µs).
NOTE: Different lab-built SRS systems may use different data acquisition settings. - After achieving good focusing, set the imaging resolution to be 2,048 × 2,048 pixels for a 175 µm2 field of view for the acquisition of high-quality images. Check the SAVE function on the MAIN CONTROLS panel and check the SRS channel on the CHANNELS panel. Set the interval time between two frames to be 180 s (3 min) on the MAIN CONTROLS channel. Set the acquisition number to 480 for time-lapse imaging over 24 h.
NOTE: A lower imaging resolution may be used based on the purpose of the experiments. - Start automated imaging acquisition using the LOOP function on the MAIN CONTROLS panel.
NOTE: Check whether there is focal drift due to temperature instability in the first hour of imaging. The first-hour imaging may not be stable. Check focusing every 2-3 h during the time-lapse imaging session. - Process the collected images using ImageJ19. Use the following two methods for LD quantification: (i) the LD/cell body area ratio, and (ii) the mean SRS intensity of total LDs. Measure the cell body area by thresholding and zeroing the non-cellular pixels in the SRS images at 2,854 cm-1. Measure the LD area and intensity by thresholding and zeroing the non-LD pixels in the SRS images.
NOTE: More details about SRS image processing were reported previously16.
Results
We fabricated and assembled the flexible chamber system for time-lapse SRS imaging (Figure 1 and Figure 2), and then evaluated the performance of the system. The temperature inside the microscope environmental enclosure reached the expected 37 °C within 1 h, which did not significantly affect the room temperature (Figure 3A). The temperature in the flexible chamber reached 37 °C in 1.5 h, and it was stably maintained at 37 °C for at least 24 h (Figure 3B). The relative humidity in the flexible chamber could reach 85% in 1 h, and then be maintained for at least 24 h (Figure 3C). The measured temperature and humidity data confirm that this system can provide an optimal environment for long-term cell growth.
Live-cell imaging with SRS has been applied to many biological and biomedical studies20,21,22,23,24. In particular, SRS imaging of label-free LDs in live cells to understand lipid metabolism in cancer has drawn much attention16,25,26. Using the designed flexible chamber system, we first performed time-lapse SRS imaging of live SKOV3 cells for 24 h with a time interval of 3 min (Figure 4). The video data showed the rapid and active movement of intracellular LDs with a temporal resolution of 3 min. By the end of the 24 h imaging session, the cells still showed normal morphology and density, indicating that the cells were healthy. We then imaged SKOV3 cells treated with oleic acid (OA) and tracked the dynamic process of LD accumulation within 10 h (Figure 5A).
The LD amounts were quantified in the OA-treated SKOV3 cells in two ways (LD to cell body area ratio and total SRS intensity of the LDs) using ImageJ19. The results indicate that the amount of LDs (in size and number) kept increasing over 10 h (Figure 5B). We also demonstrated simultaneous forward-SRS imaging of LDs (pseudo color green) and backward two-photon fluorescence (TPF) imaging of lysosomes (pseudo color red) labeled with a fluorescence dye DND-189 (Figure 6). It is noted that SRS/TPF dual-modality imaging can be used to analyze the colocalization of two cellular compartments. In this experiment, a very low degree of colocalization of LDs and lysosomes was observed, which was indicated by the small yellow regions. Collectively, these results demonstrate that the flexible chamber system enables stable, long-term, time-lapse SRS imaging of live cells, which can be used for various imaging applications in the future.

Figure 1: The flexible chamber system for time-lapse SRS imaging of live cells. (A) Schematic of the flexible chamber system for time-lapse SRS imaging of live cells. (B) The image on the left shows the thermal insulation layer using a silicone rubber sheet and MICA ceramic pads underneath the microscope frame and the stage. The image on the right shows the environmental microscope enclosure and the flexible chamber. Abbreviations: SRS = stimulated Raman scattering; CCM = cubic centimeters per min. Please click here to view a larger version of this figure.

Figure 2: Schematic and images of the flexible chamber with the SRS optical path, allowing three-dimensional free movement of the water dipping objective for focusing and imaging. The left images show the two machined aluminum modules connected to a commercial objective nosepiece and a modified sample holder. The bottom images show the assembly flexible chamber system. Abbreviation: SRS = stimulated Raman scattering. Please click here to view a larger version of this figure.

Figure 3: Temperature and humidity data of the microscope enclosure and the flexible chamber. (A) The measured temperature data of the microscope enclosure and the lab room temperature, up to 12 h. (B) The measured temperature data (average at 37 °C) within the flexible chamber, up to 24 h. (C) The measured relative humidity data (average at 85%) within the flexible chamber, up to 24 h. Please click here to view a larger version of this figure.
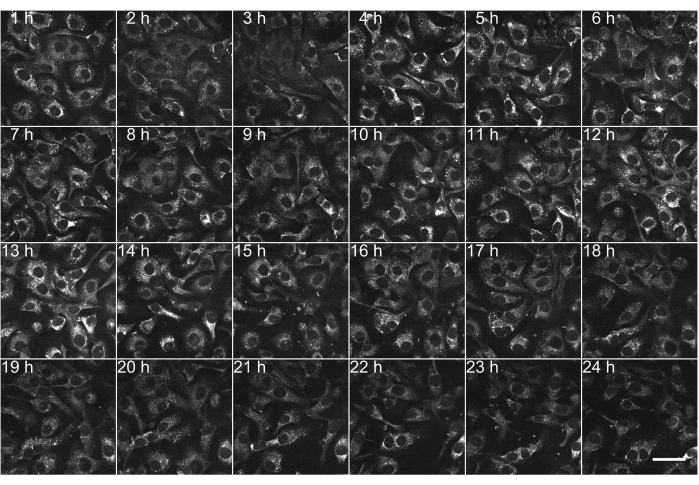
Figure 4: Representative 24 frames of time-lapse SRS imaging. Time-lapse SRS imaging (at 2,854 cm-1) of live SKOV3 cells using the flexible chamber, up to 24 h. In this experiment, 480 frames were recorded with a fixed time interval of 3 min. Cells were cultured under normal conditions. Scale bar = 50 µm. Please click here to view a larger version of this figure.
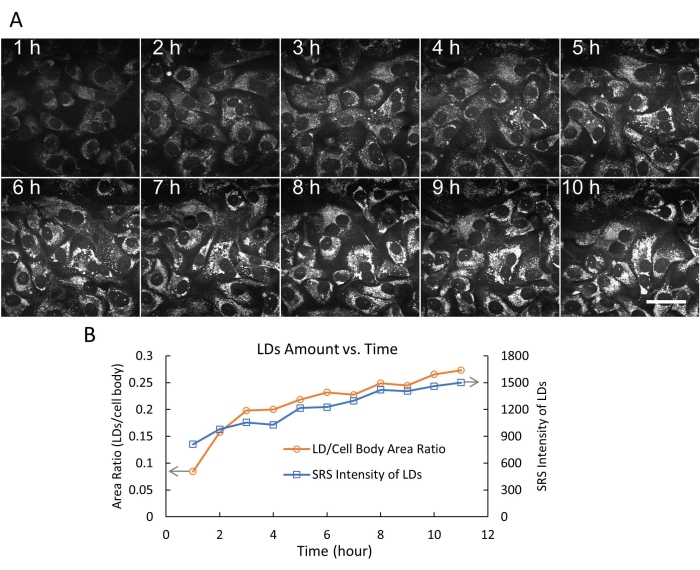
Figure 5: Time-lapse SRS imaging and lipid droplet quantification. (A) Representative 10 frames of time-lapse SRS imaging (at 2,854 cm-1) of live SKOV3 cells treated with 500 µM OA, up to 10 h, using the flexible chamber. In this experiment, 200 frames were recorded with a fixed time interval of 3 min. Scale bar = 50 µm. (B) The amount of LDs versus time (0-10 h) was quantified in two ways (LD/cell body area ratio and total SRS intensity of LDs) using the thresholding function and the particle analysis functions in ImageJ. Abbreviations: SRS = stimulated Raman spectroscopy; OA = oleic acid; LDs= lipid droplets. Please click here to view a larger version of this figure.

Figure 6: Time-lapse, simultaneous SRS and two-photon fluorescence imaging for LDs and lysosomes. Time-lapse, simultaneous SRS (at 2,854 cm-1), and two-photon fluorescence imaging for LDs (pseudo color green) and lysosomes (red), up to 2 h. Cells were treated with a fluorescence dye (LysoSensor DND-189, 1 µM) for 1 h before imaging. Images were taken every 3 min. Scale bar = 50 µm. A low degree of colocalization of LDs and lysosomes were observed, indicated with the yellow color. Abbreviations: SRS = stimulated Raman spectroscopy; LDs= lipid droplets. Please click here to view a larger version of this figure.
Discussion
Time-lapse live-cell SRS microscopy is an alternative imaging technique for molecule tracking in a label-free manner. Compared to fluorescence labeling, SRS imaging is free from photobleaching, enabling long-term monitoring of molecules. However, to date, the live cell imaging system on an upright SRS microscopy is not commercially available. In this work, a live cell imaging system with a stable thermal-insulated microscope enclosure box and a flexible inner soft chamber was developed to enable transmitted SRS time-lapse imaging. In this setup, the large enclosure box maintains temperature stability at 37 °C, while the internal soft chamber supplies humidified air to establish an optimal cell culture environment. The flexible open chamber demonstrated in this work enables a simple workflow for long-term SRS imaging of live cells. Cells seeded in a glass-bottom dish can be first prepared and cultured in a regular incubator before transferring to the flexible on-stage chamber for imaging. An alternative solution to perform live-cell SRS imaging is to use a closed flow cell, including the microfluidic and flow cytometry platforms27,28,29,30. It is feasible to design a flow cell with a lower thickness. However, culturing cells in a perfusion chamber can be technically challenging31.
Focal drift is a common issue in live-cell imaging32. As a multiphoton process, SRS signal generation requires a tightly focusing of the laser beams and, therefore, SRS microscopy is highly sensitive to focal drift. Temperature instability is an essential factor in inducing focal drift. To improve thermal stability, the entire microscope was enclosed with thermal insulating materials. However, in some imaging sessions, we still experienced focal drift after 2-3 h of imaging. SRS microscopic imaging is also sensitive to vibration, which may destroy focusing. An anti-vibration optical table helps reduce vibration to achieve stable imaging. To solve the focal drift problem, in future experiments, autofocus technologies may be adopted33.
The disinfection procedure of the imaging system is critical to avoid contamination of the cells, especially for the water immersion objective, which will directly contact the cell culture media. It should be safe to use 70% ethanol for lens top cleaning. Because UV light can only effectively disinfect the surface of the objects, four UV lamps were mounted at different locations in the enclosure box to perform disinfection in these experiments. However, the UV light may degrade the plastic components in the imaging system. In this case, one may use aluminum foil to wrap and cover the plastic parts. For live-cell imaging, antibiotics (usually 100 units/mL of penicillin and 100 µg/mL of streptomycin in the culture media) are highly recommended.
We imaged and quantified the LDs in live cancer cells in these experiments. For these experiments, a 3 min time interval was reasonable. It is noted that the imaging time interval could be changed depending on the needs of the research project. For example, to track a single LD in a live cell, a less than 1 min time interval may be required. In contrast, a longer time interval of a few minutes is sufficient to track slow biological processes34.
SRS imaging uses higher laser power for excitation than many other optical imaging technologies, which can be challenging for long-term time-lapse SRS imaging of live cells. SRS imaging of the native biomolecules is even more challenging because of the tiny Raman cross-section of the chemical bonds35. In these experiments, a 15 mW pump laser at 805 nm and 7.5 mW Stokes laser at 1,045 nm were used, and no significant photodamage was observed in 24 h with a 3 min time interval. The use of sensitive Raman tags may reduce the laser power further36.
Disclosures
The authors have no conflicts of interest to disclose.
Acknowledgements
We want to thank the 2019 Undergraduate Senior Design Team (Suk Chul Yoon, Ian Foxton, Louis Mazza, and James Walsh) at Binghamton University for the design, fabrication, and testing of the microscope enclosure box. We thank Scott Hancock, Olga Petrova, and Fabiola Moreno Olivas at Binghamton University for helpful discussions. This research was supported by the National Institutes of Health under Award Number R15GM140444.
Materials
| Name | Company | Catalog Number | Comments |
|---|---|---|---|
| A lab-built SRS microscope | https://rdcu.be/cP6ve | ||
| HF2LI 50 MHz lock-in amplifer | Zurich Instruments | HF2LI | |
| Iris diaphragm | Thorlabs Inc | SM1D12 | |
| Kinematic mirror mount | Thorlabs Inc | KM100 | |
| Microscope frame | Nikon Inc | FN-1 | |
| Motorized microscopy stage | Prior Scientific | Z-Deck | |
| Oil-immersion condenser (C-AA Achromat/Aplanat, NA 1.4) | Nikon Inc | MBL71405 | |
| Water-immersion objective (CFI75 Apo 25XC W 1300) | Nikon Inc | MRD77225 | |
| Materials and parts for the microscope enclosure (31'' x 29'' x 28'' L x W x H) | |||
| Airtherm heater module | World Precision Instruments (WPI) | AIRTHERM-SAT-1W | |
| Airtherm heater controller, CO2 and humidity monitor | World Precision Instruments (WPI) | AIRTHERM-SMT-1W | |
| Air/CO2 mixer module | World Precision Instruments (WPI) | ECU-HOC-W | |
| Flexible duct hose (2-1/2'' ID, 2-3/4'' OD) | McMaster-Carr | 56675K71 | |
| High-temperature glass-mica ceramic, easy-to-machine (6'' x 6'', 1/4'' thickness) | McMaster-Carr | 8489K62 | |
| Polycarbonate sheets (thickness 0.25'') | McMaster-Carr | 8574K286 | |
| Silicone rubber sheets (36'' x 36'', thickness 1/8'') | McMaster-Carr | 5827T43 | |
| Materials and parts for the Flexible chamber | |||
| Hot plate | McMaster-Carr | 31745K11 | |
| High-purity inline filter, 1/4 NPT | McMaster-Carr | 6645T18 | |
| Hole saw (cutting diameter 1-7/8 inch) | McMaster-Carr | 4066A34 | |
| Hole saw (cutting diameter 50 mm) | McMaster-Carr | 4556A19 | |
| High-temperature silicone rubber tubing, soft, 2 mm ID, 5 mm OD | McMaster-Carr | 5054K313 | |
| Inline filter (1/4 NPT, 40 micron) | McMaster-Carr | 98385K843 | |
| Multipurpose 6061 Aluminum round tube (1/8'' wall thickness, 4'' OD) | McMaster-Carr | 9056K42 | |
| Multipurpose 6061 Aluminum round tube (3/4'' wall thickness, 3-3/4'' OD) | McMaster-Carr | 9056K47 | |
| Multipurpose 6061 Aluminum bar (12'' x 12'', thickness 1/4'') | McMaster-Carr | 8975K142 | |
| Multipurpose 6061 Aluminum bar (8'' x 8'', thickness 3/8'') | McMaster-Carr | 9246K21 | |
| Objective nosepiece (single) | Nikon Inc | FN-MN-H | |
| Sample holder (modified) | Prior Scientific | HZ202 | |
| Ultra-thin natural rubber film (thickness 0.01'') | McMaster-Carr | 8611K13 | |
| Vacuum-sealable glass jar | McMaster-Carr | 3231T44 | |
| Software | |||
| MATLAB | MathWorks | ||
| ImageJ (Fiji) | imagej.net | ||
| ScanImage | Vidrio Technologies, LLC | SRS imaging software | |
| Materials for live-cell imaging | |||
| Cover glass bottom sterile culture dishes (Dia.x H, 50 x 7 mm) | Electron Microscopy Sciences (EMS) | 70674-02 | |
| DMEM cell culture medium | ThermoFisher Scientific | 11965092 | |
| Fetal bovine serum (FBS) | ThermoFisher Scientific | 26140079 | |
| LysoSensor fluorescent dye DND-189 | ThermoFisher Scientific | L7535 (Invitrogen) | |
| Oleic acid | MilliporeSigma | 364525 | |
| SKOV3 cell line | ATCC | HTB-77 |
References
- Mertz, J. Introduction to Optical Microscopy. , Cambridge University Press. (2019).
- Ettinger, A., Wittmann, T. Fluorescence live cell imaging. Methods in Cell Biology. 123, 77-94 (2014).
- Park, Y., Depeursinge, C., Popescu, G. Quantitative phase imaging in biomedicine. Nature Photonics. 12 (10), 578-589 (2018).
- Hu, C. D., Kerppola, T. K. Simultaneous visualization of multiple protein interactions in living cells using multicolor fluorescence complementation analysis. Nature Biotechnology. 21 (5), 539-545 (2003).
- lamo, P., et al. Fluorescent dye labeling changes the biodistribution of tumor-targeted nanoparticles. Pharmaceutics. 12 (11), 1004(2020).
- Cheng, J. X., Xie, X. S. Vibrational spectroscopic imaging of living systems: An emerging platform for biology and medicine. Science. 350 (6264), aaa870(2015).
- Lu, F. K., et al. Label-free DNA imaging in vivo with stimulated Raman scattering microscopy. Proceedings of the National Academy of Sciences of the United States of America. 112 (37), 11624-11629 (2015).
- Hill, A. H., Fu, D. Cellular imaging using stimulated Raman scattering microscopy. Analytical Chemistry. 91 (15), 9333-9342 (2019).
- Buđa, R., Vukušić, K., Tolić, I. Methods in Cell Biology. (139), Elsevier. 81-101 (2017).
- Chiarelli, T. J., Grieshaber, N. A., Grieshaber, S. S. Live-cell forward genetic approach to identify and isolate developmental mutants in Chlamydia trachomatis. Journal of Visualized Experiments. (160), e61365(2020).
- Lemon, W. C., McDole, K. Live-cell imaging in the era of too many microscopes. Current Opinion in Cell Biology. 66, 34-42 (2020).
- Birk, S. E., et al. Management of oral biofilms by nisin delivery in adhesive microdevices. European Journal of Pharmaceutics and Biopharmaceutics. 167, 83-88 (2021).
- Watanabe, I., Okada, S. Effects of temperature on growth rate of cultured mammalian cells (L5178Y). Journal of Cell Biology. 32 (2), 309-323 (1967).
- Lac, A., Lam, A. L., Heit, B. Fluorescent Microscopy. , Springer. 57-73 (2022).
- Grossman, D. G. Machinable glass-ceramics based on tetrasilicic mica. Journal of the American Ceramic Society. 55 (9), 446-449 (1972).
- Yuan, Y., Shah, N., Almohaisin, M. I., Saha, S., Lu, F. Assessing fatty acid-induced lipotoxicity and its therapeutic potential in glioblastoma using stimulated Raman microscopy. Scientific Reports. 11 (1), 1-14 (2021).
- Pologruto, T. A., Sabatini, B. L., Svoboda, K. ScanImage: flexible software for operating laser scanning microscopes. Biomedical Engineering Online. 2 (1), 1-9 (2003).
- Sun, M. W., Yuan, Y. H., Lu, F. K., Di Pasqua, A. J. Physicochemical factors that influence the biocompatibility of cationic liposomes and their ability to deliver DNA to the nuclei of ovarian cancer SK-OV-3 cells. Materials. 14 (2), 416(2021).
- Schneider, C. A., Rasband, W. S., Eliceiri, K. W. NIH Image to ImageJ: 25 years of image analysis. Nature Methods. 9 (7), 671-675 (2012).
- Ozeki, Y., Itoh, K. Stimulated Raman scattering microscopy for live-cell imaging with high contrast and high sensitivity. Laser Physics. 20 (5), 1114-1118 (2010).
- Zhang, X., et al. Label-free live-cell imaging of nucleic acids using stimulated Raman scattering microscopy. ChemPhysChem. 13 (4), 1054-1059 (2012).
- Stiebing, C., et al. Real-time Raman and SRS imaging of living human macrophages reveals cell-to-cell heterogeneity and dynamics of lipid uptake. Journal of Biophotonics. 10 (9), 1217-1226 (2017).
- Miao, K., Wei, L. Live-cell imaging and quantification of PolyQ aggregates by stimulated Raman scattering of selective deuterium labeling. ACS Central Science. 6 (4), 478-486 (2020).
- Brzozowski, K., et al. Stimulated Raman scattering microscopy in chemistry and life science -Development, innovation, perspectives. Biotechnology Advances. 60, 108003(2022).
- Hislop, E. W., Tipping, W. J., Faulds, K., Graham, D. Label-free imaging of lipid droplets in prostate cells using stimulated Raman scattering microscopy and multivariate analysis. Analytical Chemistry. 94 (25), 8899-8908 (2022).
- Chen, T., Yavuz, A., Wang, M. C. Dissecting lipid droplet biology with coherent Raman scattering microscopy. Journal of Cell Science. 135 (5), jcs252353(2022).
- Cao, C., Zhou, D., Chen, T., Streets, A. M., Huang, Y. Label-Free digital quantification of lipid droplets in single cells by stimulated Raman microscopy on a microfluidic platform. Analytical Chemistry. 88 (9), 4931-4939 (2016).
- Zhang, C., et al. Stimulated Raman scattering flow cytometry for label-free single-particle analysis. Optica. 4 (1), 103-109 (2017).
- Suzuki, Y., et al. Label-free chemical imaging flow cytometry by high-speed multicolor stimulated Raman scattering. Proceedings of the National Academy of Sciences of the United States of America. 116 (32), 15842-15848 (2019).
- Gala de Pablo, J., Lindley, M., Hiramatsu, K., Goda, K. High-throughput Raman flow cytometry and beyond. Accounts of Chemical Research. 54 (9), 2132-2143 (2021).
- Cole, R. Live-cell imaging: the cell's perspective. Cell Adhesion & Migration. 8 (5), 452-459 (2014).
- Kreft, M., Stenovec, M., Zorec, R. Focus-drift correction in time-lapse confocal imaging. Annals of the New York Academy of Sciences. 1048 (1), 321-330 (2005).
- Firestone, L., Cook, K., Culp, K., Talsania, N., Preston Jr, K. Comparison of autofocus methods for automated microscopy. Cytometry: The Journal of the International Society for Analytical Cytology. 12 (3), 195-206 (1991).
- Van Helvert, S., Storm, C., Friedl, P. Mechanoreciprocity in cell migration. Nature Cell Biology. 20 (1), 8-20 (2018).
- Zong, C., et al. Plasmon-enhanced stimulated Raman scattering microscopy with single-molecule detection sensitivity. Nature Communications. 10 (1), 1-11 (2019).
- Wei, L., et al. Super-multiplex vibrational imaging. Nature. 544 (7651), 465-470 (2017).
Reprints and Permissions
