This protocol describes the orthotopic implantation of patient-derived cancer cells in the cecum wall of immunodeficient mice. The model recapitulates advanced colorectal cancer metastatic disease and allows for the evaluation of new therapeutic drugs in a clinically relevant scenario of lung and liver metastases.
Method Article
Orthotopic Implantation of Patient-Derived Cancer Cells in Mice Recapitulates Advanced Colorectal Cancer
In This Article
Summary
Abstract
Over the last decade, more sophisticated preclinical colorectal cancer (CRC) models have been established using patient-derived cancer cells and 3D tumoroids. Since patient derived tumor organoids can retain the characteristics of the original tumor, these reliable preclinical models enable cancer drug screening and the study of drug resistance mechanisms. However, CRC related death in patients is mostly associated with the presence of metastatic disease. It is therefore essential to evaluate the efficacy of anti-cancer therapies in relevant in vivo models that truly recapitulate the key molecular features of human cancer metastasis. We have established an orthotopic model based on the injection of CRC patient-derived cancer cells directly into the cecum wall of mice. These tumor cells develop primary tumors in the cecum that metastasize to the liver and lungs, which is frequently observed in patients with advanced CRC. This CRC mouse model can be used to evaluate drug responses monitored by microcomputed tomography (µCT), a clinically relevant small-scale imaging method that can easily identify primary tumors or metastases in patients. Here, we describe the surgical procedure and the required methodology to implant patient-derived cancer cells in the cecum wall of immunodeficient mice.
Introduction
Colorectal cancer (CRC) is the second leading cause of cancer death worldwide1. The ability to generate in vitro or in vivo tumor models derived from individual patient tumor cells has advanced precision medicine in oncology. Over the last decade, patient derived organoids (PDOs) or xenografts (PDXs) have been used by many research groups around the world2. PDOs are multicellular in vitro structures that resemble the features of the original tumor tissue and can self-organize and self-renew3. These promising in vitro models can successfully be used for drug screening and facilitating translational research. On the other side, PDX models faithfully recapitulate the original CRC at all relevant levels, from histology to molecular traits and drug response2,4.
In vivo PDX models are mostly grown as subcutaneous tumors in immunodeficient mice. Using this approach, PDXs have become the gold standard in cancer research, particularly for studying drug sensitivity or resistance. However, CRC related deaths are mostly associated with the presence of metastatic lesions in the liver, the lung, or the peritoneal cavity, and neither of the two approaches (PDO or PDX) can recapitulate the advanced clinical setting. In addition, the specific site of tumor growth has been shown to determine important biological characteristics that have an impact on drug efficacy and disease prognosis2. Therefore, there is an urgent need to establish preclinical models that can be used to assess the efficacy of anticancer drugs in a clinically relevant metastatic setting6.
Microcomputed tomography (µCT) scanners can function as scaled-down clinical CT scanners, providing primary tumor and metastasis imaging in mice at a scaled image resolution proportional to that of CT images of cancer patients7. To counteract the poor soft tissue contrast of the µCT technique, radiological iodinated contrast agents can be used to improve the contrast and evaluate tumor burden. Using a dual contrast approach, oral and intraperitoneal iodine is administrated at different timings. The contrast administrated orally helps to define the limits between tumor tissue and cecum content inside the bowel. On the other side, the contrast administered intraperitoneally allows for the identification of the external limits of the tumor mass, which frequently grows and invades the peritoneum8.
The manuscript describes a protocol to perform orthotopic implantation of patient-derived cancer cells in the cecum wall of immunodeficient mice, and the methodology to monitor intestinal tumor growth using µCT scanning. The present manuscript shows that the model recapitulates the clinical scenario of advanced intestinal tumors and metastatic disease in CRC patients that cannot be studied using PDO or PDXO models. Since orthotopic PDX models of CRC recapitulate the clinical scenario of CRC patients, we conclude that they are the best to date for testing the efficacy of anti-tumoral drugs in advanced intestinal tumors and metastatic disease.
Protocol
Written informed consent was obtained from all patients. The project was approved by the Research Ethics Committee of the Vall d'Hebron University Hospital, Barcelona, Spain (approval ID: PR(IR)79/2009 PR(AG)114/2014, PR(AG)18/2018). Human colon tissue samples consisted of biopsies from non-necrotic areas of primary adenocarcinomas or liver metastases, corresponding to patients with colon and rectal cancer who underwent tumor resection. Experiments were conducted following the European Union's animal care directive (86/609/EEC) and were approved by the Ethical Committee of Animal Experimentation of the VHIR-the Vall d'Hebron Research Institute (ID: 40/08 CEEA, 47/08/10 CEEA and 12/18 CEEA).
NOTE: Female NOD-SCID (NOD. CB17-Prkdcscid/NcrCrl) mice from 8 weeks-of-age were purchased from Charles River Laboratories.
1. Derivation of patient cells
- Tumor extraction
NOTE: The following procedure is performed in a biological cabinet at room temperature (RT) in the animal facility.- Obtain tumor samples from the patients' surgeries or biopsies and from PDXs growing subcutaneously in mice.
- For the orthotopic injection, prepare the tumor cells from established subcutaneous PDX tumor models instead of tissue obtained directly from patients9.
- Generate PDX tumors by inoculating a suspension of 1 x 10⁵ tumor cells in phosphate buffered saline (PBS) (50 µL) mixed with Matrigel matrix (50 µL) subcutaneously in the flank of NOD-SCID mice2.
- Measure tumor growth using a caliper every other day.
NOTE: Importantly, our laboratory has generated a biobank of more than 350 PDX models. The CRC-PDX tumor models used in the protocol are established PDX models in the lab that have been amplified more than three passages in mice, and passed the inclusion/exclusion criteria with a positive result (Table 1).
- Measure tumor growth using a caliper every other day.
- Euthanize the mice by cervical dislocation when subcutaneous tumors reach the maximum size established by the CEEA (1 cm of diameter), or when the animals reach endpoint criteria.
- Extract the tumor and carefully remove it from the skin and surrounding non-tumor tissue using scissors and forceps.
- Store the harvested tumors in PBS at 4 °C until the next step.
NOTE: Dissociate the tumors in cell suspension as soon as possible after removal from their original location in the patients' lesions or subcutaneous xenografts in mice. Cell viability is significantly reduced 24 h after tissue removal, resulting in an inefficient implantation in recipient mice.
- Cell preparation
NOTE: The following procedure is performed in a biological cabinet at room temperature (RT) in the tissue culture room.- Dissociate the tumors using a blade in a 10 cm culture plate with 1 mL of complete CoCSCM 6Ab medium (Table 2) (to make mincing easier). Place the homogeneous dissociated sample into a 15 mL conical tube.
- Add complete CoCSCM 6Ab medium to a final volume of 5 mL (use no more than 3 mL of dissociated sample in the same tube).
NOTE: Primary CRC resected from patients are naturally contaminated with bacteria and fungus. It is essential to remove pathogens present in the original patient sample using a cocktail of six antibiotics (penicillin, streptomycin, fungizone, kanamycin, gentamycin, and nystatin). Injection of tumor cells contaminated with bacteria in immunodeficient mice may result in animal death. - Incubate with 50 µL of DNase I (0.08 kU/mL) and 50 µL of collagenase (1.5 mg/mL) (digestion medium; Table 2) for 1 h at 37 °C in a cell culture incubator, at a 45° position. Mix the solution well every 15 min with a 5 mL pipette before the incubation.
NOTE: Dissociate the tumor tissue and digest it by pipetting several times to obtain a single cell solution. This is essential for counting the cells before injecting in recipient mice and therefore achieving a homogeneous implantation of tumor cells. - Add 5 mL of complete CoCSCM 6Ab medium and mix well with a 5 mL pipette.
- Sort the solution with a 100 µm cell strainer using a new sterile 50 mL tube.
- Spin the sorted cells at 500 x g for 8 min at RT.
- Aspirate the supernatant.
- Resuspend the pellet in 3 mL of 1x RBC lysis buffer solution.
- Incubate for 10 min at RT.
- Add 3 mL of complete CoCSCM 6Ab medium, pipette the sample, and spin at 500 x g for 10 min at RT. Aspirate the supernatant.
- Resuspend the pellet with 5-10 mL of complete CoCSCM 6Ab medium, and use a cell counter to calculate the total number of cells.
- Spin the cells at 500 x g for 10 min at RT, and resuspend in 10 mL of PBS.
- Resuspend the pellet to obtain a concentration of 20 x 106 cells/mL, and mix well to obtain a homogeneous cell suspension.
- Prepare 29 G syringes (0.5 mL U 100 needle, 0.33 mm [29 G] x 12.7 mm) for cecum injection in the tissue culture (one syringe/mouse). Load 50 µL of the tumor cell suspension (1 x 10⁶ cells/injection) into the syringe and keep it on ice. Ensure that air bubbles are removed from the cell suspension.
NOTE: Eliminating air bubbles when the tumor cells are loaded in the syringe is essential to avoid injection of an excessive volume in the cecum wall, which could result in tissue rupture and sample loss. It is imperative to mix the cell suspension well when loading the syringe to avoid uneven tumor size among mice in the same experiment.
2. Orthotopic injection in cecum
NOTE: The following procedure is performed on a bench in a specific pathogen free (SPF) room at the animal facility. The equipment used is previously cleaned and sterilized. In addition, it is sterilized again in a portable sterilizer between individuals or zones in the animal facility.
- Clean the surgical site by spraying with disinfecting detergent and wiping.
- Depilate the mice abdomen using a mouse hair removal machine.
- Place the mouse in a supine position. Use 2% isoflurane to anesthetize the animal. Confirm the effect of anesthesia by gently pinching the extremity and observing the absence of stimulation.
- Place a 50-100 µL drop of veterinary ointment (3 mg/g Lacryvisc) in the eyes to prevent dryness during anesthesia.
- Disinfect the mouse abdomen by scrubbing with chlorhexidine or povidone-iodine several times in a circular motion.
- Make a 1 cm longitudinal incision over the lower abdomen using surgery scissors. Carefully separate the skin to each site to present the peritoneum that is under the skin.
- Make a 0.5-1 cm incision in the peritoneum membrane, big enough to exteriorize the cecum.
NOTE: Exteriorize the cecum without excessively manipulating the internal organs, which could dramatically increase the lethality of the procedure. - Carefully isolate the cecum from the mouse using a pre-cut, sterile gauze.
- Moisten the cecum with saline solution throughout the whole procedure.
- Immobilize the cecum by carefully taking hold of it with forceps, and introduce the needle superficially into the cecum wall. Avoid capillaries and vessels in the injection site. Remove bubbles from the cell suspension.
- Inject the whole 50µL of tumor cell suspension slowly. It usually takes around 10 s to administer. Avoid perforating the cecum lumen with the needle, as this results in the elimination of the tumor cell suspension from the body through intestinal peristalsis.
NOTE: Injecting the tumor cell suspension in the cecum of the mice is the most challenging step of the entire procedure. A bright light focused on the injection site and a magnifying loupe should be used in this part of the protocol. Introduce the needle parallel to the cecum surface. The cecum is a very fragile tissue; therefore, immobilization of the cecum should be performed using surgical forceps and by applying gentle pressure to avoid tissue rupture resulting in hemorrhage. Successful implantation results in a white bubble (pellet of cells) in the cecum wall. If the bubble cannot be visualized, it may indicate that the cecum has been perforated and the cells have ended in the cecum lumen, resulting in their clearance by the intestinal tract. - After injection, slowly remove the needle from the cecum and apply gentle pressure on the injection site with a cotton-tipped applicator, to avoid tumor cells escaping and reduce slight bleeding.
- Clean the cecum with saline solution to remove any debris.
- Return the cecum back into the abdomen of the animal.
- Close the peritoneum using 5/0 sutures.
- Close the skin of the abdomen using 5/0 sutures.
- Administer post-operative antibiotics (100 mg/kg amoxicillin or 20 mg/kg enrofloxacin) and analgesics (5 mg/mL metacam/meloxicam) by subcutaneous injection. Place the mice on a heating pad and keep them there until they have fully recovered. Then, return them to the cage with other animals.
3. Evaluation of orthotopic tumor growth using µCT scanning
NOTE: The following procedure is performed in the preclinical imaging platform (PIP) from the animal facility.
- Perform all animal procedures following institutional ethical committee regulations.
- Start monitoring the tumor volume by µCT 2 weeks after cell injection, and every week thereafter.
- Freshly dilute the contrast agent iopamiro (300 mg/mL) in saline solution, in a ratio of 3:1 for both doses. Administer 300 mL of iopamiro by oral gavage.
NOTE: Due to the poor soft tissue contrast of the µCT, a contrast agent is recommended to improve the sensitivity of the technique. The protocol includes an oral administration of an iodine-based agent (iopamiro) to delimitate the intraluminal tumor burden, and a secondary intraperitoneal administration of the same agent to define the tumor burden in the visceral face of the intestine. Pilot experiments have been previously performed to determine the exact time that the contrast agent needs to arrive to the cecum of mice before its elimination. In the case of iopamiro, it is around 2 h. - After 2 h, administer an intraperitoneal injection of 300 mL of previously diluted iopamiro. The administration helps to define the tumor limits in the parietal face.
- Anesthetize the animals using 2% isoflurane.
- After confirming that the animal is correctly anesthetized by pinching the foot of the mouse, place the animal in the scanning bed of the µCT. The best position is supine (face up).
- In the control software, start the live mode (fluoroscopy mode) to place the abdominal area into the field of view (FOV) of the scanner. To do that, move the bed forward and backward and laterally until the desired position is achieved. Rotate the X-ray tube and the detector 90°, and move the scanning bed in the y-axis to center the animal completely.
- Use the following parameters for the µCT scan images: 30 mm FOV, 26 s of acquisition time, 90 kV of current voltage, and 200 µA of current amperage, using an FX µCT imaging system.
- Return the animals to their cages for recovery when the scan is finished. Provide thermal support and monitor the animals until they recover from anesthesia before returning to housing.
- The µCT acquisition yields a file 250 Mb in size for each scan. The created data files have a VOX format. In order to make them accessible for any imaging analysis software, convert the files to DICOM format using the database managing software of the µCT. Store the batch of created files in a portable hard disk in order to analyze them using any computer with available imaging software.
NOTE: During image analysis, the cecum is localized as a dilated bowel with a radiodense content (iopamiro), frequently in the left side of the caudal abdomen. In the visceral flexure of the cecum, a wall thickening is observed, compared to the adjacent intestinal regions. The thickening corresponds to tumor growth. - Once the tumor is localized, find the highest diameter in the different views (axial, coronal, and sagittal). Measure these three axes and calculate the tumor volume following the ellipsoid formula: volume = 4/3π x (x-semiaxis x y-semiaxis x z-semiaxis)10.
4. Therapeutic intervention in mice bearing orthotopic tumors
- Monitor the mice bearing orthotopic tumors weekly.
- When a tumor µCT scan signal is detected in most of the mice, perform another µCT scan the following week to confirm the presence of the tumor.
NOTE: The time to start the treatment depends on the PDX model used, and varies from 3-12 weeks after tumor cell inoculation in the cecum. - Randomize the mice in four groups: a vehicle group (n = 10-15 mice), a testing drug group (n = 10-15 mice), a standard of care chemotherapy group (n = 10-15 mice), and a combination treatment group (n = 10-15 mice).
- Treat the mice intraperitoneally with saline (vehicle group), the testing drug (20 mg/kg) (testing drug group), irinotecan (50 mg/kg) (standard of care group), or the testing drug (20 mg/kg) with irinotecan (50 mg/kg) (combination treatment group). Perform the administration once a week until the end of the experiment.
- Monitor the tumor growth weekly by µCT scanning throughout the course of the experiment.
- At the end of the experiment, euthanize the mice by cervical dislocation and collect livers, lungs, and any other possible lesions in other organs.
- Include the tissue samples in cassettes and incubate them in 4% formalin overnight. Use intestine tissue from a mouse without a tumor in the cecum as a control.
- Remove the cassettes from formalin and incubate with 70% ethanol for at least 3 h.
- Embed the cassettes with paraffin, using histopathology facility standard protocols.
- Perform hematoxylin and eosin (H&E) staining from the cecum, liver, and lung, using histopathology facility standard protocols.
Results
Mice orthotopically implanted with patient-derived cancer cells were monitored weekly by µCT scanning. At the end of the experiment, the animals were euthanized. Intestines, ceca (Figure 1A,B), livers, lungs, and any other possible lesion were collected, included in a cassette, and fixed with 4% formalin overnight. Intestine tissue from a mouse without a tumor in the cecum was used as a control (Figure 1C). Finally, cassettes were changed to 70% ethanol for at least 3 h and paraffin embedded. Hematoxylin and eosin (H&E) staining from ceca, livers, and lungs were performed using histopathology facility standard protocols to identify tumor cells (Figure 2, Figure 3, and Figure 4).
In another experiment, mice bearing orthotopic tumors were monitored weekly. When a tumor µCT scan signal was detected in most of the mice (around 2-4 weeks, depending on the PDX model), the animals were randomized in four groups and treated with either the vehicle, the testing drug (20 mg/kg), the standard of care chemotherapy irinotecan (50 mg/kg), or the testing drug with irinotecan. The drugs were administered intraperitoneally once a week until the end of the experiment. Tumor growth was monitored weekly by µCT scanning throughout the course of the experiment. The results indicated that the testing drug induced a reduction of the tumor volume, calculated by the µCT scan images, and that was enhanced in combination with irinotecan treatment (Figure 5 and Figure 6).
Previous studies in our lab have shown that the metastatic potential (carcinomatosis, lung and liver metastasis) of the orthotopic CRC-PDX models depends on the PDX model used (Table 3)2. In the present study, the therapeutic efficacy on metastasis formation was also evaluated. The results indicated that the testing drug, irinotecan, and the combination eradicated the formation of lung and liver metastasis in treated mice (Table 4)11.
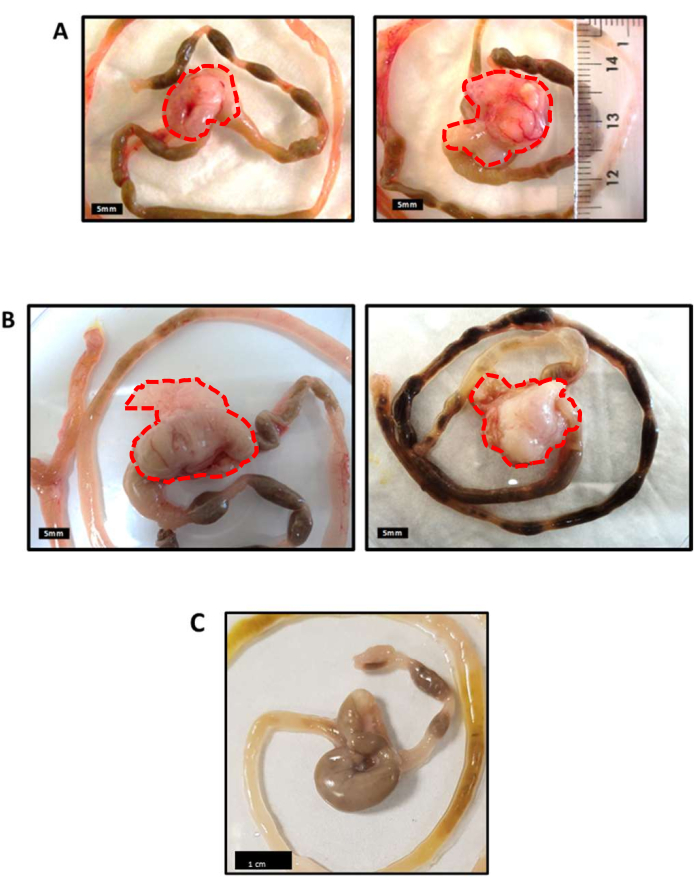
Figure 1: Macroscopic images of the intestine of mice bearing orthotopic CRC-PDX tumors. Macroscopic intestine images from two mice bearing an orthotopic PDX tumor (A,B) at the end of the experiment. Cecum tumors are defined in red in the images. (C) An intestine image of a mouse without a tumor in the cecum as a control. Scale bars = 5 mm (A,B); 1 cm (C). Please click here to view a larger version of this figure.
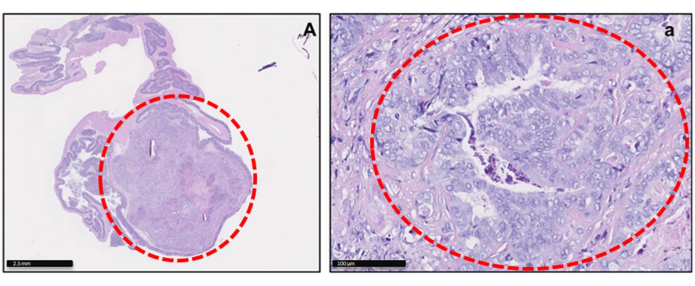
Figure 2: Histological images of orthotopic CRC-PDX tumors. H&E staining of a PDX tumor model in the cecum at the end of the experiment at low (A) and high (a) magnification. Cecum tumors are defined in red in the images. Scale bars = 2.5 mm (A); 100 mm (a). Please click here to view a larger version of this figure.
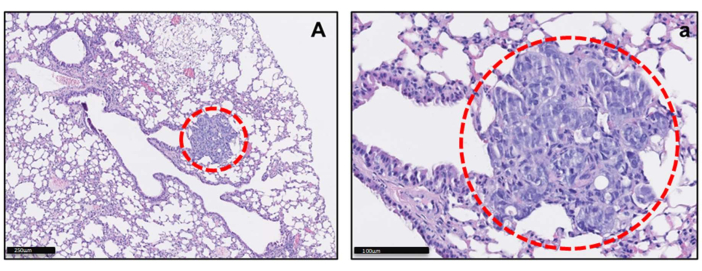
Figure 3: Histological images of lung metastasis derived from orthotopic CRC-PDX tumor H&E staining of a lung from a mouse bearing an orthotopic PDX tumor. Lung metastasis can be observed at low (A) and high (a) magnification. Lung metastases are defined in red in the images. Scale bars = 250 mm (A); 100 mm (a). Please click here to view a larger version of this figure.
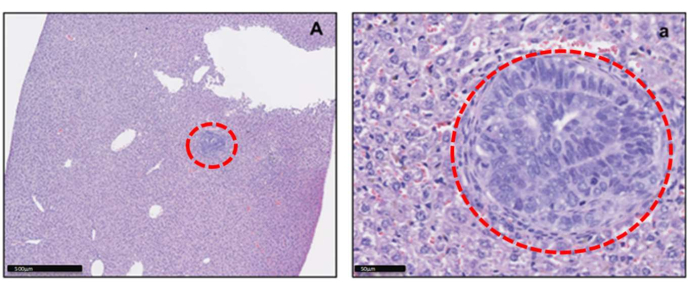
Figure 4: Histological images of liver metastasis derived from orthotopic CRC-PDX tumors. H&E staining of a liver from a mouse bearing an orthotopic PDX tumor. Liver metastasis can be observed at low (A) and high (a) magnification. Liver metastases are defined in red in the images. Scale bars are indicated in the images. Scale bars = 500 mm (A); 50 mm (a). Please click here to view a larger version of this figure.
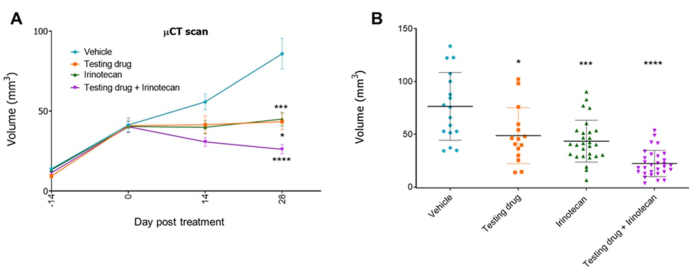
Figure 5: Therapeutic efficacy of a testing drug in an orthotopic CRC-PDX model. Example of an experiment with four groups (vehicle, testing drug, irinotecan, and testing drug with irinotecan)11. Tumor volume obtained from the µCT scan images is represented over time (A) and at the end of the experiment (day 42) (B). Bars, ± SE (n = 15-30) and *p < 0.05, ***p < 0.001, ****p < 0.0001 versus vehicle (t-test, two-sided). Please click here to view a larger version of this figure.
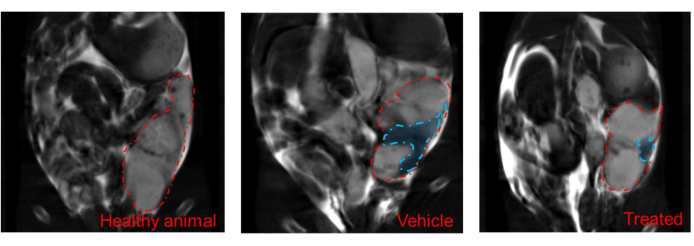
Figure 6: µCT images from mice bearing orthotopic CRC-PDX tumors under treatment. Representative µCT images of mice bearing orthotopic tumors treated with a therapeutic drug. The cecum (red) and tumor mass (blue) are defined in the images. Please click here to view a larger version of this figure.
Table 1: Establishment of the subcutaneous PDX. Example of three PDX models established in the lab (P1, P2, and P3) from our biobank2 of more than 350 PDX models with the number of cells inoculated, the incidence of PDX establishment, and the passages in mice. Please click here to download this Table.
Table 2: Reagents to prepare the growth factors (GF) MIX 10X, the CoCSCM 6Ab without EGF, FGF2, and growth factors, the CoCSCM 6Ab complete medium, and the digestion medium. Please click here to download this Table.
Table 3: Metastatic potential of orthotopic CRC-PDX models. Example of three orthotopic CRC-PDX models established in the lab (P1, P2, and P3) from our biobank2. Here, the number of cells inoculated, the incidence of cecum tumor formation, and the incidence to generate carcinomatosis, lung metastasis, or liver metastasis are indicated. Please click here to download this Table.
Table 4: Therapeutic metastatic efficacy of a testing drug in an orthotopic CRC-PDX model. Example of an experiment with four groups (vehicle, testing drug, irinotecan, and testing drug with irinotecan)11. Here, the number of mice in each group and which of them developed carcinomatosis, lung metastasis, or liver metastasis at the end of the experiment are indicated. Please click here to download this Table.
Discussion
Over the last few decades, many new anti-cancer therapies have been developed and tested in patients with different tumor types, including colorectal cancer (CRC). Although promising results in preclinical models have been observed in many cases, the therapeutic efficacy in patients with advanced metastatic CRC has been frequently limited. Therefore, there is an urgent need for preclinical models that allow for testing the efficacy of new therapeutic drugs in a clinically relevant metastatic scenario.
The manuscript describes in detail an advanced CRC orthotopic PDX model based on the implantation of patient tumor cells in the cecum wall of immunodeficient mice12.
The methodology is time consuming and concentration demanding. On average, the injection of an experiment with 30 mice may take around 11 h in total, including: 1) PDX tumor collection (1 h); tumor processing (4 h); and cecum implantation (6 h). The procedure must be performed in sterile conditions, minimizing the time for tumor processing and injection, while manipulating internal organs very carefully to avoid surgery-related mortality. It is therefore highly recommended that several pilot experiments are performed with tumor cell lines or PDX cells, to train the investigators and familiarize them with the procedure. In addition, two researchers must be involved in the procedure, one to collect and process the tumor, as well as help with the sutures of the animals, and the other to perform the actual surgery.
It is also important to consider that cecum tumors can grow into the lumen of the intestine or inside the cecum, depending on the PDX model and specific site of the injection. The outcome of the tumor growth is difficult to control and can dramatically affect the survival of the mice, resulting in smaller tumors and a severe intestinal obstruction when the tumors grow inside the lumen. The mice must therefore be monitored weekly, starting from the week after cell implantation. Once most of the mice present a tumor signal by the µCT scan, animals without signal should be excluded, and the rest randomized into experimental groups based on tumor volume. To obtain statistically significant results, each experimental group should include 12-15 mice.
Monitoring tumor bearing mice is essential to determine the efficacy of new therapeutic agents in clinically relevant orthotopic models. µCT scans enable the identification and quantification of primary tumor volume in mice. The use of a double contrast significantly increase the sensibility of the µCT technique, improving the quality of the images8. The growth of tumor cells in the cecum can lead to intraluminal tumors if they grow toward the lumen of the intestine, or extraluminal tumors if they grow out of the lumen of the intestine. Both scenarios have been observed with the previous methodology, and depend on the PDX model used and injection site.The mice recovered completely from the scanning, with no clinical evidence of renal damage or other incidences. The results show that µCT imaging can be a useful tool for monitoring the development and longitudinal growth of CRC.
Orthotopic models accurately recapitulate clinical CRC12 and are very useful to test the effect of new therapeutic drugs on primary tumor growth and liver and lung metastases2,11. However, a detailed written protocol may not suffice for a new research group to establish such complex models. In response, the present video aims to guide research groups to implement this procedure in their research. It shows the implantation procedure of cells in the cecum wall of immunodeficient mice and the methodology to monitor intestinal tumor growth using µCT scanning.
Acknowledgements
We acknowledge the Cellex Foundation, CIBERONC network, and Instituto de Salud Carlos III for their support. Moreover, we also thank the preclinical imaging platform at the Vall d'Hebron Research Institute (VHIR), where the experiments were performed.
Materials
| Name | Company | Catalog Number | Comments |
|---|---|---|---|
| REAGENT | |||
| Apo-Transferrin | MERCK LIFE SCIENCE S.L.U. | T1147-500MG | |
| B27 Supplement | Life Technologies S.A (Spain) | 17504044 | |
| Chlorhexidine Aqueous Solution 2% | DH MATERIAL MÉDICO, S.L. | 1111696250 | |
| Collagenase | MERCK LIFE SCIENCE S.L.U. | C0130-500MG | |
| D-(+)-Glucose | MERCK LIFE SCIENCE S.L.U. | G6152 | |
| DMEM /F12 | LIFE TECHNOLOGIES S.A. | 21331-020 | |
| DNase I | MERCK LIFE SCIENCE S.L.U. | D4263-5VL | |
| EGF | PEPRO TECH EC LTD. | AF-100-15-500 µg | |
| FGF basic | PEPRO TECH EC LTD. | 100-18B | |
| Fungizone | Life Technologies S.A (Spain) | 15290026 | |
| Gentamycin | LIFE TECHNOLOGIES S.A. | 15750037 | |
| Heparin Sodium Salt | MERCK LIFE SCIENCE S.L.U. | H4784-250MG | |
| Insulin | MERCK LIFE SCIENCE S.L.U. | I9278-5ML | |
| Iopamiro | |||
| Isoflurane | - | - | |
| Kanamycin | LIFE TECHNOLOGIES S.A. | 15160047 | |
| L-Glutamine | LIFE TECHNOLOGIES S.A. | 25030032 | |
| Matrigel Matrix | CULTEK, S.L.U. | 356235/356234/354234 | |
| Metacam, 5 mg/mL | - | - | |
| Non-essential amino acids | LIFE TECHNOLOGIES S.A. | 11140035 | |
| Nystatin | MERCK LIFE SCIENCE S.L.U. | N4014-50MG | |
| Pen/Strep | Life Technologies S.A (Spain) | 15140122 | |
| Phosphate-buffered saline (PBS), sterile | Labclinics S.A | L0615-500 | |
| Progesterone | MERCK LIFE SCIENCE S.L.U. | P0130-25G | |
| Putrescine | MERCK LIFE SCIENCE S.L.U. | P5780-5G | |
| RBC Lysis Buffer | Labclinics S.A | 00-4333-57 | |
| Sodium Pyruvate | LIFE TECHNOLOGIES S.A. | 11360039 | |
| Sodium Selenite | MERCK LIFE SCIENCE S.L.U. | S5261-25G | |
| ESSENTIAL SUPPLIES | |||
| 8 weeks-old NOD.CB17-Prkdcscid/NcrCrl mice | - | - | |
| BD Micro-Fine 0.5 ml U 100 needle 0.33 mm (29G) x 12.7 mm | BECTON DICKINSON, S.A.U. | 320926 | |
| Blade #24 | - | - | |
| Cell Strainer 100 µm | Cultek, SLU | 45352360 | |
| Forceps and Surgical scissors | - | - | |
| Heating pad | - | - | |
| Lacryvisc, 3 mg/g, ophthalmic gel | - | - | |
| Surfasafe | - | - | |
| Suture PROLENE 5-0 | JOHNSON&JOHNSON S, A. | 8720H | |
| EQUIPMENT/SOFTWARE | |||
| Quantum FX µCT Imaging system | Perkin Elmer | Perkin Elmer | http://www.perkinelmer.com/es/product/quantum-gx-instrument-120-240-cls140083 |
References
- Sung, H., et al. Global Cancer Statistics 2020: GLOBOCAN estimates of incidence and mortality worldwide for 36 cancers in 185 countries. CA: a Cancer Journal for Clinicians. 71 (3), 209-249 (2021).
- Puig, I., et al. A personalized preclinical model to evaluate the metastatic potential of patient-derived colon cancer initiating cells. Clinical Cancer Research. 19 (24), 6787-6801 (2013).
- Clevers, H. Modeling development and disease with organoids. Cell. 165 (7), 1586-1597 (2016).
- Byrne, A. T., et al. Interrogating open issues in cancer precision medicine with patient-derived xenografts. Nature Reviews. Cancer. 17 (4), 254-268 (2017).
- Vatandoust, S., Price, T. J., Karapetis, C. S. Colorectal cancer: Metastases to a single organ. World Journal of Gastroenterology. 21 (41), 11767-11776 (2015).
- Cespedes, M. V., et al. Orthotopic microinjection of human colon cancer cells in nude mice induces tumor foci in all clinically relevant metastatic sites. The American Journal of Pathology. 170 (3), 1077-1085 (2007).
- Durkee, B. Y., Weichert, J. P., Halberg, R. B. Small animal micro-CT colonography. Methods. 50 (1), 36-41 (2010).
- Boll, H., et al. Double-contrast micro-CT colonoscopy in live mice. International Journal of Colorectal Disease. 26 (6), 721-727 (2011).
- O'Brien, C. A., Pollett, A., Gallinger, S., Dick, J. E. A human colon cancer cell capable of initiating tumour growth in immunodeficient mice. Nature. 445 (7123), 106-110 (2007).
- Jensen, M. M., Jorgensen, J. T., Binderup, T., Kjaer, A. Tumor volume in subcutaneous mouse xenografts measured by microCT is more accurate and reproducible than determined by 18F-FDG-microPET or external caliper. BMC Medical Imaging. 8, 16(2008).
- Herpers, B., et al. Functional patient-derived organoid screenings identify MCLA-158 as a therapeutic EGFR x LGR5 bispecific antibody with efficacy in epithelial tumors. Nature Cancer. 3 (4), 418-436 (2022).
- Chicote, I., Camara, J. A., Palmer, H. G. Advanced colorectal cancer orthotopic patient-derived xenograft models for cancer and stem cell research. Methods in Molecular Biology. 2171, 321-329 (2020).
Reprints and Permissions
