As an analytical technique, nanoimpact electrochemistry, an increasingly important approach to counting and characterizing nanometer-scale, electro-inactive particles, suffers from poor precision due to the heterogeneous current distributions that arise from its use of ultramicroelectrodes. Outlined here is a generalized approach, termed "electrocatalytic interruption," that enhances precision in such measurements.
Method Article
Precise Electrochemical Sizing of Individual Electro-Inactive Particles
In This Article
Summary
Abstract
Nanoimpact electrochemistry enables the time-resolved in situ characterization (e.g., size, catalytic activity) of single nanomaterial units, providing a means of elucidating heterogeneities that would be masked in ensemble studies. To implement this technique with redox inactive particles, a solution-phase redox reaction is used to produce a steady-state background current on a disk ultramicroelectrode. When a particle adsorbs onto the electrode, it produces a stepwise reduction in the exposed electrode area, which produces, in turn, a stepwise decrease in the current commensurate with the size of the adsorbing species. Historically, however, nanoimpact electrochemistry has suffered from "edge effects," in which the radial diffusion layer formed at the circumference of the ultramicroelectrodes renders the step size dependent not only on the size of the particle but also on where it lands on the electrode. The introduction of electrocatalytic current generation, however, mitigates the heterogeneity caused by edge effects, thus improving the measurement precision. In this approach, termed "electrocatalytic interruption," a substrate that regenerates the redox probe at the diffusion layer is introduced. This shifts the rate-limiting step of the current generation from diffusion to the homogeneous reaction rate constant, thus reducing flux heterogeneity and increasing the precision of particle sizing by an order of magnitude. The protocol described here explains the set-up and data collection employed in nanoimpact experiments implementing this effect for improved precision in the sizing of redox in-active materials.
Introduction
Nanoimpact electrochemistry is an electrochemical technique that enables the time-resolved detection of individual particles in situ in a sample1,2,3,4,5,6,7. The individual particles that can be characterized by this approach span a wide range of materials6,8,9,10,11,12,13 and encompass dimensions from individual atoms to whole cells7,8,14,15,16. To accommodate the detection and characterization of such small materials, the technique utilizes micron- and submicron-scale disk ultramicroelectrodes. The impact of an electroactive nanoparticle on such an electrode produces an easily quantifiable current change as the nanoparticle undergoes a redox reaction. To expand this to the detection of electro-inactive materials, a background electrochemical reaction is used to produce a steady-state current that is reduced in a step-wise fashion as the adsorption of the nanoparticles changes the surface area of the electrode17. In this scheme, ultramicroelectrodes are employed to increase the relative change produced by each nanoimpact. The radial diffusion layer that such microelectrodes produce, however, reduces the measurement precision due to "edge effects"18. These occur because the flux of the redox species to the electrode is greater at the edges of the electrode than at its center19. Thus, when a single nanoparticle lands at the edge of the electrode surface, the resulting current event is larger than that seen for an identical particle landing at the center of the electrode19, and this effect is more significant for ultramicroelectrodes due to their small area-to-circumference ratio. These edge effects detract significantly from the precision of nanoimpact electrochemistry; due to their presence, the estimated particle size distributions produced by nanoimpact sizing are 20 times wider than those obtained using "gold standard" microscopy techniques20. This reduced precision detracts from the use of nanoimpact electrochemistry as an analytical technique for evaluating the heterogeneity of redox inactive materials at the nanoscale4,17,19,21,22,23,24,25,26.
We have recently introduced a method (Figure 1) that mitigates edge effects in nanoimpact approaches20. In this method, the introduction of a substrate regenerates the redox species near the ultramicroelectrode surface. This shifts the rate-limiting step in current generation from diffusion to the rate of the homogeneous chemical reaction of the redox species in solution27,28, thus reducing the extent to which the radial diffusion field contributes to heterogeneous currents. Specifically, the oxidization of 2,2,6,6-tetramethylpiperidine 1-oxyl (TEMPO) provides the background redox reaction at the ultramicroelectrode29. The addition of maltose to this regenerates the reduced form of TEMPO30,31. This regeneration is rapid32, and it compresses the diffusion layer and reduces the current heterogeneity associated with spatial landing20. As a result, the "electrocatalytic interruption" approach improves the precision of nanoimpact particle sizing by an order of magnitude.
Protocol
1. Establishing a low-noise system
NOTE: The relevant experiments require a potentiostat capable of achieving the highly time-resolved measurement of low currents. To achieve this, employ a research-grade commercial potentiostat capable of a 1 µs time resolution that can quantify currents at the femtoampere level. To further reduce electronic interference from the environment, conduct experiments within two nesting Faraday cages. Ensure that the setup is capable of a root-mean-square deviation of less than 100 fA for a chronoamperometry experiment sampled at 10 Hz in 0.1 M potassium chloride.
- Obtain and set up the equipment, including the potentiostat and Faraday cages.
NOTE: Faraday cages may be obtained commercially or custom-fabricated using conductive metals (e.g., copper or aluminum). Custom-fabricated aluminum Faraday cages were used for the study described here (see Table of Materials).
2. Experimental preparation
- Use commercially available 2 µm diameter carboxylate-modified polystyrene beads (see Table of Materials).
NOTE: While this system can be generalized to other electro-inactive species23,33, it is critical to remember that the impacts rely on electrophoretic migration in addition to Brownian motion. Thus, apply a potential attractive to the species of interest, and maintain low salt concentrations17. - Prepare the following solutions, which can be stored at room temperature for at least 1 month.
- Prepare a 50 mM carbonate solution, and titrate to pH 12.0 using 1 M NaOH. Monitor the pH weekly.
- Prepare a 1 M sodium perchlorate solution.
- Prepare the following solutions fresh each day, discarding them at the end of the day.
- Prepare a 10 mM TEMPO in 50 mM carbonate solution, pH 12.0.
- Prepare a 500 mM maltose stock in 50 mM carbonate solution, pH 12.0.
- Select the working electrode. For consistent results, select an ultramicroelectrode (see Table of Materials) such that the radius of the species to be characterized is no less than 10%-15% of the electrode radius17,21,23,33,34.
NOTE: This ratio can be minimized after determining the magnitude of the impact-associated current steps for the optimal detection of a particular species of interest. The electrode material selected must catalyze the background redox reaction. - Prepare two electrochemical cells of 5 mL each.
- Prepare a control cell containing 1 mM TEMPO and 5 mM sodium perchlorate (see Table of Materials) in carbonate buffer at pH 12.0.
- Prepare a test cell containing a solution of 1 mM TEMPO, 5 mM sodium perchlorate, and 120 mM maltose in carbonate buffer at pH 12.0.
NOTE: The ratio of the redox mediator to the substrate (here, TEMPO to maltose) can be varied to explore the effects of the reaction rate20. This value provides insight into the homogeneous chemical reaction. - After preparing these cells, set them aside for later electrochemical measurements.
3. Electrode polishing
- Prior to each experimental run, polish the electrode sequentially for 2 min each with a 1 µm, 0.3 µm, and 0.5 µm alumina slurry (see Table of Materials) on polishing pads.
- Move the electrode in a "figure 8" pattern to ensure an even polish35,36. Liberally rinse with deionized water, and dry with a laboratory wipe.
NOTE: Do not sonicate the ultramicroelectrodes, as this may damage them.
4. Electrochemical measurements
NOTE: See Figure 2 for the results.
- Utilize a three-electrode setup for the electrochemical measurements. For the experiments described here, employ an 11 µm carbon-fiber ultramicroelectrode, a platinum wire counter electrode, and a saturated calomel reference electrode (SCE) (see Table of Materials).
NOTE: Electrochemical potential windows for the experiments are noted below; for reference, TEMPO has a formal potential of 0.49 V versus SCE, and maltose is not electroactive in the potential window used in these experiments. Any leaking from the reference electrode may affect the total salt concentration37, thus reducing the electrophoretic driving of the particles to the ultramicroelectrode and reducing the counting efficiency17. If the experiments yield a low impact frequency, consider switching to a leakless reference electrode38,39. - Set the control cell in the Faraday cages, and connect the electrodes to the appropriate cables. Collect the first set of electrochemical measurements for each cell. This will consist of a cyclic voltammetry experiment and a chronoamperometry experiment, as detailed below.
- Collect the cyclic voltammetry data using a potential window from 0.2 V to 0.8 V versus SCE at scan rates of 10 mV·s−1, 20 mV·s−1, 30 mV·s−1, 40 mV·s−1, and 50 mV·s−1.
- Collect the chronoamperometry data by applying 0.8 V versus SCE for 10 min, and record at a 10 Hz sampling rate.
NOTE: A 10 min sampling period is recommended for chronoamperometry experiments to obtain 10-15 individual impacts at later steps. No impacts are expected at this juncture.
- Next, spike a dilute solution of polystyrene beads to a final concentration of 0.66 pM17 into each of the electrochemical cells. After the addition of the polystyrene beads, collect the second set of electrochemical measurements for each cell.
NOTE: The impact frequency will be a function of this concentration and requires optimization to collect sufficient data for statistical analysis without saturating the chronoamperogram with overlapping impacts40,41,42,43.- Collect chronoamperometry data by applying 0.8 V versus SCE for 10 min, and record at a 10 Hz sampling rate.
- Repeat the chronoamperometric measurements until sufficient data points have been collected for statistical analysis. To detect differences between the multiple sizing methods with a confidence level of 95% and a power of 80%, select a sample size of approximately 200 individual impact events.
5. Scanning electron microscopy (SEM)
NOTE: Use scanning electron microscopy as a "gold standard" technique to confirm the nanoparticle sizes and sample heterogeneity19,44.
- Sample preparation
- To prepare a sample for imaging, dilute a carboxyl latex bead suspension (see Table of Materials) 1:20 in water. Drop-cast 10 µL onto a glass slide, dry under a nitrogen stream, and sputter-coat the sample with a conductive layer of gold-palladium under argon.
- Imaging
- Using an accelerating beam voltage of 5 kV and a current of 0.4 nA, collect images as appropriate for statistical analysis. Use ImageJ45,46 or an equivalent image analysis software to determine the particle sizes.
6. Electrochemical data analysis
- Record the electrochemical data using the potentiostat's software, and analyze these results using a written script20 that can extract the current magnitudes from the detected changes in the steady-state current (current steps) resulting from nanoimpact events20.
NOTE: This script is included as part of the supplemental information in our previously published report20. - Convert the amplitudes of the current steps to bead radii using the following equation:
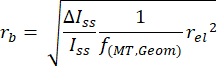
NOTE: Here, rb is the bead radius, rel is the electrode radius, ΔIss/Iss is the ratio between the change in the current produced by a particle's adsorption and the initial steady-state current observed prior to the adsorption of that particle, and f(MT,Geom) = 0.067 is an empirical scaling factor that depends on both geometric and mass transport considerations20,25. - Plot the frequency of detecting a given bead radius versus the radius (Figure 3) to quantify the distribution metrics.
7. Modeling
NOTE: If desired, the mechanism by which electrocatalytic interruption works can be validated by confirming the shift from the diffusion-limited current generation to the reaction rate-limited current generation. To describe and visualize, use two different numerical simulation programs: a voltammogram fitting software, such as DigiSim, to determine the homogeneous rate constant, and a multiphysics modeling platform, such as COMSOL Multiphysics, to visualize the local changes to the diffusion profile at the ultramicroelectrode surface (see Table of Materials).
- Voltammogram fitting
NOTE: Use the voltammogram fitting software to determine the homogeneous rate constant (Figure 4).- Collect cyclic voltammograms in a solution containing 1 mM TEMPO (only) and 1 mM TEMPO plus 120 mM maltose. For each condition, collect data at various scan rates, and use this data for numerical fittings of these experimental datasets.
- Fit the voltammograms collected from the TEMPO-only experiment using an E mechanism, which describes a reaction process driven solely by the electrode47,48. This will yield the electrode parameters.
- Using the electrode parameters obtained from step 7.1.1.1, fit the resulting voltammograms from the 1 mM TEMPO plus 120 maltose solution to an EC′ mechanism47,48, which describes an electrode process that is followed by a homogeneous chemical reaction that regenerates the redox mediator. This will yield the homogeneous rate constant.
- Collect cyclic voltammograms in a solution containing 1 mM TEMPO (only) and 1 mM TEMPO plus 120 mM maltose. For each condition, collect data at various scan rates, and use this data for numerical fittings of these experimental datasets.
- Multiphysics modeling
- Use a multiphysics modeling platform to visualize the changes in the diffusion profiles at the ultramicroelectrode surface for both the control and electrocatalytic interruption systems20,49,50,51,52 (Figure 5). Use the electrode parameters and homogeneous rate constant obtained from the voltammogram fitting as initial conditions. A broad overview of the workflow, which can be adapted to different software, is provided below.
- Input the global parameters. These consist of fixed values such as (but not limited to) the concentration values, diffusion coefficients, electrode radius, and temperature.
- Build the simulation space. This is a set of geometries that include the electrode, the insulating sheath, the surrounding solution space representing the region of interest, and an infinite element domain representing the bulk surroundings.
- Introduce physics packages to define the simulation.
- Associate the electrode space with an electroanalysis study. Define the initial values and electrode reaction of interest here.
- Associate the surrounding solution space with a chemistry study. Define the homogeneous chemical reaction that follows the electrode reaction here.
- Introduce a mesh over the entire simulation space. This defines how the geometry is divided to solve the model. To achieve high-quality results, use a finer mesh near the electrode.
- To observe changes as a result of the homogeneous rate constant, vary the value of this parameter using a parametric study to solve the model.
- To observe changes as a function of time, vary the value of this parameter using a time-dependent study to solve the model.
Results
Electrocatalytic interruption mitigates edge effects by shifting the primary current generation mechanism from diffusion-limited (i.e., limited by the transport of a redox probe to the electrode) to kinetically limited (i.e., limited by a rapid, solution-phase reaction)20. This method is modular, meaning it allows a mix-and-match approach to choosing the electrode material, redox probe, and substrate, and this renders electrocatalytic interruption amenable to the detection of many nano- and bio-materials6,7,8,9,10,11,12,13,14,15,22. Implementing this technique on a 5.5 µm radius carbon-fiber electrode produced a 10-fold improvement in the precision associated with the electrochemical sizing of a model system (polystyrene beads) in a solution containing TEMPO as a redox probe and maltose as a substrate.
Following this protocol, the data sets required to validate this mechanism and its ability to restore analytical precision when sizing electro-inactive nanoparticles can be obtained. First, the cyclic voltammogram data collected in the absence of polystyrene beads showed a reversible redox event in control experiments involving TEMPO alone. From here, the addition of maltose resulted in an increase in the oxidative peak and a concurrent loss in the reductive peak as the oxidized TEMPO was regenerated by maltose. Second, the chronoamperograms collected under these conditions demonstrated that the steady-state currents at an oxidative potential were higher, consistent with the catalytic amplification observed in the cyclic voltammetry results. This step also suggests that the bulk chemical reaction is maintained by the electrode reaction; thus, any improvements over the control method will last over the measurement duration. However, this alone is insufficient for assessing any improvements to the measurement precision; to do so, chronoamperometry data must be collected in the presence of polystyrene beads.
To assess the sizing precision, chronoamperogram data were collected using 2 µm carboxylated polystyrene beads. Upon their addition, step-wise changes in the chronoamperogram current were observed as individual particles impacted and absorbed (Figure 2A control, Figure 2B electrocatalytic interruption). Each step-wise change in the steady-state current magnitude was converted to particle radii, and the data were visualized as histograms to compare the distribution from these electrochemical techniques to that of a gold standard technique, such as scanning electron microscopy (Figure 3). This comparison then allowed the characterization of precision metrics associated with each sizing approach.
Modeling was utilized to support these experimental observations. Specifically, fitting the cyclic voltammograms from before yielded parameters that characterized both the electrode reaction and the solution-phase chemical reaction (Figure 4). From the control solution, some sample parameters obtained were Efθ = 0.49 V, k0 = 0.02 cm·s-1, and ν = 10 mV·s-1 at T = 25° C. From the test solution, the kinetic parameters that limited current generation could be obtained; specifically, as Keq approaches infinity, kobs = 2,200 M-1·s-1. The numerical simulations could then use these values as the initial conditions for generating a concentration profile of the redox probe (Figure 5). In the absence of maltose, the resultant diffusion profile was radial, leading to heterogeneous material flux; specifically, more material diffused to the electrode at the edges. The introduction of maltose compressed the diffusion profile, producing, in turn, more homogeneous currents across the electrode surface.

Figure 1: Schematic of the experimental protocol. Polish the electrodes prior to each experimental run. Collect a baseline set of electrochemical measurements (cyclic voltammetry and chronoamperometry) in the absence of beads with and without implementing electrocatalytic interruption to observe the current enhancement with the addition of the substrate. Spike in the beads, and collect a second set of electrochemical measurements for the size determination of the impacting nanoparticles. Validate the mechanism of action using numerical simulations. Please click here to view a larger version of this figure.
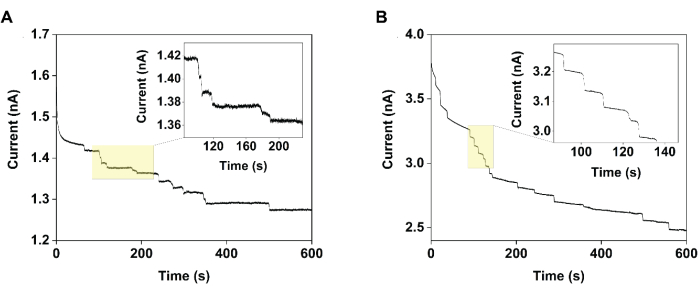
Figure 2: Chronoamperograms collected using an 11 µm diameter carbon-fiber ultramicroelectrode demonstrating the improvement in measurement precision achieved using electrocatalytic interruption. Specifically, when measuring the current versus time in a solution of 1 mM TEMPO in the (A) absence (control) and (B) presence of 120 mM maltose (electrocatalytic interruption), the steps observed in the latter case were more homogeneous. Reprinted with permission from Chung et al.20. Please click here to view a larger version of this figure.
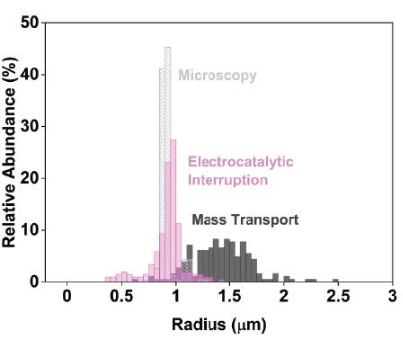
Figure 3: Precise electrochemical sizing data when using electrocatalytic interruption compared to the conventional, diffusion-limited electrochemical approach. To represent this data, prepare histograms comparing the size distributions determined using scanning electron microscopy (light grey) and electrochemistry (electrocatalytic interruption, pink; control, dark grey). Conventional nanoimpact studies, in which the current is limited by the mass transport of the mediator, produce artificially broad estimated size distributions (dark grey). In contrast, implementing electrocatalytic interruption leads to narrower, more precise size estimations (pink). Reprinted with permission from Chung et al.20. Please click here to view a larger version of this figure.

Figure 4: Modeling the electrode kinetics to characterize the new reaction scheme. Using cyclic voltammogram fitting software, extract the electrode reaction parameters from the experimental data. (A) Data with 1 mM TEMPO. (B) Data with 1 mM TEMPO plus 120 mM maltose. Reprinted with permission from Chung et al.20. Please click here to view a larger version of this figure.

Figure 5: Changes in material flux at the electrode surface upon introducing electrocatalytic interruption visualized by numerical simulations. (A) The addition of maltose compresses the diffusion layer in a concentration-dependent manner. (B) The addition of maltose depresses the heterogeneous flux at the electrode edges. Reprinted with permission from Chung et al.20. Please click here to view a larger version of this figure.
Discussion
Electrocatalytic interruption is easy to implement and reduces the imprecision associated with nanoimpact electrochemistry by an order of magnitude. This enhanced precision directly enables researchers to discriminate between differently sized particles in a mixed solution20. It also enhances the ability to reliably detect redox-inactive particles smaller than the historically reported limit of 15%-20% of the radius of the electrode17,21,23,34.
While electrochemical interruption can accommodate various redox systems for the detection of nanoparticles of various electro-inactive materials, identifying such redox systems has remained a major challenge. The main barrier to implementing electrochemical interruption is identifying a chemical reaction that is rapid enough to significantly reduce the confounding contributions of edge effects. Specifically, while some examples of EC′ reactions, wherein an electrode reaction is followed by a chemical reaction that regenerates the electrode reactant, are well characterized in the literature29,32,53,54,55, few are sufficiently fast to improve the measurement precision. In this study, from those reactions that are sufficiently fast, a TEMPO-maltose system was chosen, and this yielded an observed rate constant of 2,200 M-1·s-1. This, in conjunction with multiphysics simulations that demonstrate that faster reaction rates lead to more homogeneous flux at the electrode edge, supports the conclusion that only fast chemical reactions yield several-fold current enhancements at ultramicroelectrodes.
Catalytic interruption does not require data manipulation or modifications to commercially available ultramicroelectrodes. To explain the heterogeneous current magnitudes characteristic of nanoimpact data, Bonezzi and Boika introduced a theoretical model that relates the current step magnitude to particle size25. This analysis, however, heavily relies on averaging the current magnitudes as a function of the collisional frequency. Not only does this preclude insight into the properties of individual particles, but this technique also remains reliant on the flux of the redox reporter to the electrode and does not remove the problem of edge effects, thus resulting in reduced precision. Deng et al. introduced the first experimental approach to addressing edge effects, utilizing a hemispherical ultramicroelectrode fabricated from mercury51. Mercury droplet electrodes, however, are toxic, mechanically unstable, and stable over only a limited potential window56. Furthermore, fabricating (and maintaining) perfectly hemispherical microelectrodes using other materials remains challenging51,52. More recently, Moazzenzade et al. proposed ring ultramicroelectrodes for nanoimpact characterization52. This geometry is promising but requires nanofabrication capabilities. In contrast, catalytic interruption enables nanoimpact experiments with materials universally found in an electrochemistry laboratory.
Disclosures
The authors have nothing to disclose.
Acknowledgements
This work was funded by the National Institutes of Health (NIH) grant R35GM142920. The research reported here made use of shared facilities of the UCSB MRSEC (NSF DMR 1720256), a member of the Materials Research Facilities Network (www.mrfn.org). We thank Phoebe Hertler for contributing to the original article this work references. We thank Dr. Claire Chisholm for assisting in the acquisition of the scanning electron microscopy images.
Materials
| Name | Company | Catalog Number | Comments |
|---|---|---|---|
| 0.05 µm microalumina polish | Buehler | 4010075 | |
| 0.3 µm microalumina polish | Buehler | 4010077 | |
| 1 µm microalumina polish | Buehler | 4010079 | |
| 20 mL scintillation vials | Fisher Sci | 03-339-26C | |
| Analytical balance | Ohaus | ||
| Apreo C LoVac FEG SEM | Thermo Fisher | ||
| Carbon fiber microelectrode | ALS | 002007 | Working electrode; purchased from CH Instruments |
| Carboxyl Latex Beads, 4% w/v, 2 µm | ThermoFisher Scientific | C37278 | |
| COMSOL Multiphysics | COMSOL Multiphysics | v6.0 | |
| D-(+)-Maltose monohydrate | Sigma Aldrich | M5885 | |
| DigiSim | Bioanalytical Systems, Inc. | v3.03b | Discontinued; comparable software is available commercially through the same vendor |
| EC-Lab | BioLogic | v11.27 | |
| Faraday cages | Custom; analogous equipment can be commercially purchased or fabriated of conductive sheet metals (e.g., copper or aluminum) | ||
| Hummer Sputter Coater | Anatech USA | ||
| OriginPro | OriginLab | v2022b | |
| P1000 micropipette | Fisher Scientific | ||
| P2 micropipette | Fisher Scientific | ||
| P20 micropipette | Fisher Scientific | ||
| P200 micropipette | Fisher Scientific | ||
| Platinum Wire Electrode | CH Instruments | CHI115 | Counter electrode |
| Potassium chloride | Sigma Aldrich | P3911 | |
| PSA-backed MicroCloth | Buehler | 407218 | |
| Saturated Calomel Electrode | CH Instruments | CHI150 | Reference electrode |
| Sodium carbonate | Fisher Chemical | S263 | |
| Sodium hydroxide | Sigma Aldrich | S8045 | |
| Sodium perchlorate | EM Science | SX0692 | |
| SP-300 | BioLogic | ||
| TEMPO | Oakwood Chemical | 013714 | |
| Ultra Low Current module | BioLogic |
References
- Heyrovsky, M., Jirkovsky, J. Polarography and voltammetry of ultrasmall colloids: Introduction to a new field. Langmuir. 11 (11), 4288-4292 (1995).
- Kleijn, S. E. F., et al. Landing and catalytic characterization of individual nanoparticles on electrode surfaces. Journal of the American Chemical Society. 134 (45), 18558-18561 (2012).
- Hill, C. M., Clayton, D. A., Pan, S. Combined optical and electrochemical methods for studying electrochemistry at the single molecule and single particle level: Recent progress and perspectives. Physical Chemistry Chemical Physics. 15 (48), 20797-20807 (2013).
- Dick, J. E., Hilterbrand, A. T., Boika, A., Upton, J. W., Bard, A. J. Electrochemical detection of a single cytomegalovirus at an ultramicroelectrode and its antibody anchoring. Proceedings of the National Academy of Sciences of the United States of America. 112 (17), 5303-5308 (2015).
- Mirkin, M. V., Sun, T., Yu, Y., Zhou, M. Electrochemistry at one nanoparticle. Accounts of Chemical Research. 49 (10), 2328-2335 (2016).
- Sokolov, S. V., Eloul, S., Kätelhön, E., Batchelor-McAuley, C., Compton, R. G. Electrode-particle impacts: A users guide. Physical Chemistry Chemical Physics. 19 (1), 28-43 (2017).
- Stevenson, K. J., Tschulik, K. A materials driven approach for understanding single entity nano impact electrochemistry. Current Opinion in Electrochemistry. 6 (1), 38-45 (2017).
- Baker, L. A. Perspective and prospectus on single-entity electrochemistry. Journal of the American Chemical Society. 140 (46), 15549-15559 (2018).
- Cheng, W., Compton, R. G. Electrochemical detection of nanoparticles by 'nano-impact' methods. TrAC Trends in Analytical Chemistry. 58, 79-89 (2014).
- Bard, A. J., Fan, F. -R. F. Electrochemical detection of single molecules. Accounts of Chemical Research. 29 (12), 572-578 (1996).
- Xiao, X., Bard, A. J. Observing single nanoparticle collisions at an ultramicroelectrode by electrocatalytic amplification. Journal of the American Chemical Society. 129 (31), 9610-9612 (2007).
- Anderson, T. J., Zhang, B. Single-nanoparticle electrochemistry through immobilization and collision. Accounts of Chemical Research. 49 (11), 2625-2631 (2016).
- Goines, S., Dick, J. E. Review-Electrochemistry's potential to reach the ultimate sensitivity in measurement science. Journal of the Electrochemical Society. 167 (3), 037505(2020).
- Kai, T., Zhou, M., Johnson, S., Ahn, H. S., Bard, A. J. Direct observation of C2O4•- and CO2•- by oxidation of oxalate within nanogap of scanning electrochemical microscope. Journal of the American Chemical Society. 140 (47), 16178-16183 (2018).
- Dick, J. E. Electrochemical detection of single cancer and healthy cell collisions on a microelectrode. Chemical Communications. 52 (72), 10906-10909 (2016).
- Sepunaru, L., Sokolov, S. V., Holter, J., Young, N. P., Compton, R. G. Electrochemical red blood cell counting: One at a time. Angewandte Chemie International Edition. 55 (33), 9768-9771 (2016).
- Quinn, B. M., van't Hof, P. G., Lemay, S. G. Time-resolved electrochemical detection of discrete adsorption events. Journal of the American Chemical Society. 126 (27), 8360-8361 (2004).
- Oldham, K. B. Edge effects in semiinfinite diffusion. Journal of Electroanalytical Chemistry and Interfacial Electrochemistry. 122, 1-17 (1981).
- Fosdick, S. E., Anderson, M. J., Nettleton, E. G., Crooks, R. M. Correlated electrochemical and optical tracking of discrete collision events. Journal of the American Chemical Society. 135 (16), 5994-5997 (2013).
- Chung, J., Hertler, P., Plaxco, K. W., Sepunaru, L. Catalytic interruption mitigates edge effects in the characterization of heterogeneous, insulating nanoparticles. Journal of the American Chemical Society. 143 (45), 18888-18898 (2021).
- Boika, A., Thorgaard, S. N., Bard, A. J. Monitoring the electrophoretic migration and adsorption of single insulating nanoparticles at ultramicroelectrodes. The Journal of Physical Chemistry B. 117 (16), 4371-4380 (2013).
- Kim, B. -K., Boika, A., Kim, J., Dick, J. E., Bard, A. J. Characterizing emulsions by observation of single droplet collisions-Attoliter electrochemical reactors. Journal of the American Chemical Society. 136 (13), 4849-4852 (2014).
- Dick, J. E., Renault, C., Bard, A. J. Observation of single-protein and DNA macromolecule collisions on ultramicroelectrodes. Journal of the American Chemical Society. 137 (26), 8376-8379 (2015).
- Lee, J. Y., Kim, B. -K., Kang, M., Park, J. H. Label-free detection of single living bacteria via electrochemical collision event. Scientific Reports. 6 (1), 30022(2016).
- Bonezzi, J., Boika, A. Deciphering the magnitude of current steps in electrochemical blocking collision experiments and its implications. Electrochimica Acta. 236, 252-259 (2017).
- Ellison, J., Batchelor-McAuley, C., Tschulik, K., Compton, R. G. The use of cylindrical micro-wire electrodes for nano-impact experiments; Facilitating the sub-picomolar detection of single nanoparticles. Sensors and Actuators B: Chemical. 200, 47-52 (2014).
- Denuault, G., Fleischmann, M., Pletcher, D., Tutty, O. R. Development of the theory for the interpretation of steady state limiting currents at a microelectrode: EC' processes: First and second order reactions. Journal of Electroanalytical Chemistry and Interfacial Electrochemistry. 280 (2), 243-254 (1990).
- Francke, R., Little, R. D. Redox catalysis in organic electrosynthesis: Basic principles and recent developments. Chemical Society Reviews. 43 (8), 2492-2521 (2014).
- Nutting, J. E., Rafiee, M., Stahl, S. S. Tetramethylpiperidine N-Oxyl (TEMPO), phthalimide N-oxyl (PINO), and related N-Oxyl species: Electrochemical properties and their use in electrocatalytic reactions. Chemical Reviews. 118 (9), 4834(2018).
- Pierre, G., et al. TEMPO-mediated oxidation of polysaccharides: An ongoing story. Carbohydrate Polymers. 165, 71-85 (2017).
- Liaigre, D., Breton, T., Belgsir, E. M. Kinetic and selectivity control of TEMPO electro-mediated oxidation of alcohols. Electrochemistry Communications. 7 (3), 312-316 (2005).
- Rafiee, M., Karimi, B., Alizadeh, S. Mechanistic study of the electrocatalytic oxidation of alcohols by TEMPO and MHPI. ChemElectroChem. 1 (2), 455-462 (2014).
- Deng, Z., Renault, C. Detection of individual insulating entities by electrochemical blocking. Current Opinion in Electrochemistry. 25, 100619(2021).
- Laborda, E., Molina, A., Batchelor-McAuley, C., Compton, R. G. Individual detection and characterization of non-electrocatalytic, redox-inactive particles in solution by using electrochemistry. ChemElectroChem. 5 (3), 410-417 (2018).
- Elgrishi, N., et al. A practical beginner's guide to cyclic voltammetry. Journal of Chemical Education. 95 (2), 197-206 (2018).
- Cardwell, T. J., Mocak, J., Santos, J. H., Bond, A. M. Preparation of microelectrodes: comparison of polishing procedures by statistical analysis of voltammetric data. Analyst. 121 (3), 357-362 (1996).
- Lämmel, C., Heubner, C., Liebmann, T., Schneider, M. Critical impact of chloride containing reference electrodes on electrochemical measurements. Electroanalysis. 29 (12), 2752-2756 (2017).
- Walker, N. L., Dick, J. E. Leakless, bipolar reference electrodes: Fabrication, performance, and miniaturization. Analytical Chemistry. 93 (29), 10065-10074 (2021).
- Troudt, B. K., Rousseau, C. R., Dong, X. I. N., Anderson, E. L., Bühlmann, P. Recent progress in the development of improved reference electrodes for electrochemistry. Analytical Sciences. 38 (1), 71-83 (2022).
- Stuart, E. J. E., Zhou, Y. -G., Rees, N. V., Compton, R. G. Particle-impact nanoelectrochemistry: A Fickian model for nanoparticle transport. RSC Advances. 2 (33), 12702-12705 (2012).
- Boika, A., Bard, A. J. Time of first arrival in electrochemical collision experiments as a measure of ultralow concentrations of analytes in solution. Analytical Chemistry. 87 (8), 4341-4346 (2015).
- Robinson, D. A., et al. Collision dynamics during the electrooxidation of individual silver nanoparticles. Journal of the American Chemical Society. 139 (46), 16923-16931 (2017).
- Lemay, S. G., Moazzenzade, T. Single-entity electrochemistry for digital biosensing at ultralow concentrations. Analytical Chemistry. 93 (26), 9023-9031 (2021).
- Vernon-Parry, K. D. Scanning electron microscopy: An introduction. III-Vs Review. 13 (4), 40-44 (2000).
- Abramoff, M. D., Magalhães, P. J., Ram, S. J. Image processing with ImageJ. Biophotonics International. 11 (7), 36-42 (2004).
- Collins, T. J. ImageJ for microscopy. BioTechniques. 43, S25-S30 (2007).
- Bard, A. J., Faulkner, L. R. Electrochemical Methods: Fundamentals and Applications. , Wiley. New York, NY. (2001).
- Compton, R. G., Banks, C. E. Understanding Voltammetry (Third Edition). , World Scientific. Singapore. (2018).
- Cutress, I. J., Dickinson, E. J. F., Compton, R. G. Analysis of commercial general engineering finite element software in electrochemical simulations. Journal of Electroanalytical Chemistry. 638 (1), 76-83 (2010).
- Dickinson, E. J. F., Ekström, H., Fontes, E. COMSOL Multiphysics®: Finite element software for electrochemical analysis. A mini-review. Electrochemistry Communications. 40, 71-74 (2014).
- Deng, Z., Elattar, R., Maroun, F., Renault, C. In situ measurement of the size distribution and concentration of insulating particles by electrochemical collision on hemispherical ultramicroelectrodes. Analytical Chemistry. 90 (21), 12923-12929 (2018).
- Moazzenzade, T., Walstra, T., Yang, X., Huskens, J., Lemay, S. G. Ring ultramicroelectrodes for current-blockade particle-impact electrochemistry. Analytical Chemistry. 94 (28), 10168-101747 (2022).
- Nekrassova, O., et al. The oxidation of cysteine by aqueous ferricyanide: A kinetic study using boron doped diamond electrode voltammetry. Electroanalysis. 14 (21), 1464-1469 (2002).
- Kuss, S., Compton, R. G. Electrocatalytic detection of ascorbic acid using N,N,N',N'-tetramethyl-para-phenylene-diamine (TMPD) mediated oxidation at unmodified gold electrodes; Reaction mechanism and analytical application. Electrochimica Acta. 242, 19-24 (2017).
- Shayani-Jam, H., Nematollahi, D. Electrochemically mediated oxidation of glutathione and N-acetylcysteine with 4,4′-biphenol. Electrochimica Acta. 56 (25), 9311-9316 (2011).
- Vyskočil, V., Barek, J. Mercury electrodes-Possibilities and limitations in environmental electroanalysis. Critical Reviews in Analytical Chemistry. 39 (3), 173-188 (2009).
Reprints and Permissions
