This paper presents a reproducible method with new findings on the presence of epithelial cells in normal human and mouse blood and bone marrow using flow cytometry and immunofluorescence microscopy. Krt1-14;mTmG transgenic mice were used as an in vivo method to confirm these findings.
Method Article
Evidence for EpCAM and Cytokeratin Expressing Epithelial Cells in Normal Human and Murine Blood and Bone Marrow
Opens in a new tab
In This Article
Summary
Loading...
$$\rightleftharpoonup{xx}$$
$$\longleftharp{xx}$$,
$$\longrightharp{xx}$$,
Abstract
Loading...
$$\rightleftharpoonup{xx}$$
$$\longleftharp{xx}$$,
$$\longrightharp{xx}$$,
Epithelial cells have been identified in the blood and bone marrow of patients with cancer and other diseases. However, the presence of normal epithelial cells in the blood and bone marrow of healthy individuals has yet to be identified in a consistent way. Presented here is a reproducible method for isolating epithelial cells from healthy human and murine blood and bone marrow (BM) using flow cytometry and immunofluorescence (IF) microscopy. Epithelial cells in healthy individuals were first identified and isolated via flow cytometry using epithelial cell adhesion molecule (EpCAM). These EpCAM+ cells were confirmed to express keratin using immunofluorescence microscopy in Krt1-14;mTmG transgenic mice. Human blood samples had 0.18% ± 0.0004 EpCAM+ cells (SEM; n=7 biological replicates, 4 experimental replicates). In human BM, 3.53% ± 0.006 (SEM; n=3 biological replicates, 4 experimental replicates) of mononuclear cells were EpCAM+. In mouse blood, EpCAM+ cells constituted 0.45% ± 0.0006 (SEM; n=2 biological replicates, 4 experimental replicates), and in mouse BM, 5.17% ± 0.001 (SEM; n=3 biological replicates, 4 experimental replicates) were EpCAM+. In mice, all the EpCAM+ cells were immunoreactive to pan-cytokeratin, as determined by IF microscopy. Results were confirmed using Krt1-14;mTmG transgenic mice, with low (8.6 native GFP+ cells per 106 cells analyzed; 0.085% of viable cells), but significant numbers (p < 0.0005) of GFP+ cells present in normal murine BM, that were not the result of randomness compared with multiple negative controls. Further, EpCAM+ cells in mouse blood were more heterogeneous than CD45+ cells (0.58% in BM; 0.13% in blood). These observations conclude that cells expressing cytokeratin proteins are reproducibly detectable among mononuclear cells from human and murine blood and BM. We demonstrate a method of tissue harvesting, flow cytometry, and immunostaining that can be used to identify and determine the function of these pan-cytokeratin epithelial cells in healthy individuals.
Introduction
Loading...
$$\rightleftharpoonup{xx}$$
$$\longleftharp{xx}$$,
$$\longrightharp{xx}$$,
Epithelial cells are found in the physical barriers between our bodies and the environment and are able to recognize and respond to changes in their microenvironment1. They have a proliferating stem cell niche which provides a way to turn over new tissue and repair damage2. Our lab studies stem cells in the hair follicles of the skin; skin is a good model for studying epithelial tissue and stem cell proliferation because it is easily visible and there is a constant turnover of cells. Epithelial cancers are the most common form of cancer, possibly due to epithelial tissues, such as the skin, being the first line of defense against environmental carcinogens, leading to high turnover rates and the proliferation of epithelial cells3. Most of the skin epidermis, the top protective layer, is composed of keratinocytes, which express different types of keratins to provide support and structure4. Patients with epithelial cancers often have epithelial cells present in their blood and bone marrow that also express keratins. Liquid biopsies are a noninvasive way to detect and monitor these epithelial cells in different bodily fluids5. Circulating epithelial cells, also called circulating tumor cells (CTCs), are found in peripheral blood and can be biomarkers for cancer prognosis, as well as guide individualized therapy treatments. CTCs can also indicate disease progression, treatment efficacy, and overall patient survival5,6.
Epithelial cell adhesion molecule (EpCAM) is a clinically used marker for CTCs and can identify tumors of epithelial origin in cancer patients. EpCAM plays a role in cell adhesion, migration, signaling, proliferation, and differentiation6. For a circulating epithelial cell to be classified as a CTC, it must be positive for cytokeratins 8, 18, and 19, and negative for CD45, a common leukocyte marker6. CTCs are usually identified by first depleting CD45 with magnetic microbeads, followed by testing for EpCAM and cytokeratin 19 using immunofluorescence microscopy7. The main limitation in the detection of CTCs is their rarity; they make up less than 0.01% of all cells in the blood, and very few survive in circulation to reach distant organs8,9,10. Consideration must be taken in designing experiments and techniques to isolate and identify these cells due to their rare nature. Currently, there is only one Food and Drug Administration (FDA)-approved automated single-cell sorter used for identifying CTCs, and it uses EpCAM as its biomarker. Other methods include magnetic bead separation and flow cytometry, or a combination of these methods. There is a need for new techniques that have higher sensitivity and specificity for the detection of rare CTCs11.
Flow cytometry is a preferred method for the detection of rare cell populations in the blood, bone marrow, and other tissue samples. These rare cells can include stem cells, circulating endothelial cells, CTCs, and residual disease cells. Flow cytometry enables quantitative measurements of each cell type and sorts these cells for further testing7,9. Incremental counts were performed to ensure an accurate assessment of these rare cells. The ability to use gating to exclude cells from further analysis is a way to increase specificity when analyzing cells. The limitations of flow cytometry are the time required for the analysis of large samples and the lack of visual confirmation for cell identity. To overcome this, immunofluorescence microscopy was performed on the sorted cells to confirm their identities.
Previously our lab has shown that in mice the bone marrow cells are recruited and contribute to skin tumors12. These bone marrow-derived cells are positive for pan-cytokeratin and epidermal cytokeratin. To further elucidate the role of epithelial stem cells, bone marrow-derived cells, and cytokeratin-expressing cells in tumor progression, EpCAM+ cytokeratin-positive cells in normal murine and human blood and bone marrow samples were looked for. As with most experiments, this method was developed through multiple iterations. Previously, transgenic mice were used along with incremental counts to look for K14GFP-expressing cells in the bone marrow12. As more cells were counted, a representative population of rare cells was able to be identified, as shown in Figure 1 in the representative results section. The rationale for investigating epithelial cells in normal blood and bone marrow was based on early literature on CTCs, where normal healthy donors had background levels of EpCAM+ cells13. As mentioned previously, EpCAM characterization often begins with the depletion of CD45. This step was omitted because some hematopoietic cells have EpCAM and cytokeratin expression for unknown reasons that need to be investigated further. Therefore, cells were sorted based on the presence or absence of EpCAM, irrespective of cell lineage, and then immunostained for cytokeratin. The protocol below and the workflow shown in Figure 2 describe a technique that uses flow cytometry with compensation and controls, statistical methods, and immunofluorescence imaging to isolate and identify these rare populations of epithelial cells.
Protocol
Loading...
$$\rightleftharpoonup{xx}$$
$$\longleftharp{xx}$$,
$$\longrightharp{xx}$$,
All animal protocols were approved by the University of Minnesota Institutional Animal Care and Use Committee in accordance with NIH and federal guidelines. Fresh human blood and bone marrow were purchased from commercial sources. Samples were collected by the company under an approved IRB protocol from donors negative for HIV, Hepatitis B, Hepatitis C, and screened for COVID-19. All samples were first de-identified and anonymized before being shipped by the company. Since these were commercially obtained, no IRB approval was required.
1. Preparation of solutions
NOTE: All solutions must be prepared in a biological hood with a sterile environment. Obtain biosafety level 2 (BSL2) certification for work with human blood and bone marrow.
- Prepare bone marrow harvest solution by adding 1 mL of gentamicin and 5 mL of fetal bovine serum (FBS) to 500 mL of Hank's balance salt solution (HBSS).
- Prepare the staining buffer solution by adding 50 mL of FBS to 500 mL of HBSS.
- Prepare 1x lysis buffer by combining 10 mL of 10x lysis buffer with 90 mL of sterile water.
2. Preparing the hood
- Turn on the hood and allow it to run for a few minutes to obtain proper airflow.
- Collect all the materials to perform bone marrow harvest. Spray them inside the hood with 70% ethanol to maintain a sterile environment. Spray the hands every time before they are taken inside the hood.
- Place the autoclaved tray in the hood along with autoclaved scissors, an assembled scalpel, tweezers, and curved forceps in a small cup filled with 70% ethanol to keep them sterile.
- Add 10 mL of bone marrow harvest solution to one 50 mL centrifuge tube and label it "Limbs". Label another 50 mL centrifuge tube as "Bone Marrow".
- Draw up 10 mL of bone marrow harvest solution into a syringe and then attach a 26 G needle.
3. Harvesting bone marrow from mice
- Euthanize the mouse using CO2 asphyxiation. Death is confirmed by the absence of a heartbeat and pinching the feet to ensure that there is no reaction. Cervical dislocation may be performed as a secondary means of complete euthanasia.
- Place the mouse in a 500 mL container and add enough iodine to cover half of the mouse. Gently shake and swirl the container to ensure thorough coverage. Rinse with deionized water. Perform one more iodine wash, and then two washes with 70% ethanol following the same steps.
- Place the mouse in the hood and lay it on its back on the tray. Grab the hind legs and pull them apart until a pop is felt; this is to separate the legs from the spine.
- Make a 1 cm incision on the mouse's skin near the groin area. Insert a closed pair of scissors into the incision and then open the scissors under the skin to separate it from the peritoneum.
- Cut the skin on the leg around the thigh, and then cut the skin down the leg to expose the muscles and bones.
- Remove the hind legs by cutting around the hip joint, being sure not to cut through the femur. Place the limbs in the tube labeled as "Limbs" When both legs are removed, place the mouse into a carcass bag and put it in the freezer.
NOTE: The hip bone should be felt first before cutting to guide the scissors and avoid cutting the femur bone, as most of the bone marrow is obtained from the femur. - Start cutting away the muscles, tissue, and fat along one of the limbs using the scissors. Cut parallel to the bone. Then, use the scalpel and remove the remaining fat or muscle, using a perpendicular scraping motion against the bone.
- Once the bone is cleaned properly, separate the femur and tibia at the knee. Use the scalpel to make cuts on both ends of the femur and tibia where there is no visible bone marrow.
- Insert the prepared syringe and needle into the bone. If there is resistance, cut a little more off the end of the bone until there is no more resistance.
- While holding the bone above the tube labeled as "Bone Marrow", expel bone marrow harvesting solution through the bone to flush the bone marrow into the tube. Repeat on the other end of the bone to obtain the rest of the bone marrow, until the bone appears all white or empty.
- Repeat steps 7-9 for all remaining bones and limbs; all marrow will be flushed into the same conical tube.
- Using an empty 10 mL syringe and a 20 G needle, break up the clumps of bone marrow in the tube by drawing the bone marrow up and down in the syringe 5-10 times.
- Add a sterile 40 µm filter to a clean 50 mL centrifuge tube and rinse it with 1 mL of bone marrow harvest solution. Then, filter the bone marrow to remove any remaining clumps. Label this tube "Filtered Bone Marrow".
- Store the filtered bone marrow in the refrigerator or on ice until use. It should be used on the same day of harvesting. If not used on the same day, freeze the cells using a cryo-preservative, such as dimethyl sulfoxide (DMSO).
CAUTION: All waste from these experiments should be disposed of properly in a biohazard waste container. All sharps should go in a properly labeled biohazard sharps container.
4. Red blood cell lysis of bone marrow
- Centrifuge the bone marrow cells at 170 x g for 10 min at room temperature. Vacuum and dispose of the supernatant. Resuspend the cells in 10 mL of 1x red blood cell lysis buffer and incubate for 4 min.
- Add 30 mL of Dulbecco's phosphate buffered saline (DPBS) to stop the reaction of the lysis buffer. Centrifuge the cells for 8 min at 170 x g at room temperature. Vacuum and dispose of the supernatant. Resuspend in 10-20 mL of staining buffer.
5. Cell count
- Combine 500 μl of cells with 9.5 mL of bone marrow harvest solution to obtain a 1:20 dilution.
NOTE: This will be used for cell counts and does not need to be kept sterile. - Draw out 200 µL of cells from the 1:20 dilution, add them to 200 µL of trypan blue, and mix well.
- Add the mixture to a hemocytometer and count the alive and dead cells on both sides. Calculate the original cell suspension using this table (shown in Supplementary File 1) and equations:
Cells per milliliter:
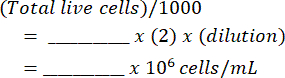
Total Cells:

- Spin down the cells at 170 x g for 10 min at 4 °C and resuspend to a concentration of 10 x 106 per 1 mL (1 x 10⁶ cells per 100 µL), based on the manufacturer's suggestions for antibody dilutions.
- Proceed to flow cytometry (step 8).
6. Harvesting blood from mice
- Euthanize the mouse using CO2 gas or cervical dislocation.
- Perform a cardiac blood draw at a 45° angle with a 26 G needle attached to a 1 mL syringe coated with 0.5 M ethylenediaminetetraacetic acid (EDTA).
- Spin down the blood and resuspend in media or staining buffer.
NOTE: The cells will be spun down and resuspended to final concentration in staining buffer after red blood cell lysis and cell count. - Perform the red blood cell lysis (step 4).
- Perform the cell count (step 5).
- Proceed to flow cytometry (step 8).
7. Processing human blood and bone marrow samples
- Perform all procedures under a BSL2-certified hood while wearing personal protective equipment.
- Collect the samples the previous night and perform red blood cell lysis. Ensure that the samples are de-identified and anonymized before shipping the mononuclear samples overnight on ice.
- Upon arrival, spin down the live cells at 170 x g at 4 °C for 10 min.
NOTE: These are BSL2 samples which must follow local guidelines. - Resuspend the cells in media or staining buffer.
NOTE: The cells should be spun down and resuspended to the final concentration after cell counting with staining buffer. - Perform the cell count (step 5).
- Proceed to flow cytometry (step 8).
8. Flow cytometry
- Staining
- Divide the cells into individually labeled tubes based on the staining panel used, including compensation controls (unstained, isotype controls, single stained, and fluorescence minus ones [FMOs]). Freeze any remaining cells or use them for fluorescence-activated cell sorting. See Table 1 for an example of a staining panel with the antibody dilutions used.
NOTE: For every additional fluorophore added, FMOs in combination with remaining fluorophores must be added along with a single stain of that fluorophore. Isotype controls may be used to block non-specific staining. Each new antibody used should be titrated with the samples for optimal dilution. - Add antibodies according to the manufacturer's recommended dilutions and mix well by flicking the bottom of the tubes. Antibody concentrations are usually given as 1 x 10⁶ cells per 100 µL. Dilutions with antibodies and controls are shown in Table 1. Antibodies are conjugated with fluorophores and must be protected from light.
NOTE: It is best to use EpCAM conjugated to phycoerythrin (PE) to enable visualizing low populations of cells (titrate at 3-5 µL per 1 million cells, as indicated in Table 1). PE-CD49f was used as a single stain PE control (20 µL per 1 million cells), since these cells are more prevalent than PE-EpCAM and thus easier to use for compensation. - Incubate for 30 min at 4 °C in the dark.
- After incubation, bring the tubes back to the BSL2 hood and add 1 mL of staining buffer to each tube.
- Then, centrifuge the tubes at 170 x g at 4 °C for 5-10 min.
- After centrifugation, bring the capped tubes with the cells back to the BSL2 hood and aspirate out the supernatant. Be sure to change the tips of the aspiration pipette between each tube to prevent cross-contamination.
- Resuspend the cell pellet in 1 mL of staining buffer and flick the bottom of the tubes to mix.
- Wash the cells two more times by repeating steps 8.1.4-8.1.7.
NOTE: Do not use pipettes to resuspend, to avoid losing cells. - Resuspend in 500 µL of staining buffer for the final resuspension before flow cytometry. Add 4′,6-diamidino-2-phenylindole (DAPI) or dead cell discriminator, according to the manufacturer's recommendations.
- Divide the cells into individually labeled tubes based on the staining panel used, including compensation controls (unstained, isotype controls, single stained, and fluorescence minus ones [FMOs]). Freeze any remaining cells or use them for fluorescence-activated cell sorting. See Table 1 for an example of a staining panel with the antibody dilutions used.
- Flow cytometer
- After setting up the machine, use the controls and FMOs to set the compensation and gates. Use Hank's balanced salt solution (HBSS) as sheath fluid to help support the fragile cells. Use PBS if HBSS is not available.
NOTE: The flow cytometer used and the software are listed in the Table of Materials. - Load the samples one at a time and collect data points for 50,000, 100,000, 500,000, and one million events. Keep the tubes on ice or refrigerated until use.
NOTE: A time limit can be set when collecting to ensure sample viability. - Collect the cells into 3 mL of RPMI with 10% FBS in 15 mL centrifuge tubes.
- If performing immunofluorescence on EpCAM+ cells, use the flow cytometer to sort 800 to 1,000 cells into each well of an 8-well slide.
- Sort out the EpCAM- cell population onto separate slides as a negative control to use when staining for immunofluorescence.
NOTE: The cells can also be sorted into 15 mL tubes containing FBS and spun onto a slide using the cytocentrifuge or a pipette to prevent cells from popping. - Fix the slides in a 50% methanol/50% acetone mixture at -20 °C for 10 min. Store the slides at -20 °C until staining with immunofluorescence.
- After setting up the machine, use the controls and FMOs to set the compensation and gates. Use Hank's balanced salt solution (HBSS) as sheath fluid to help support the fragile cells. Use PBS if HBSS is not available.
- Flow cytometry analysis
- Open the licensed flow cytometry analysis software.
- Load flow cytometry standard (FCS) files acquired from the flow cytometer with controls and samples.
- Click Create Group and use keywords to place samples and controls into a group.
NOTE: Use the "no stain" control to gate in the flow cytometry analysis software, as shown in Figure 3. - Double click on the no stain control sample to open an ungated graph.
- Set the graph y-axis to SSC-A and x-axis to FSC-A (side scatter area by forward scatter area), which indicates cell size and internal complexity.
- Click on the polygon shape in the top left panel and create a gate around the cells. Make sure to exclude the cells on the periphery, as these are most likely debris. Label this gate "Cells", as shown in Figure 3A.
- Once the cells are gated, double click inside the polygon shape to open another graph in a new window.
- Set the y-axis of the new graph to SSC-A and the x-axis to SSC-W for doublet discrimination. Click the polygon shape and create a rectangle around the single cells. Label this "Single Cells", as shown in Figure 3B.
- Once the cells are gated, double click inside the polygon shape to open another graph in a new window.
- Set the y-axis to FSC-A and x-axis to DAPI-A (or whichever dead cell discriminator is used).
- Create a polygon gate around the DAPI negative cells on the left-hand side of the graph. Label these "Live Cells", as shown in Figure 3C.
- Once the cells are gated, double click inside the polygon shape to open another graph in a new window.
- Set the y-axis to SSC-A and x-axis to EpCAM-PE (or whichever fluorophore is used to identify the EpCAM cells). Cells on the left are EpCAM negative. If any cells are shown on the right, they are EpCAM positive.
- Use the EpCAM-PE graph to create a polygon gate, which excludes the cells on the left and only includes the empty space on the right. Label the empty area on the right inside the polygon "EpCAM", as shown in Figure 3D.
NOTE: This is a no stain control, so there should not be EpCAM expression. Use the no stain control to determine which cells are EpCAM positive. This completes the gating strategy for compensation, so all graphs may be closed at this time. - On the workspace page, highlight the no stain lineage with "Cells", "Single Cells", "Live Cells", and "EpCAM". Right click and select copy analysis to group. This copies the gating strategy to all other loaded samples within the previously created group. If a group was not created initially, it can be created now by selecting Create Group in the top left.
- Go through the samples within the group and check the polygon gates drawn previously to make sure they fit with all the samples and controls. This provides the percentage number and number of cells.
- Click the layout editor button L in the top left corner above "Workspace". These graphs may then be arranged and exported using the layout editor.
- Preparation of immunofluorescence reagents
- Prepare the antibody diluent by combining 1 g of bovine serum albumin (BSA), 2 g of non-fat milk, 10 mL of 10x tris-buffered saline (TBS), 100 µL of Tween, and 90 mL of distilled water.
- Prepare TBST by combining 50 mL of 20x TBS, 950 mL of distilled water, and 200 µL of Tween.
- Prepare 10% Normal Horse Serum (NHS) by combining 1 mL of NHS with 9 mL of antibody diluent (step 8.4.1).
- Prepare 1% NHS by combining 1 mL of 10% NHS with 9 mL of TBST.
- Immunofluorescence staining
- Remove the slides from -20 °C and allow them to warm up to room temperature.
- Wash the slides three times in distilled water for 5 min each.
- Block the slides for 1 h at room temperature in 10% NHS in antibody diluent (step 8.4.3).
- Dilute the primary antibody (pan-cytokeratin) to 1:750 in 1% NHS in TBST (step 8.4.4). Incubate slides in the diluted primary antibody overnight at 4 °C.
- The next day, wash the slides three times with a 1x wash buffer (PBS or TBST) for 5 min each.
- Dilute the secondary antibody to 1:1,000 in 1% NHS in TBST (step 8.4.4). Incubate the slides in the diluted secondary antibody for 1h at room temperature.
- Wash the slides three times with 1x wash buffer for 5 min each. Mount and coverslip the slides with hardset mounting media with DAPI. Use a cotton swab to gently roll out any bubbles under the coverslip.
Results
Loading...
$$\rightleftharpoonup{xx}$$
$$\longleftharp{xx}$$,
$$\longrightharp{xx}$$,
Using these methods, rare populations of epithelial cells in the blood and bone marrow of normal humans and mice were visualized. With the proper compensations and controls as described, the results consistently that showed 4%-5% of cells in murine bone marrow were EpCAM+, regardless of how many cells were counted, as shown in Figure 4 and Figure 5. In murine blood samples, less than 0.5% of cells were EpCAM+, as shown in Figure 6. In human bone marrow samples, 2%-5% of cells were EpCAM+, as shown in Figure 7 and Figure 8. While 2%-5% is a big range, percentages within each individual donor were consistent as incrementally more cells were counted. In human blood samples, around 0.3% of cells were EpCAM+, as shown in Figure 9. Our control samples (no stain, isotype control, and FMOs) yielded very few false-positive EpCAM+ results, as shown in Figure 4 and Figure 7. Cells from the EpCAM+ and EpCAM- groups that were sorted onto slides showed positive staining for pan-cytokeratin in EpCAM+ samples, and were negative for pan-cytokeratin in EpCAM- samples, as shown in Figure 10. These results indicate that the experiments were appropriately designed and reproducible.
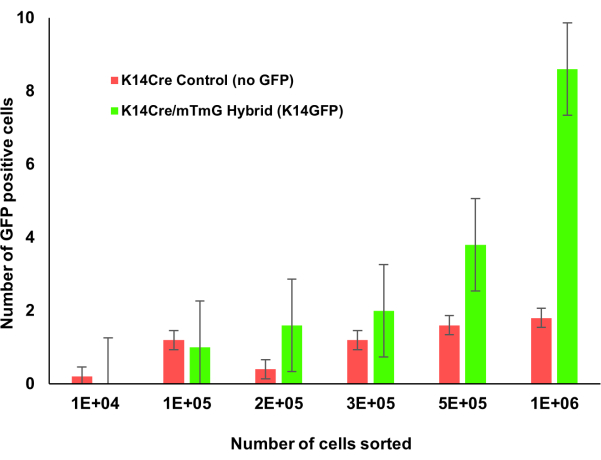
Figure 1: Krt14Cre;mTmG transgenic mice with incremental counts of bone marrow. The bone marrow of Krt1-14;mTmG mice were counted incrementally. GFP positive cells indicate keratin 14 expression and were identified using flow cytometry. As more bone marrow cells were counted, this keratin 14 positive cell population was more easily identifiable. Please click here to view a larger version of this figure.
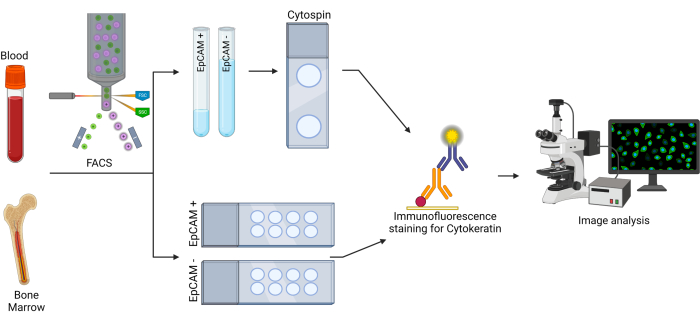
Figure 2: Workflow for EpCAM+ and cytokeratin+ cells. The bone marrow and blood cells were first sorted using fluorescence activated cell sorting (FACS) to separate EpCAM+ and EpCAM- cells. These cells were sorted into two different test tubes, as well as onto two different slides. The cells sorted into test tubes were spun onto slides using a cytocentrifuge. The slides were then stained using a pan-cytokeratin primary antibody, then stained with a secondary antibody. The slides were analyzed using fluorescence microscopy to observe pan-cytokeratin expression. Please click here to view a larger version of this figure.
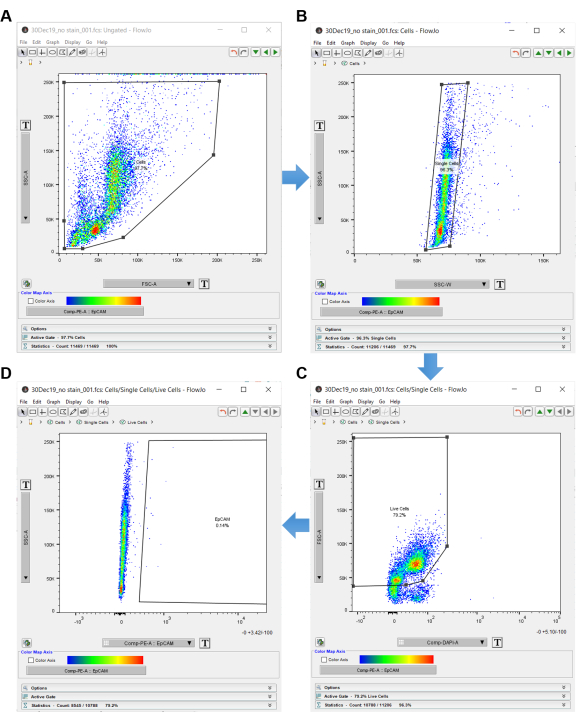
Figure 3: Flow cytometry analysis software. When analyzing flow cytometry data using analysis software, the no stain control is used to select the cells of interest. Cells are first selected with SSC-A and FSC-A, which show the internal complexity and size of the cells. (A) A polygon gate is drawn around the cells. (B) Single cells are acquired by gating SSC-A by SSC-W. (C) Live cells are acquired by gating FSC-A versus DAPI. (D) EpCAM negative cells are excluded by gating to the right of the EpCAM negative cells. Please click here to view a larger version of this figure.
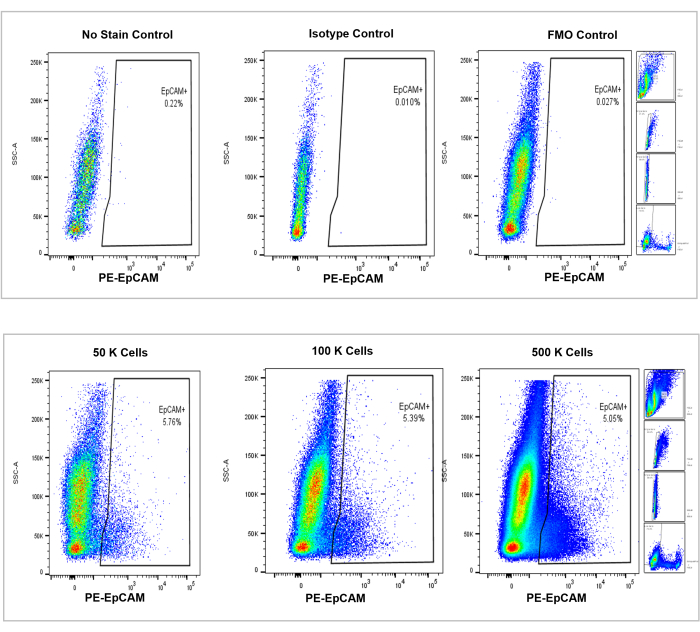
Figure 4: Flow cytometric analysis of EpCAM+ cells in mouse bone marrow. Controls of no stain, isotype, and FMOs are shown in the top panel, with the incremental counts of 50,000, 100,000, and 500,000 cells shown in the bottom panel. These charts visualize the consistency in percentages across counts, despite the overall increase in total cells counted. The panels on the right indicate the gating strategy, as discussed previously in the flow cytometry analysis section and as shown in Figure 3. Please click here to view a larger version of this figure.
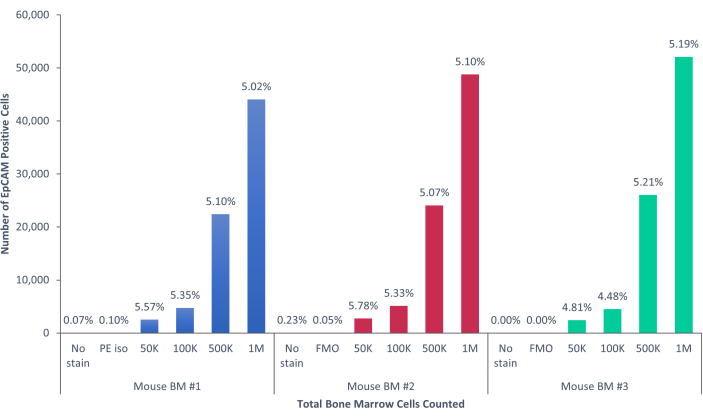
Figure 5: EpCAM+ cells in mouse bone marrow comprise 5.17% ± 0.001% of the population. The bone marrow cells of three individual mice were analyzed. The appropriate controls were included for proper scientific rigor. The percentage of positive cells remained consistent across the samples, due to the mice being genetically identical. Please click here to view a larger version of this figure.
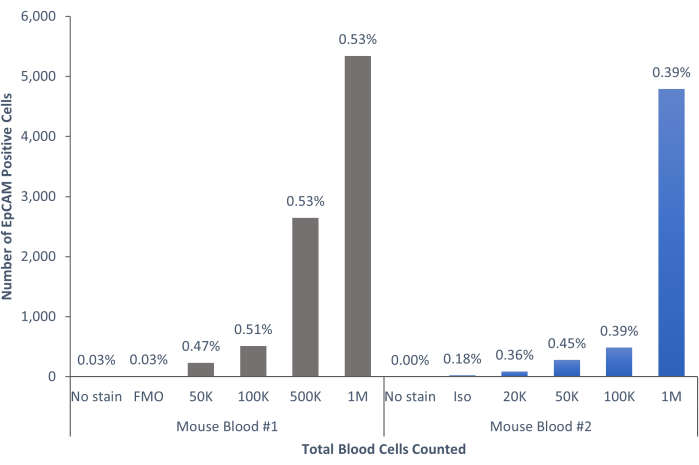
Figure 6: EpCAM+ cells in mouse blood comprise 0.45% ± 0.0006% of the population. The blood cells of two individual mice were analyzed. Controls were included to show the proper procedure was followed to produce conclusive results. Please click here to view a larger version of this figure.
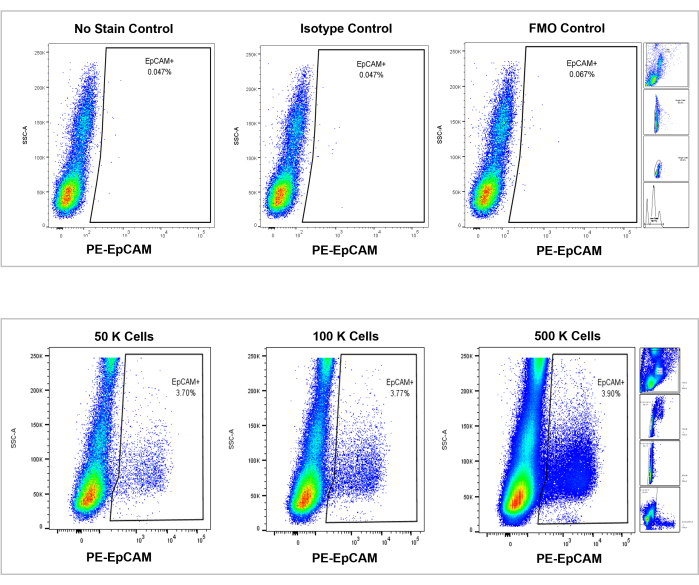
Figure 7: Flow cytometric analysis on EpCAM+ human bone marrow. Controls of no stain, isotype, and FMOs are shown in the top panel, and the incremental counts of 50,000, 100,000, and 500,000 cells are shown in the bottom panel. These charts visualize the consistency in percentages across counts, despite the overall increase of total cells counted. The panels on the right indicate the gating strategy, as discussed previously in the flow cytometry analysis section and as shown in Figure 3. Please click here to view a larger version of this figure.
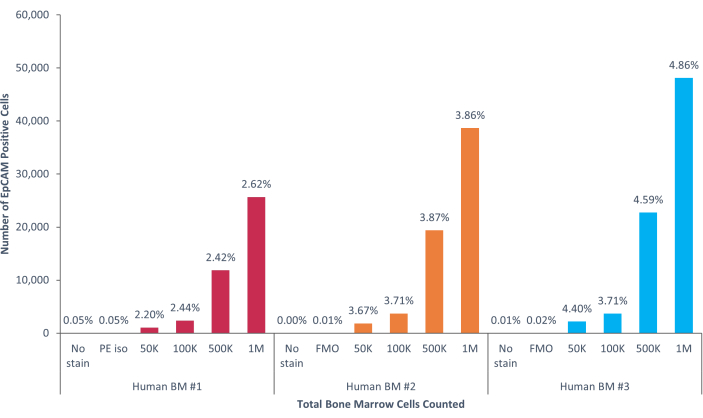
Figure 8: EpCAM+ cells in human bone marrow comprise 3.53% ± 0.006% of the population. Three different human bone marrow samples were analyzed. Appropriate controls for scientific rigor were included. The percentage of positive cells varies due to genetic heterogeneity among humans. Please click here to view a larger version of this figure.
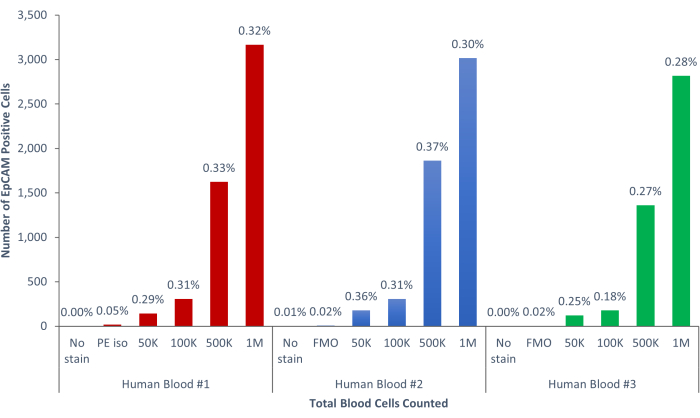
Figure 9: EpCAM+ cells of human blood comprise 0.18% ± 0.0004% of the population. Three different human blood samples were analyzed. Appropriate controls for scientific rigor were included. Please click here to view a larger version of this figure.
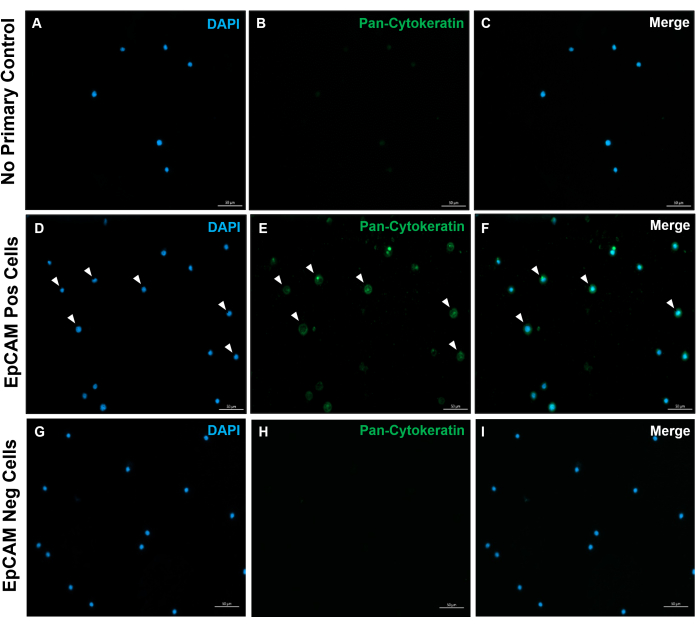
Figure 10: Immunofluorescence of EpCAM+ and EpCAM- slides. FACS was used to separate EpCAM+ and EpCAM- cells. Pan-cytokeratin was stained for using the DAKO pan-cytokeratin antibody. No primary antibody control in normal serum was used, as the pan-cytokeratin is a polyclonal antibody. These results confirm the accuracy of FACS. Please click here to view a larger version of this figure.
| Human Bone Marrow or Blood | |||
| Antibody | Tube # | # of Cells | AB Conc |
| Unstained | 1 | 1x10⁶ | X |
| DAPI only | 2 | 1x10⁶ | 1uL/mL |
| PE isotype control | 3 | 1x10⁶ | 1 uL |
| CD49f-PE Single Stain Control | 4 | 1x10⁶ | 20 uL in 100uL per 1x10⁶ |
| EpCAM-PE Low Titration | 5 | 1x10⁶ | 3 uL in 100uL per 1x10⁶ |
| EpCAM-PE Medium Titration | 6 | 1x10⁶ | 4 uL in 100uL per 1x10⁶ |
| EpCAM-PE High Titration | 7 | 1x10⁶ | 5 uL in 100uL per 1x10⁶ |
| EpCAM-PE High Sort on Slides | 8 | 10x106 | 50 uL in 1 mL |
Table 1: Flow cytometry staining panel. An example of a flow cytometry staining panel for blood or bone marrow mononuclear cells. Controls included are DAPI only, unstained control, and PE single stain control (PE-CD49f was used as a better positive control). Fluorescence minus one is not included in this panel as it is only a single color (PE). When adding more fluorophore colors, such as fluorescein isothiocyanate (FITC) or allophycocyanin (APC), FMOs should be included by excluding one fluorophore for each FMO control.
Supplementary File 1: Live cell counting using hematocytometer. Please click here to download this File.
Discussion
Loading...
$$\rightleftharpoonup{xx}$$
$$\longleftharp{xx}$$,
$$\longrightharp{xx}$$,
There is some evidence in the literature of the presence of epithelial cells in the bone marrow. Previously, papers have typically investigated the role of epithelial cells within the context of disease and injury, such as in the liver, lung, gastrointestinal (GI) tract, thymus, and skin14,15,16,17. However, not much is known about the presence of these epithelial cells in the bone marrow of healthy individuals. This paper seeks to establish a reproducible method, with the aim of identifying and isolating epithelial cells from normal blood and bone marrow. This method will drive the field forward to identify why epithelial cells are present and what their role is in the blood and bone marrow in the absence of disease; perhaps these cells are part of normal tissue maintenance or activated at times of injury. The bone marrow is a repository of stem cells; however, it is unclear what the lineage of these epithelial cells may be. A recent paper discusses bone marrow-derived epithelial cells in the thymus, that first expresses EpCAM and the hematopoietic marker CD45, and then loses its CD45 expression over time after injury15. Research from our lab has also confirmed the presence of CD45+ EpCAM+ cells within healthy blood and bone marrow in the absence of injury12. However, the role of these cells is yet to be determined.
There was a need for a reproducible method to examine epithelial cells within the healthy bone marrow. The method described will help in characterizing these cells further in their normal state. There are important steps in this method to maintain reproducibility. One of the most critical steps in this protocol is maintaining a sterile environment in the hood while harvesting the bone marrow from mice. If harvesting from multiple mice, cross-contamination between samples is avoided by using new needles and syringes for each mouse. This also ensures that the sample is clean and free of any contaminants that might affect the results. In addition, the number of prepared syringes and labeled conical tubes for each additional mouse should be increased. Another important step involves flushing the bones until a clean white color is evident to ensure that most of the bone marrow cells have been removed; the chances of detecting rare cells increases in a purer sample. A modification was made to optimize the red blood cell lysis protocol; several lysis buffers were tested to find the right one that gave consistently high viability, as almost half the cells were being lost during this step. Different reagents and incubation periods may need to be optimized for improved results in other settings.
The most significant limitation of this protocol is using flow cytometry for finding rare cell populations. As discussed previously, the addition of controls and incremental counts helps increase the specificity and accuracy of the analysis. Another limitation is that appropriate markers for the population of interest must be identified in advance. Thus, one needs to know about key markers, antibodies for flow cytometry, and antibodies compatible with the target species.
These methods are an improvement over existing methods as they allow for single cell analysis at a fraction of the cost of the existing automatic CTC isolator and single cell RNA sequencing. Additionally, flow cytometry is more readily available. FACS maintained higher viability for the cells compared with prior reported results using magnetic microbead separation. Lastly, these techniques allow for the separation of cells for downstream analyses, such as bulk RNA sequencing, scRNA sequencing, or cell culture.
Disclosures
Loading...
$$\rightleftharpoonup{xx}$$
$$\longleftharp{xx}$$,
$$\longrightharp{xx}$$,
There are no known conflicts of interest.
Acknowledgements
Loading...
$$\rightleftharpoonup{xx}$$
$$\longleftharp{xx}$$,
$$\longrightharp{xx}$$,
Josh Monts, Core Facility Flow Cytometer Technician, The Hormel Institute
Todd Schuster, Core Facility Manager, The Hormel Institute
Derek Gordon, Statistician, Rutgers University
We would like to thank Karen Klein from Clarus Editorial Services, Santa Fe, NM for her editorial assistance.
This work was supported in part by the National Institute of Arthritis and Musculoskeletal and Skin Diseases of the National Institutes of Health under Award Number R21 AR075281, and a Grant-in-Aid of Research, Artistry and Scholarship, Office of the Vice President for Research, University of Minnesota (Proposal #324240). We gratefully acknowledge support from The Hormel Institute.
Materials
| Name | Company | Catalog Number | Comments |
|---|---|---|---|
| 40 μm Cell Strainer | Falcon | 352340 | Used to filter out any large clumps of cells from bone marrow |
| 5 mL Polystyrene Round-bottom tube | Falcon | 352054 | Tubes used for flow cytometry |
| 500 mL jar with lid | Nalgene | 11-823-32 | Used to wash the mouse |
| 190 proof Ethanol | Decon laboratories Inc | 2801 | Diluted to 70% with dH2O |
| Alexa Fluor 488 Goat anti-rabbit IgG (H+L) | Invitrogen | A11008 | Dilution: 1:1000 |
| Brightline Hemacytometer | Hausser Scientific | 02-671-10 | Used to count alive cells |
| Bovine Serum Albumin | Jackson ImmunoResearch | 001-000-162 | Component of antibody diluent |
| Characterized Fetal Bovine Serum (FBS) | Hyclone | SH30071.03 | Component of staining buffer and harvesting solution |
| Curity gauze sponges | Covidien | 2187 | Used to keep a clean work area when harvesting limbs and bone marrow |
| Curved Forceps | Miltex | 18-784 | Used during harvest |
| Cytokeratin, Wide Spectrum Screening | Dako | Z0622 | Dilution 1:750 *Now discontinued |
| Dulbecco's Phosphate Buffered Saline (DPBS 1x) | Gibco | 14190-144 500mL | Used to stop the red blood cell lysis reaction |
| Ethylenediaminetetraacetic acid | Sigma Aldrich | E9884-100G | Used at 0.5 M |
| Gentamicin sulfate | Lonza | 17-518Z | Component of harvesting solution |
| Hank's Balanced Salt Solution (HBSS 1x) | Gibco | 14175-095 500mL | Component of harvesting solution and staining buffer solution |
| Luer-Lok tip 10 mL syringe | Becton, Dickinson and Co | 309604 | Used with 26G needle to flush bones, used with 20G needle to break up clumps |
| Magic touch 2 ice bucket | BelArt | M16807-2001 | Used to store the specimens on ice |
| Nonfat dry milk | Apex | 20-241 | Component of Antibody Diluent |
| Normal horse serum | Vector | ZE0122 | Component of Antibody Diluent |
| PE anti-human CD 326 (EpCAM) | Biolegend | 324206 | Dilution: 5 µl in 100 µl per 1x10⁶ cells |
| PE anti-mouse CD 326 (EpCAM) | Biolegend | 118205 | Dilution: 3 µl in 100 µl per 1x10⁶ cells |
| PE mouse IgG2b, κ isotype control | Biolegend | 400313 | Dilution: 1 µl in 100 µl per 1x10⁶ cells |
| PE rat anti-human CD49f | BD Biosciences | 555763 | Dilution: 20 µl in 100 µl per 1x10⁶ cells |
| PE rat IgG2am, κ Isotype control | Biolegend | 400508 | Dilution: 1 µl in 100 µl per 1x10⁶ cells |
| Polypropylene Conical Centrifuge Tubes 50 mL | Basix | 14-955-240 | Used in the centrifuge |
| Povidone-Iodine Scrub | Aplicare | 82-227 | Antiseptic used to sterilize the mice |
| PrecisionGlide Needle 20G x 1 1/2 | Becton, Dickinson and Co | 305176 | 20G needle used to break up bone marrow clumps |
| PrecisionGlide Needle 26G x 1/2 | Becton, Dickinson and Co | 305111 | 26G needle used to flush bone marrow from bones |
| PTFE Printed Slides | Electron Microscopy Services | 63422-06 | 8 well slides cells sorted onto for immunofluorescence |
| RBC Lysis buffer 10X | Invitrogen | 00-4300-54 | Dilution 1:10 using sterile deionized water |
| Scissors | Roboz | RS-6762 | Used during harvest |
| Stainless steel surgical blade #4 | Bard-Parker | 371222 | Used during harvest |
| Sterile tray | Polar ware | 10F | Used during harvest |
| StretchEase Powder-free nitrile examination gloves | Denville Scientific | G4161 | Used during harvest |
| Surgical Scalpel handle #4 | Fischer | 12-000-164 | Used with surgical blade |
| TBS 20x | Thermo | Component of TBST, used at 1X | |
| Trypan Blue Stain (0.4%) | Gibco | 15250-061 | Used to count dead cells. Filtered with .45 µm |
| Tween 20 | Sigma Aldrich | P1379-500mL | Component of TBST |
| Tweezers | Miltex | 6-8 | Used during harvest |
| Vectashield Vibrance Antifade Mounting Medium with DAPI | Vector | H-1800 | Nuclear stain for immunofluorescence |
References
Loading...
$$\rightleftharpoonup{xx}$$
$$\longleftharp{xx}$$,
$$\longrightharp{xx}$$,
- Larsen, S. B., Cowley, C. J., Fuchs, E. Epithelial cells: liaisons of immunity. Current Opinion in Immunology. 62, 45-53 (2020).
- Blanpain, C., Fuchs, E. Plasticity of epithelial stem cells in tissue regeneration. Science. 344 (6189), 1242281(2014).
- Coradini, D., Casarsa, C., Oriana, S. Epithelial cell polarity and tumorigenesis: New perspectives for cancer detection and treatment. Acta Pharmacologica Sinica. 32 (5), 552-564 (2011).
- Dmello, C., et al. Multifaceted role of keratins in epithelial cell differentiation and transformation. Journal of Biosciences. 44 (2), 33(2019).
- Poulet, G., Massias, J., Taly, V. Liquid biopsy: General concepts. Acta Cytologica. 63 (6), 449-455 (2019).
- Eslami-S, Z., Cortés-Hernández, L. E., Alix-Panabières, C. Epithelial cell adhesion molecule: an anchor to isolate clinically relevant circulating tumor cells. Cells. 9 (8), 1836(2020).
- Morris, R. J. Circulating tumor cells: quintessential precision oncology presenting challenges for biology. NPJ Precision Oncology. 1 (1), 16(2017).
- Lin, D., et al. Circulating tumor cells: biology and clinical significance. Signal Transduction and Targeted Therapy. 6 (1), 404(2021).
- Spence, M., Adai, S., Landon, T., Richter, G. Few and far between: Tools and strategies for rare-event detection using flow cytometry. BioprobesJournal of Cell Biology. 71, 14-18 (2015).
- Yu, M., Stott, S., Toner, M., Maheswaran, S., Haber, D. A. Circulating tumor cells: approaches to isolation and characterization. Journal of Cell Biology. 192 (3), 373-382 (2011).
- Ye, Q., Ling, S., Zheng, S., Xu, X. Liquid biopsy in hepatocellular carcinoma: circulating tumor cells and circulating tumor DNA. Molecular Cancer. 18 (1), 114(2019).
- Park, H., et al. marrow-derived epithelial cells and hair follicle stem cells contribute to development of chronic cutaneous neoplasms. Nature Communications. 9 (1), 5293(2018).
- Marsman, W. A., et al. Epithelial cells in bone marrow: do they matter. Gut. 54 (12), 1821-1822 (2005).
- Borue, X., et al. marrow-derived cells contribute to epithelial engraftment during wound healing. The American Journal of Pathology. 165 (5), 1767-1772 (2004).
- Chakrabarti, S., et al. marrow-derived cells contribute to the maintenance of thymic stroma including TECs. Journal of Immunology Research. 2022, 6061746(2022).
- Krause, D. S., et al. Multi-organ, multi-lineage engraftment by a single bone marrow-derived stem cell. Cell. 105 (3), 369-377 (2001).
- Wong, A. P., et al. Targeted cell replacement with bone marrow cells for airway epithelial regeneration. American Journal of Physiology-Lung Cellular and Molecular Physiology. 293 (3), L740-L752 (2007).
Reprints and Permissions
Request permission to reuse the text or figures of this JoVE article
Request Permission