This method describes the encapsulation of the rabies antigen into biodegradable polymeric microparticles with structural and material properties that enable pulsatile release after a predetermined delay. Enzyme-linked immunosorbent assay (ELISA) assessment of the antigen retrieved from the particle core confirms the presence of intact trimeric rabies virus glycoprotein through particle fabrication.
Method Article
Fabrication of Pulsatile Polymeric Microparticles Encapsulating Rabies Antigen
* These authors contributed equally
In This Article
Summary
Abstract
The current guidelines for rabies post-exposure prophylaxis require multiple injections administered over several weeks. This can be disproportionately burdensome to those living in low- and middle-income countries (LMICs), where the majority of deadly exposures to rabies occur. Different drug delivery strategies have been explored to condense vaccine regimens to a single injection by encapsulating antigens into polymeric particles. However, harsh stressors during the encapsulation process can cause denaturation of the encapsulated antigen. This article describes a method for encapsulating the rabies virus (RABV) antigen into polymeric microparticles that exhibit tunable pulsatile release. This method, termed Particles Uniformly Liquified and Sealed to Encapsulate Drugs (PULSED), generates microparticles using soft lithography to create inverse polydimethylsiloxane (PDMS) molds from a multi-photon, 3D-printed master mold. Poly(lactic-co-glycolic acid) (PLGA) films are then compression-molded into the PDMS molds to generate open-faced cylinders that are filled with concentrated RABV using a piezoelectric dispensing robot. These microstructures are then sealed by heating the top of the particles, allowing the material to flow and form a continuous, nonporous polymeric barrier. Post-fabrication, an enzyme-linked immunosorbent assay (ELISA) specific to the detection of intact trimeric rabies virus glycoprotein is used to confirm the high recovery of immunogenic antigen from the microparticles.
Introduction
Vaccination is an extremely effective healthcare tool, having prevented more than 37 million deaths between 2000 and 20191. Despite this effectiveness, vaccine-preventable diseases continue to pose a significant risk to global health, especially in low- and middle-income countries (LMICs) where high rates of un- and under-vaccination contribute to 1.5 million vaccine-preventable deaths annually2. Rabies is no exception to these disparities. Despite its status as the most deadly disease known to humankind, being almost universally fatal, rabies is fully treatable and is classified as eradicated in many high-income countries. Instead, the burden of rabies is disproportionately borne by people living in parts of Asia and Africa, where the disease has devastating outcomes on humans and livestock3,4.
Vaccination is critical to managing the global impact of rabies5. The cost of vaccination prohibits widespread implementation of pre-exposure prophylaxis (PrEP), considering the overall low incidence of the disease. Furthermore, in LMICs, the utility of post-exposure prophylaxis (PEP) is limited by socioeconomic pressures on patients seeking healthcare. Logistical factors, such as travel distance to healthcare access points, lost wages while obtaining treatment, the cost of treatment, appointments interfering with daily activities, and forgetfulness, result in PEP adherence rates as low as 60%6,7. This high patient attrition rate presents an opportunity for refining approaches to address gaps in rabies vaccination in order to combat the disease.
Single-injection (SI) vaccination systems that control the release of antigens have been explored as ways to obtain full immunization in one injection. Eliminating the need for multiple visits to a healthcare provider mitigates the burdens that prevent individuals from seeking adequate care. To achieve SI vaccination, an antigen is typically encapsulated within a biodegradable polymeric matrix that often takes the form of injectable microparticles. Once injected, the polymer degrades and releases the sequestered antigen. To date, two primary release strategies have been pursued to achieve SI vaccination. In one approach, the antigen is released continuously over an extended period of time. Although intended to enhance the immunogenicity of a single injection, it is unclear if this approach is sufficient to elicit a protective immune response against the rabies virus (RABV) in humans8. In the other, the antigen is released after a predetermined delay to mimic a conventional and proven prime-boost vaccine regimen. Spray drying and emulsion/solvent evaporation-based microparticle fabrication methods exhibit the former strategy, and have been used to successfully encapsulate both model vaccines9 and highly stable antigens, such as tetanus toxoid10. However, these encapsulation methods involve stressors, including heat, solvent interaction, and physical forces, that can denature antigens11.
Particles Uniformly Liquified and Sealed to Encapsulate Drugs (PULSED) is a recently developed fabrication method that can be employed to encapsulate biologics in biodegradable microparticles. Micromolding is used to generate particles that are filled with a liquid payload and heated to allow the polymer to reflow and fully encapsulate the central depot of cargo within a contiguous layer of the biodegradable polymer. This microstructure results in the pulsatile release of the payload, after a duration that is dependent on the degradation rate of the polymeric shell12. This manuscript demonstrates the encapsulation of inactivated RABV within microparticles composed of poly(lactic-co-glycolic acid) (PLGA), a biodegradable polymer used in many FDA-approved formulations13, using the PULSED fabrication method to encapsulate stable RABV antigen as evaluated by an enzyme-linked immunosorbent assay (ELISA). By combining PLGA particles with different molecular weight and/or end groups, this approach has the potential to mimic the current rabies vaccination time course following a single injection.
Protocol
1. Particle master mold generation
NOTE: The 3D printing process can be performed with any 3D printer with sufficient spatial resolution; however, the current protocol describes the process for a multi-photon 3D printer.
- Design microparticle structures using a computer-aided design (CAD) program.
NOTE: The design specifications are as follows: 308 particles (diameter = 400 µm, height = 500 µm, and wall thickness = 100 µm) are arranged in a 22 by 14 array, with 600 µm of spacing between them. The design also contains a four-pointed star and a five-pointed star as fiducials immediately outside the array (Supplementary Figure 1). - Export the final design as an STL file (Supplementary Coding File 1) and upload the file to software capable of defining the print parameters as shown below. Then, save it as a file compatible with the 3D printer (see Table of Materials).
NOTE: Slicing distance = 5 µm, hatching distance = 1 µm, shell contour = 50 µm, base slice count = 5 µm, scaffolding = hollow, scan mode = galvo, z-axis = microscope z-drive, scan speed = 100,000, power = 100. - Pre-treat a silicon printing substrate (see Table of Materials) using a plasma cleaning process (gas: O2; power: 200 watts; temperature: 25 °C; flow: 20; time: 5 min), then immediately immerse the substrate into a solution of 30 mL of ethanol and 60 µl of 3-(trimethoxysilyl) propyl methacrylate in a glass Petri dish. Cover with aluminum foil and allow to incubate overnight.
NOTE: This step increases print adhesion to the substrate, which is important during PDMS separation (step 2.6). - Upload the print file to the multi-photon 3D printer, apply the print resin to the treated substrate, load the 10x lens (see Table of Materials), and print the microstructures.
- Once finished, submerge the print in propylene glycol methyl ether acetate (see Table of Materials) for 45 min to remove unexposed photoresist, then submerge the print in isopropyl alcohol for 5 min. Post-cure the master mold by exposing it to UV light at 254 nm for 120 min.
NOTE: If available, UV light in the 405 to 365 nm range can be used for ~20 min to post-cure the printed structures.
2. Polydimethylsiloxane (PDMS) mold generation
- Treat the surface of the 3D-printed master mold by placing it in a vacuum chamber containing a glass slide with 40 µL of Trichloro(1H,1H,2H,2H,-perfluorooctyl) (see Table of Materials) silane added to the surface. Pull the vacuum (relative pressure: -20 in.Hg) for 1 h.
NOTE: This step ensures easy separation when demolding (step 2.6). - While the master mold surface is being treated, thoroughly mix the polydimethylsiloxane (PDMS) prepolymer base with the PDMS prepolymer curing agent in a 9:1 ratio by mass (at least 10 g of material is needed for each master mold). Once thoroughly mixed, transfer the uncured PDMS to a 50 mL centrifuge tube and centrifuge at 300 x g for 3 min at room temperature.
- Once surface treatment is complete, place the master mold in an aluminum foil dish and pour the uncured PDMS on top of the mold, ensuring the features are entirely submerged. Place the aluminum foil dish in a vacuum chamber and pull the vacuum (relative pressure: -20 in.Hg) for 1 h to remove air bubbles.
- Remove the aluminum foil dish from the vacuum chamber. Place 800 µm spacers at the ends of the master mold and overlay a clean glass slide onto the master mold, taking care to avoid introducing air bubbles. Use binder clips to clamp the mold and the slide together, localizing the clamping force over the spacers (Supplementary Figure 2).
- Place the structure in an oven set to 120 °C for at least 4 h to cure the prepolymer into PDMS molds.
- Remove the structure from the oven, carefully release the binder clips, and carefully separate the master mold from the cured PDMS mold using a razor blade.
NOTE: The 3D-printed master mold can be reused to generate additional PDMS molds.
3. PLGA film fabrication
- Weigh out 450 mg of PLGA (see Table of Materials) and place it on a 76 mm by 76 mm nonstick polymer sheet within a 250 µm thick ring shim, with an inner diameter of 50.8 mm. Place a second nonstick polymer sheet over the PLGA and compress the stack between two aluminum blocks using a 101.6 mm c-clamp until finger-tight.
NOTE: 502H PLGA was used exclusively in this study; however, other types of PLGA are compatible with this process. - Place the c-clamped assembly in a vacuum oven set to 120 °C for 30 min under vacuum, with a relative pressure of -30 in.Hg. Then, remove the assembly and firmly tighten the clamp before placing it back in the vacuum oven for another 30 min.
NOTE: The primary purpose of using a vacuum is to avoid PLGA degradation, which is accelerated at high temperatures. - Remove the assembly from the oven and allow it to cool for 4 h in a desiccator.
- Once cool, loosen the clamp, remove the PLGA film from the nonstick polymer sheets, and place the film in a labeled Petri dish. Store the Petri dish inside a desiccator for later use.
4. PLGA particle generation
- Treat the surface of the PDMS mold as described previously in step 2.1.
- Using tweezers and/or a scalpel, cut out and place a portion of the 250 µm PLGA film, roughly the size of the array, on the treated PDMS mold.
- Overlay a clean glass microscope slide on top of the PLGA film and PDMS mold and clamp the components together by placing a spring clamp directly over the array and PLGA film.
- Place the clamped mold assembly in the vacuum oven set to 120 °C, and pull the vacuum with a relative pressure of -30 in.Hg for 1 h.
NOTE: The time needed to form the particles depends on the PLGA, and can vary from 1-12 h. - Remove the clamped mold assembly from the oven and let it passively cool at room temperature for approximately 15 min, or until cool to the touch.
- Using a razor blade, gently apply pressure between the PDMS mold and PLGA particle array to separate the two. Store the PLGA particles in a desiccator for future use.
5. Antigen concentration and purification
- Thaw one aliquot of commercially available RABV antigen (see Table of Materials) at room temperature.
- Assemble the filtration setup by placing two centrifugal spin filters with a 100 kDa molecular weight cutoff (MWCO; see Table of Materials) into two collection tubes.
- Prewet the two centrifugal spin filters by adding 500 µL of UltraPure water.
- Spin the filters at 2,400 x g for 1 min in a benchtop centrifuge at room temperature.
- Remove the water from both the top and bottom compartments of the filtration setup using a 200 µL pipette.
NOTE: Do not let the prewetted spin filter dry out. - Add 400 µL of distilled water to the top compartment of each spin filter, then add 100 µL of the thawed RABV antigen and mix with the pipette.
NOTE: This study concentrated the antigen approximately fivefold and reduced the concentration of excipients <100 kDa by ~50-fold. - Load the two centrifugal spin filters into a benchtop centrifuge, ensuring that the filters face the center of the centrifuge. Mark which side of the filter faces toward the center of the centrifuge.
NOTE: If oriented incorrectly, the solutions will not be properly filtered/concentrated. - Centrifuge the filters at 14,000 x g for 10 min at room temperature.
- Retrieve the filters from the centrifuge. The collection tubes will contain the filtrate, while the filters will contain the concentrated sample (Supplementary Figure 3A).
- Remove the filtrate in the collection tubes using a pipette and discard.
- Add 450 µL of filtered distilled water to each filter, and mix the concentrated sample and water by pipetting up and down six times.
- Centrifuge the two spin filters a second time at 14,000 x g for 10 min at room temperature. Ensure the filters face the center of the centrifuge in the same orientation as in step 5.7.
- Retrieve the filter units from the centrifuge and, just as before, remove and discard the filtrate from each tube using a pipette.
- Remove the spin filters from the collection tubes and cap the filter casings using the top of the collection tubes (Supplementary Figure 3B).
- Place the bottom of the spin filter casings directly onto a vortex and vortex at 3,000 rpm for 30 s while holding the filter casings upright and at 45° angles (Supplementary Figure 3C).
NOTE: This step is intended to resuspend any RABV antigen that formed a pellet during the centrifugation process. - Carefully remove the cap of the collection tubes from the spin filter casings. Place the filter casings back in the provided collection tubes and run a quick spin (2-3 s) to collect any volume that may have become trapped in the cap.
NOTE: This quick spin must be performed in a benchtop microcentrifuge. The filters should be tangential to the centrifuge, opposite to the previous configuration, to ensure no solution is lost through the filters. - Invert each spin filter unit into a new collection tube provided with the spin filter kit (see Table of Materials), and centrifuge for 2 min at 1,000 x g at room temperature to collect the concentrated samples.
- Consolidate the concentrated samples from the two collection tubes into one collection tube. Measure and record the resulting volume.
NOTE: The resulting sample will have 5x the initial antigen concentration as the stock, have a small excipient (<100 kDa) concentration approximately 50-fold lower than the stock, and appear slightly milky white. The total volume should be approximately 44-48 µL. - Store the 5x concentrated, twice-washed antigen at 4 °C until the time of dispensing, but for no longer than 16 h. Prior to filling particles with this solution, centrifuge the tube at 1,000 x g for 1 min to remove any bubbles. The solution may be diluted using distilled water to attain the nominal target concentration for dispensing.
6. Particle filling
- Vacuum filter 500 mL of deionized water through a 0.22 µm vacuum filter, then degas the solution by applying a vacuum (relative pressure: -20 in.Hg) while under sonication for 20 min.
- During this time, attach the piezo dispense capillaries (PDCs; see Table of Materials) to the piezoelectric dispenser.
- Prime the machine according to the manufacturer's instructions (see Table of Materials), and place the slide with the PLGA particles into the dispensing area.
- Set up the "Find Target Reference Points", Run, and then set up the "Target Substrate", according to Supplementary Figure 4.
- Load 25 µL of the concentrated antigen into the source plate and load it into the machine. Using the PDCs, aspirate 10 µL of concentrated antigen into the dispensing tip, wash the outside of the tip, then calibrate the dispensing alignment (Supplementary Figure 5).
- Enter "Target Setup parameters" and click on the Run (Supplementary Figure 6).
- Once complete, remove the filled particles and verify they are filled under a stereoscope.
- Move directly to the next step in the protocol.
7. Particle sealing and harvesting
- Place a stainless-steel block (see Table of Materials) on a hotplate. Place two microscope slides on the stainless-steel block so they are parallel. Ensure the stainless-steel block is level, then turn the hotplate on and set the temperature so that the surface temperature of the stainless steel is 200 °C. Verify the temperature of the hotplate before sealing.
- Suspend the filled PLGA particles above the hotplate by placing them on the two glass slides, then immediately start a timer for 18 s.
NOTE: The amount of time and heat particles need to seal will vary depending on the chemical properties of the PLGA used to make the particles. A custom 3D-printed slide holder can be used to handle the slides at a safe distance from the hotplate. The STL file is provided as Supplementary Coding File 2. - Once sealed, remove the particle array from the hotplate and suspend it over the lab bench by placing the particle array on two separate glass slides. Allow the particles to cool for 1 min.
- Once cooled, the particles can be harvested using a scalpel while looking through a stereoscope. Hold the scalpel with the blade at a 45° angle to the slide and apply pressure to the base of the particle to separate it from the glass slide.
- Once harvested, use the scalpel to transfer the particles into 0.5 mL low-protein binding tubes (see Table of Materials). Then, fill the tubes with 250 µL of a 1x phosphate buffer solution (PBS) containing 30 mg/mL bovine serum albumin (BSA) and 1 mg/mL glucose.
NOTE: The 30 mg/mL BSA and 1 mg/mL glucose solution prepared in PBS will maintain the stability of the RABV antigen. - Crush the particles under a stereoscope using a pair of fine-tip tweezers. Ensure the RABV antigen in the core of the particle is available to be dissolved in the surrounding solution. Store the samples in a 4 °C refrigerator until antigen potency can be evaluated using an ELISA. Samples must be run on an ELSIA within 7 days of preparation.
8. Evaluating the antigen by ELISA
CAUTION: Do not let the microplates dry out at any point. Always stack plates, and always cover the upper plate with a plastic seal, an empty plate, or a lid to avoid drying out.
- Prepare the buffers as instructed in Supplementary File 1.
- Prepare 5 mL of coating solution (carbonate-bicarbonate buffer, pH 9.6) at a concentration of 2.5 µg/mL by adding 25 µL of the coating antibody to 4975 µL of coating buffer at pH 9.4-9.6.
NOTE: 5 mL is needed to coat 96 wells with 50 µL each (with extra volume for pipetting loss). Increase the total volume by 5 mL for each additional ELISA plate needed. - Use a multichannel pipette to dispense 50 µL of the coating solution into each well of the microplate. The solution must be used for coating immediately after it is prepared.
- Gently tap along the plate edges on a gloved palm to ensure the bottom of each well is evenly covered with liquid.
- Seal the plate with adhesive film and place it at 37 °C for 1 h, then transfer to 4 °C overnight.
- Retrieve the plates from cold storage and wash them three times with 200 µL of wash buffer in each well.
- Remove the wash buffer and dispense 300 µL of blocking buffer into each well.
CAUTION: When running multiple plates with the same samples repeated on different plates, it is important to proceed plate-by-plate (i.e., fill plate 1 with the material before proceeding to plate 2, and then to plate 3 and so on). Do not apply material X to all plates and then material Y, etc., as this would increase the risk of wells drying out. After the final wash step, the wash buffer should remain in the wells of the plate and only be discarded immediately before adding samples to the plate. A plastic 96-well plate lid needs to be used to cover all wells of the ELISA plate that are not being dispensed into straight away, and the lid sequentially moved to reveal additional wells to be filled with material. - Seal the plates with an adhesive plastic film (see Table of Materials) and place them in an incubator for 60 ± 5 min at 37 ± 2 °C.
- Prepare the standard curve and test samples to be evaluated during this incubation.
NOTE: The antigen being evaluated must be pre-diluted in diluent buffer at a recommended dilution of 0.125 IU/mL, with an excess volume of at least 40 µL to account for pipetting loss. All the samples are evaluated in duplicate (two technical replicates) on each ELISA plate. For the standard curve, a twofold dilution series for a total of eight points should be included in columns 2 and 3 of each ELISA plate. A dilution series may be performed for all other samples with an appropriate number of points based on the predicted amount of antigen being evaluated. Although less rigorous for higher throughput, a single sample dilution can be used as an alternative to the plating described above. However, the expected concentration of a single dilution must fall within the standard curve range. - In low-bind protein 96-well plates, or low-bind protein tubes (see Table of Materials), perform a twofold dilution series of each sample along the columns of the plate.
- Load the start of the dilution series in row A for each respective sample at double the final volume required (per plate, 100 µL of sample is required per well, so all wells in A2-A11 should contain at least 240 µL of a sample, with an extra volume of 40 µL to account for pipetting loss).
- Load 120 µL of diluent buffer into all other wells on the low-bind protein plate, excluding columns 1 and 12 (i.e., B2 through H11).
- Using a multichannel pipette loaded with 10 tips, perform serial dilution by transferring 120 µL of sample from A2-A11 to B2-B11 and pipetting up and down several times to mix while avoiding splashing and bubbles. Repeat this process, moving down the plate along the columns until wells H2-H11. Discard the remaining 120 µL volume aspirated from the final row of wells.
NOTE: The samples are now ready for analysis. If the blocking phase is not complete by this time, ensure the samples are kept on ice. - At the end of the incubation step, wash the plates three times with 200 µL of wash buffer.
- Using a multichannel pipette, transfer 100 µL of diluent buffer into columns 1 and 12 as the "blanks".
- Using a multichannel pipette, transfer 100 µL from each well of the low-bind protein 96-well plate containing sample dilutions to the washed ELISA plate. Repeat for all ELISA plates being run.
- Seal the plates with an adhesive plastic film and place them in an incubator for 60 ± 5 min at 37 ± 2 °C.
- Prepare the detection antibody solution (see Table of Materials) at a concentration of 0.2 µg/mL by adding 4.4 µL of the antibody solution to 10,995.6 µL of the diluent buffer and mix well by pipetting up and down.
NOTE: A total of 11 mL is needed for 96 wells at 100 µL each (with extra volume for pipetting losses). Increase the total volume by 11 mL for each additional ELISA plate being evaluated. The solution must be used immediately following preparation. - At the end of the incubation step, wash the plates five times with 200 µL of wash buffer.
- Aspirate the remaining wash buffer and dispense 100 µL of the detection antibody solution into each well on the microplate using a multichannel pipette.
- Seal the plates with an adhesive plastic film and place them in an incubator for 60 ± 5 min at 37 ± 2 °C.
- Prepare the conjugate toward the end of the detection antibody incubation step by adding 4.4 µL of streptavidin-peroxidase conjugate solution (see Table of Materials) to 10,995.6 µL of wash buffer.
NOTE: A total of 11 mL is needed for 96 wells at 100 µL each (with extra volume for multichannel pipetting). Increase the total volume by 11 mL for each additional ELISA plate being evaluated. - Wash the plates five times with 200 µL of wash buffer.
- Aspirate the remaining wash buffer and dispense 100 µL of the conjugate solution to each well.
- Seal the plates with an adhesive plastic film and place them in a 37 °C incubator for 60 ± 5 min at 37 ± 2 °C.
- Prepare the substrate during the final wash step according to the manufacturer's instructions (see Table of Materials). For each plate, dissolve one tablet of o-phenylenediamine dihydrochloride (OPD; see Table of Materials) in 9 mL of deionized water in the dark, then top up with 1 mL of 10x stable peroxide buffer. Adjust the number of tablets and total volume of solution (10 mL) according to the number of plates being evaluated.
- Wash the plates five times with 200 µL of wash buffer.
- Dispense 100 µL of the substrate to each well using a multichannel pipette.
- Seal the plates with an adhesive plastic film and leave them on the bench for 10-20 min, protected from light, using aluminum foil.
NOTE: Monitor color development visually to avoid saturation. - Add 50 µL of stop solution to each well and the read plate immediately for absorbance at 492 nm and a reference absorbance of 620 nm.
- Analyze the data using the corrected absorbance reading (reading at 492 nm minus the reading at 620 nm) and subtract the average of the blank from all samples. Use a sigmoidal 4PL interpolation method to convert absorbance values to IU/mL. Finally, multiply by the 250 µL (total sample volume) to convert to IU.
NOTE: This analysis can be done using data analysis software.
Results
Particle sealing and filling are two of the most critical steps in this protocol. Particles were filled with fluorescein sodium salt to demonstrate ideal filling and some common errors. Fluorescein sodium salt was used in lieu of the RABV antigen for ease of visualization. During filling, it is important to dispense solution into the bottom of particle cores, then allow enough time for the solvent/water to evaporate. Once complete, a depot of the solute remains in the bottom of the particle core (Figure 1A). Once filled, it is critical to seal the particles correctly. Figure 1B demonstrates several outcomes (successful and unsuccessful) of the sealing process. After 12 s of sealing time, a distinct pathway remains from the particle center to the outside of the particle, demonstrating a particle that is not entirely sealed. Conversely, if left to seal for 36 s, the PLGA almost entirely melts, resulting in a microstructure with a shallow profile. The Ideal morphology can be visualized when particles are sealed for 18 and 24 s, as they contain cargo entirely encapsulated by the polymer while maintaining a particle structure. Figure 1C demonstrates several potential outcomes after filling and sealing. During dispensing, if the solvent does not reach the particle bottom, it leaves solute dried in the middle of the particle core (incorrectly filled); although these particles may still seal, the poor loading of cargo can limit loading efficiency. If particles are filled with too much cargo (overfilled), the sealing process is inhibited, as the cargo prevents PLGA from flowing over the opening. When correctly filled and sealed, particles of this geometry are small enough to fit easily inside a 19 G needle. Further, 10 particles consistently flowed through a 19 G needle (100% ± 0%) when injected with a viscous solution such as 2% carboxymethyl cellulose (Supplementary Figure 7).
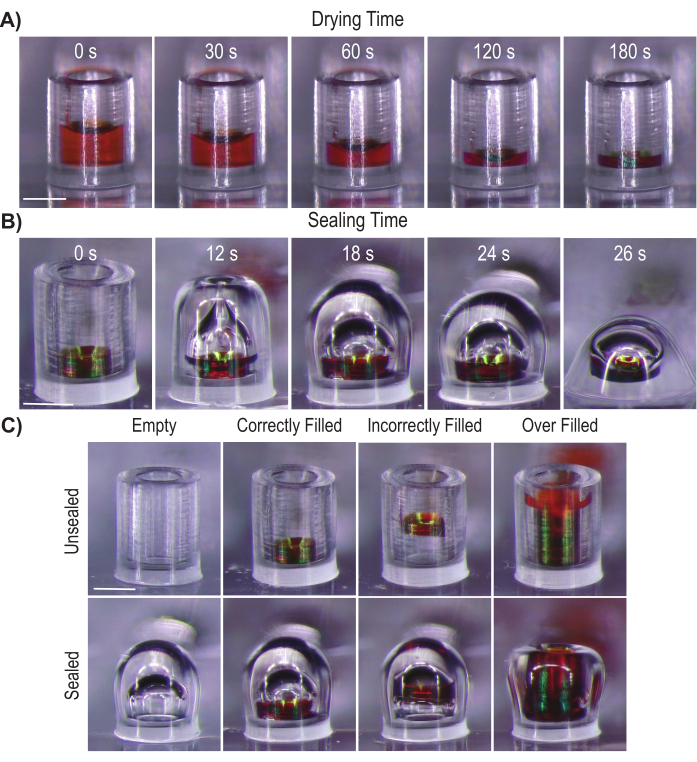
Figure 1: Common problems with the filling and sealing process. (A) Images show the evaporation of solvent after one filling cycle, where particles are loaded with 6 nL of 100 mg/mL fluorescein sodium salt dissolved in water. (B) Representative images of 502H PLGA particles removed from the sealing process at 0, 12, 18, 24, and 36 s. (C) Different outcomes of the sealing process when particles are filled correctly, incorrectly, or overfilled. Images are generated by focus stacking multiple images and merging them using focus stacking software. Scale bar = 200 µm. Please click here to view a larger version of this figure.
Processing the antigen through a spin filter prior to loading it into the particles is important for two reasons. First, the centrifugation serves to remove stock excipients in the vaccine solution, that can limit particle loading capacity while retaining the RABV antigen. The current protocol purifies the antigen by approximately 50-fold. Second, the antigen is also concentrated during this process. Figure 2A shows a micrograph of intact RABV virions in the concentrated antigen sample. This antigen is approximately 4.4-fold more concentrated than the starting stock solution (Figure 2B). The amount of antigen initially loaded into the centrifugal spin filters can be altered to modulate the final fold concentration achieved. For example, loading 40 µL of stock antigen results in an approximate 1.75-fold concentration. Supplementary Figure 8 demonstrates the importance of vortexing (step 5.15) in the concentration process. Neglecting to vortex or improperly vortexing the samples limits the concentration process.
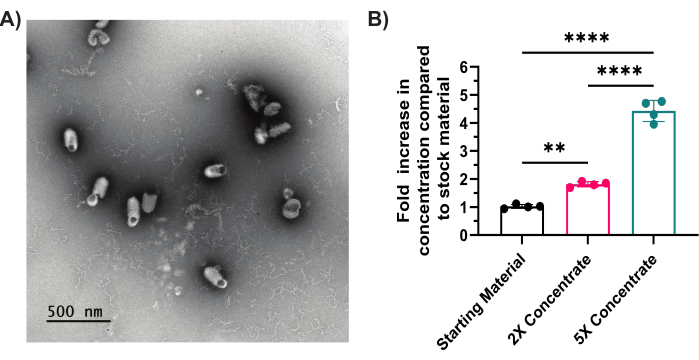
Figure 2: Antigen concentration. The concentration of antigen by centrifugal filtration shown by transmission electron microscopy (A) and confirmed by ELISA (B). Error bars indicate the standard deviation. Statistical analysis is done using Tukey's multiple comparison tests with one-way ANOVA. **p < 0.01, ****p < 0.0001. Please click here to view a larger version of this figure.
Figure 3A depicts concentrated antigen filled into unsealed and sealed particles. Although a significant amount of antigen is loaded into the particles (0.0469 ± 0.0086 IU), this material comprises <90% of the particle capacity, leaving ample space for the loading of additional antigen. Interestingly, unsealed particles only contain 0.0396 ± 0.0077 IU, comprising only 85% ± 16% of the total amount loaded. Although a statistically insignificant loss, some of the RABV antigen may have denatured during repeated rehydration and drying in the filling process. After sealing, 69% ± 5% of the antigen remains encapsulated in a bioactive form. Although this suggests significant loss occurs during the sealing process due to thermal stress, most of the inactivated viral antigen remains intact (Figure 3B). Co-encapsulation of stabilizing excipients along with the antigen is one possible strategy to further increase antigen stability throughout the fabrication process, and has previously been successful with other inactivated virus antigens14,15.
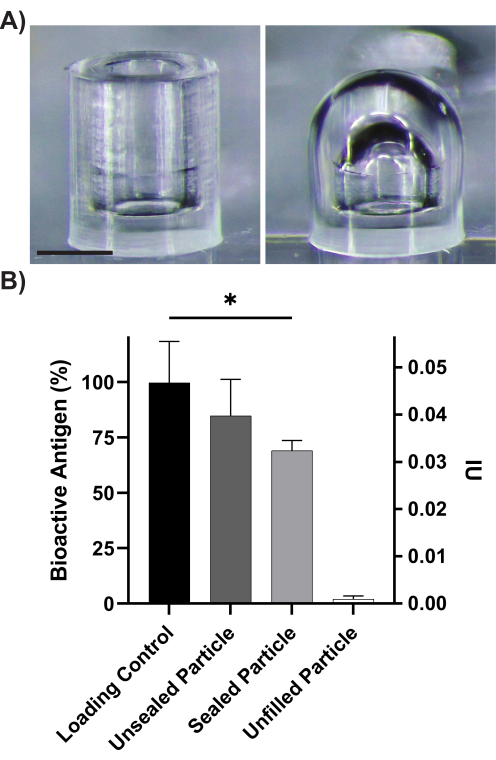
Figure 3: Bioactive RABV antigen after particle fabrication. (A) Images show unsealed and sealed particles containing the RABV antigen. (B) Antigen stability through the particle fabrication process (n = 4). Loading control is generated by dispensing the antigen directly into the solution. Error bars indicate the standard deviation. Scale bar = 200 µm. Statistical analysis is done using Tukey's multiple comparison tests with one-way ANOVA. *p < 0.05. Images are generated by focus stacking multiple images and merging them using focus stacking software. Please click here to view a larger version of this figure.
Supplementary Figure 1: Particle, fiducial, and array dimensions. The figure shows the geometric properties of the four-pointed star fiducial (A), the cylindrical microparticle (B), the five-pointed star fiducial (C), and an array of particles with fiducials (D) displayed in the CAD software. Please click here to download this File.
Supplementary Figure 2: This figure shows a cross-section of the structure placed into the oven to cure PDMS molds. Arrows indicate where binder clamps are applied. Please click here to download this File.
Supplementary Figure 3: Proper technique to efficiently recover concentrated antigen. At the end of the first spin, the concentrated sample circled in red (A) is retained in the filter, while the filtrate is collected in the bottom of the collection tube (larger outer tube). To resuspend the pelleted antigen, the centrifugal filter unit is capped using the collection tube (B) in preparation for vortexing. When vortexing, the tip of the tube is kept in contact with the vortex pad and the cap end rotated around while maintaining a 45° angle with the vortex pad (C). Please click here to download this File.
Supplementary Figure 4: Pre-run programming piezoelectric dispenser. (A) Set up the "Find Target Reference Points" by navigating from the "Main tab" to the Robot Setup > Miscellaneous >Div. Function > Find Target Reference Points. Use the buttons highlighted in blue to set the fiduciary marks. First, select Learn Template and draw a box around the fiduciary mark of interest, the verify the template accuracy by clicking on Search Template, and save the template. Do this for the four- and five-pointed stars, and save the file names according to the instructions under Use Two Different Template Images. Next, ensure all the parameters in the black boxes match. Load the four-pointed star fiducial using the Load Template (green box). Save the "Find Target Reference Points" program by selecting Task List (orange box). (B) Set up the Run by navigating to the Robot Setup > Tasks tab, then load the sequence of tasks shown in the blue box by adding tasks from the Task List (black box) using the Task in Run selections (green box). Finally, save the task (orange box). (C) Set up the "Target Substrate" by navigating to the Robot Setup > Target Substrate, then add a target (blue box). (D) Enter the parameters shown here and select Save (blue box). Please click here to download this File.
Supplementary Figure 5: Loading antigen and calibrating dispending alignment. (A) Navigate to the Nozzle Setup > Do Task tab and aspirate 10 µL of the antigen into the dispensing tip by selecting TakeProbe10 uL (black box) and clicking on DO (black box). (B) This opens a separate window. Select the well the concentrated antigen was loaded into and select OK (blue box). (C) After the antigen has been aspirated, wash the tip by selecting the blue box, and repeat this wash two more times. Select the camera (black box) and determine the drop volume by selecting drop volume (green box). Ensure a stable drop is forming with a volume standard deviation (%) <2 (orange box). (D) Following these steps will open up the Snap Drop Cam; select Image (blue box) in the drop-down menu and select Nozzle Head Camera Wizard. This opens a new window. Perform the next sequence of steps quickly. (E) Ensure the target made in Supplementary Figure 4 is loaded, then select Move To Target (blue box). Adjust the drops to 15 and select Spot (black box). Once spotted, immediately select Move (green box). Ensure Auto Find is selected and delete particle size = 12, then click on Start (orange boxes). If the auto-detection fails, repeat this process after moving to a different area on the slide (purple box). Please click here to download this File.
Supplementary Figure 6: Programing spotting array and beginning the run. (A) Navigate to the Target Setup > Target, then fill in the parameters shown in the blue box. (B) Next, navigate to the "Field Setup tab" and enter 20 into the no. of drops field (blue box), select a well (black box), then select targets/particles to dispense into (green box). By selecting a different well and reselecting the targets/particles, additional filling cycles are performed during a single run. (C) On the main screen, ensure the run and target created in Supplementary Figure 5 are selected. (D) Navigate to the "Run tab" and select Start Run (blue box). Please click here to download this File.
Supplementary Figure 7: Microparticle injectability. (A-C) Focus-stacked stereoscope images of microparticles filled with fluorescein sodium salt and sealed in a 19 G needle. (D) A total of 10 particles were injected through a 19 G needle using a 2% carboxymethyl cellulose solution (n = 8). Scale bar = 1 mm. Error bars indicate standard deviation. Please click here to download this File.
Supplementary Figure 8: Potential issues with antigen concentration. The red line indicates the expected fold increase in concentration. Error bars indicate standard deviation. Statistical analysis was done using Tukey's multiple comparison tests with one-way ANOVA. *** p < 0.001, ****p < 0.0001. Please click here to download this File.
Supplementary File 1: Preparation of buffers and solutions for RABV ELISA. Please click here to download this File.
Supplementary Coding File 1: STL file containing particle array. Please click here to download this File.
Supplementary Coding File 2: STL file containing geometry for the custom slide holder used for sealing particles. Please click here to download this File.
Discussion
It is possible to alter particle geometry for specific needs; however, for cylindrical structures, the authors recommend maintaining a 5:4:1 ratio of the height:diameter:wall thickness described in the protocol. This aspect ratio ensures that enough PLGA material is present to seal the particles and remain mechanically robust enough for handling. Particle dimensions and shapes can easily be altered during the CAD process, enabling a myriad of geometries to be generated. Combining the flexibility of the CAD with 3D printing enables the rapid iteration of microparticle designs. Although this protocol uses a multi-photon 3D printer, any 3D printer with specifications capable of printing the microstructure dimensions in an appropriate material can be used to generate the initial master mold. Further, photolithography has previously been used to make similar structures in arrays much larger than those produced in this protocol; however, the labor, delay of ordering custom-made photomasks, and equipment accessibility would slow the iterative design process16. Finally, master mold generation can be outsourced to fee-for-service companies if in-house master mold fabrication is not feasible. Regardless of the 3D printer or method used to generate the master molds, the adhesion of the print to the substrate is critical for downstream steps. Specifically, if adhesion is inadequate during PDMS mold generation, printed particles will remain lodged in the PDMS mold, requiring manual removal of the printed particles and destruction of the master mold.
Particle filling is another critical aspect to consider. Microparticles have limited filling capacities, so filtration is used not only to concentrate the RABV antigen but also to remove stock excipients that would otherwise occupy a large portion of the microparticle core volume. However, given the large size of the RABV antigen (approximately 60 nm by 180 nm)17, it is possible to partially pellet out the antigen during the centrifugation steps. For this reason, it is important to resuspend the antigen by pipetting or vortexing after centrifugation to achieve a high recovery of the RABV antigen. A highly concentrated solution is ideal for dispensing, because it reduces the dispensing cycles and thereby limits antigen degradation during filling. However, viscosity is a major limitation of piezoelectric dispensing robots forming a stable drop, so dispensing a very high-concentration solution may not be possible or advisable. Diluting the filling solution is the easiest way to achieve a stable drop formation, but antigen stability over the additional filling cycles needed to achieve the desired loading and the longer amount of time required to fill particles should be considered.
Limitations
This method requires highly specialized equipment to produce the initial molds and a specialized filling instrument for microparticle production. Although the need for a 3D printer with a printing resolution capable of generating the initial master molds can be subverted by a fee-for-service approach, accessibility to a piezoelectric dispensing robot is limiting. Procurement of a piezoelectric dispensing robot requires a significant initial upfront investment, often in the range of $80,000 to $200,000, depending on the brand, throughput, and capabilities. Although several other filling methods are potential alternatives, these methods have not been validated using the RABV antigen12.
Future applications
A substantial proportion of encapsulated RABV antigen remained stable through the sealing process. In theory, by incorporating this antigen into particles composed of different types of PLGA that mimic the administration timeline of post-exposure prophylaxis treatment, all doses could be administered in a single injection. Eliminating the need for repeat hospital visits to administer additional doses will enhance patient compliance, resulting in better treatment outcomes. Further, having demonstrated the ability to retain the ELISA-reactivity of the highly complex inactivated rabies virus, it is likely that other antigens, including subunit vaccines, would be compatible with this encapsulation method. Using other prophylactic antigens with PULSED microparticles could save millions of lives in LMICs by increasing the vaccination rates of under-vaccinated populations. To accomplish this, however, vaccines must remain stable through not only encapsulation but also release, which may be challenging since the payload will be subjected to elevated temperatures and a potentially acidic microenvironment due to body heat and PLGA degradation products18. Future work will pursue stabilizing strategies of the antigen through release, which would open up the potential for a single-injection vaccination platform that is broadly applicable to prevent many infectious diseases.
Disclosures
Dr. McHugh has a patent filed based on the encompassed work and is currently a consultant for Particles for Humanity. Mr. Graf has a patent filed based on the encompassed work. Dr. Kadasia, Mr. Yang, and Ms. Brady are part of Particles for Humanity, a public benefit corporation that licensed a similar microparticle vaccine delivery technology from MIT during this work.
Acknowledgements
We thank Chiron Behring and Bharat Biotech International for providing Particles for Humanity with the RABV antigen. We would also like to acknowledge Charles Rupprecht, VMD, MS, PhD., for his invaluable guidance and technical contributions. The authors would like to thank the generosity of Dr. Rebecca Richards-Kortum for allowing the use of her SciFLEXARRAYER S3 picoliter dispensing apparatus and Dr. Chelsey Smith's instruction on using the device. We also acknowledge the University of Massachusetts Chan Medical School for generating microscopy images of the rabies antigen. Finally, we thank Don Chickering and Erin Euliano for reviewing the document before submission. This work was supported by a grant (INV-004360) from the Bill and Melinda Gates Foundation.
Materials
| Name | Company | Catalog Number | Comments |
|---|---|---|---|
| 0.22 µm PES filter | Cole-Parmer+B4B2:B63 | 04396-26 | |
| 0.25 mm Shims | McMaster Carr | 98090A935 | |
| 0.75 inch Binder Clips | Staples | 480114 | |
| 10 mL Syringe | Becton, Dickinson and Company | 309604 | |
| 10 mL Sterile Polystyrene Disposable Serological Pipets with Magnifier Stripe | Fisherbrand | 13-678-11E | |
| 101.6 mm C-Clamp | Amazon | PT-SD-CP01A | Black handle will eventually fall off. Use pliers to adjust once this happens. |
| 19 G needle | EXCELINT | 26438 | |
| 25 mL Sterile Polystyrene Disposable Serological Pipets with Magnifier Stripe | Fisherbrand | 13-678-11 | |
| 3-(Trimethoxysilyl) Propyl Methacrylate | Millipore Sigma | M6514-25ML | |
| 5 mL Sterile Polystyrene Disposable Serological Pipets with Magnifier Stripe | Eppendorf | 22431081 | |
| 50 mL Centrifuge Tubes | Corning | 352098 | |
| 50 mL Sterile Polystyrene Disposable Serological Pipets with Magnifier Stripe | Fisherbrand | 13-678-11F | |
| Acetone | Fisher | AC268310010 | |
| Aluminum Block | McMaster Carr | 9057K175 | |
| Aluminum Foil | VWR | 89079-069 | |
| Amicon Ultra 0.5 mL Centrifugal Filters, 100 kDa | Millipore Sigma | C82301 | |
| Anti-Rabies Virus Antibody, Serum Free Antibody, clone 1112-1, 100 | Fisherbrand | 13-678-11D | |
| Anti-Rabies Virus Mouse Monoclonal Antibody, Clone D1-25, biotinylated | Fisherbrand | 14-388-100 | |
| Carboxymethyl Cellulose | Tokyo Chemical Industries | C0045 | |
| ClipTip 300, Filter, Racked | Fisherbrand | 13-678-11 | |
| Costar 0.65 mL Low Binding Snap Cap Microcentrifuge Tube | Corning | 3206 | |
| Costar 1.7 mL Low Binding Snap Cap Microcentrifuge Tube | Corning | 3207 | |
| Describe | Nanoscribe | Software used to define the printing parameters for Nanoscribe 3D printer is step 1.2. Software provided with the printer. | |
| Desiccator | Fisher Scientific | 10529901 | Or equivalent |
| Double-Sided Tape | Staples | 649280 | |
| DPBS (10x), No Calcium, No Magnesium | Gibco | 14200075 | |
| Ethanol | VWR | 89370-084 | |
| F1-ClipTip Multichannel Pipettes, 30 to 300 µL | Fisherbrand | 13-678-11E | |
| Fisherbrand SureOne Aerosol Barrier Pipette Tips, 0.1 – 10 µL | Fisherbrand | 13-678-11F | |
| Fisherbrand SureOne Aerosol Barrier Pipette Tips, 100 – 1000 µL | Fisherbrand | 03-448-17 | |
| Fisherbrand SureOne Aerosol Barrier Pipette Tips, 2 – 20 µL | Fisherbrand | FB14955202 | |
| Fisherbrand SureOne Aerosol Barrier Pipette Tips, 20 – 200 µL | Fisherbrand | 13-374-10 | |
| Fisherbrand Elite Pipette Kit | Fisherbrand | 05-408-137 | |
| Fisherbrand Pipet Controller | Fisherbrand | FB14955202 | |
| Glass Petri Dish, 90 mm | VWR | 470313-346 | |
| Glass Slides | Globe Scientific | 1380-10 | |
| Helicon Focus 8 | HeliconSoft | Software used to focus stack images | |
| IP-Q Resin | Nanoscribe | Printer resin is compatable with the 10x lens and is used for printing large microstructures on the Nanoscribe Photonic Professional GT2 | |
| Lascar EL-USB-TC-LCD Thermocouple | Amazon | 5053485896236 | Or equivalent |
| Microscope Slide Box | Millipore Sigma | Z374385-1EA | Or equivalent |
| Nanoscribe Photonic Professional GT2 with 10X Objective | Nanoscribe | ||
| NanoWrite | Nanoscribe | Software used to interface with nanoscrive 3D printer. Software provided with printer. | |
| Nunc MaxiSorp Flat-Bottom 96-well Plate | Invitrogen | 44-2404-21 | |
| OPD Substrate Tablets (o-Phenylenediamine Dihydrochloride) | Fisherbrand | 02-707-432 | |
| Parafilm M Wrapping Film, 4 in. | Fisherbrand | 13-374-10 | |
| PDC 60 with Type 3 Coating | Scienion | P-2020 | |
| PDMS Particle Molds | Rice University | n/a | N/A- Particles are 400 μm in diameter with a wall thickness of 100 μm, and a height of 500 μm, resulting in an inner diameter of 200 μm. The arrays are 14 x 22 particles spaced 600 μm apart from each other. 4- and 5-point stars are used as fiducials, positioned 600 μm to the right and left of the top right and top left particles on the array. |
| Petri Dish | Fisher Scientific | 08-757-100D | |
| Pierce Stable Peroxide Substrate Buffer (10x) | Fisherbrand | 02-707-430 | |
| Plastic Cups | Fisher Scientific | S04170 | |
| PLGA Film, 502H | Sigma | 502H: 719897-1G | |
| Propylene Glycol Monomethyl Ether Acetate | Millipore Sigma | 484431 | |
| Rabies Antigen | Chiron Behring and Bharat Biotech International | Material was acquired by entering into a materials transfer agreement with the company. | |
| Razor Blades | VWR | 55411-050 | |
| Scalpel | VWR | 21899-530 and 76457-512 | |
| SciFLEXARRAYER S3 with PCD 60 | Scienion | Or equivalent | |
| Sealing Tape for 96-Well Plates | Thermo Scientific | 15036 | |
| Silicon Wafer | University Wafer | 1025 | |
| Spring Clamps | IRWIN | VGP58100 | |
| Stainless Steel Block | McMaster Carr | 9083K12 | |
| Streptavidin−Peroxidase Polymer, Ultrasensitive | Fisherbrand | 02-707-404 | |
| Sylgard 184 | DOW | 2646340 | |
| Teflon Sheet | McMaster Carr | 9266K12 | Used to make PLGA films. Must be cut into appropriately sized pieces. |
| Teflon Sheet, 0.8 mm-thick | McMaster Carr | 9266K81 | |
| Trichloro(1H, 1H, 2H, 2H-Perfluorooctyl) Silane | Sigma | 448931-10G | |
| Tweezers | Pixnor | ESD-16 | |
| UltraPure Distilled Water | Fisher Scientific | 10977015 | |
| UV Oven, CL-1000S UV Crosslinker | UVP | 95-0174-01 | Or equivalent |
| Vacuum Desiccator | Bel-Art | F420100000 | Note you will need two of these. One will be used exclusively to pre-treat samples with trichloro(1H, 1H, 2H, 2H-perfluorooctyl) silane to prevent contamination. |
| Vacuum Oven Capable of Reaching 120 °C | VWR | 97027-664 | Or equivalent |
| Vacuum, CRVpro4 | Welch | 3041-01 | Or equivalent |
| Wooden Tongue Depressors | Electron Microscopy Sciences | 72320 |
References
- Li, X. Estimating the health impact of vaccination against ten pathogens in 98 low-income and middle-income countries from 2000 to 2030: a modelling study. The Lancet. 397, 398-408 (2021).
- Euliano, E. M., Sklavounos, A. A., Wheeler, A. R., McHugh, K. J. Translating diagnostics and drug delivery technologies to low-resource settings. Science Translational Medicine. 14 (666), eabm1732(2022).
- Haider, S. Rabies: old disease, new challenges. Canadian Medical Association Journal. 178 (5), 562-563 (2008).
- Fisher, C. R., Streicker, D. G., Schnell, M. J. The spread and evolution of rabies virus: conquering new frontiers. Nature Reviews Microbiology. 16 (4), 241-255 (2018).
- Nagarajan, T., Rupprecht, C. E. Rabies and Rabies Vaccines. , Springer International Publishing. (2020).
- Shi, T., Dunham, E. F., Nyland, J. E. Rabies vaccination compliance and reasons for incompletion. The Western Journal of Emergency Medicine. 21 (4), 918-923 (2020).
- Shankaraiah, R. H., Rajashekar, R. A., Veena, V., Hanumanthaiah, A. N. D. Compliance to anti-rabies vaccination in post-exposure prophylaxis. Indian Journal of Public Health. 59 (1), 58-60 (2015).
- Cleland, J. L. Single-administration vaccines: controlled-release technology to mimic repeated immunizations. Trends in Biotechnology. 17 (1), 25-29 (1999).
- Yeh, M. K., Coombes, A. G. A., Jenkins, P. G., Davis, S. S. A novel emulsification-solvent extraction technique for production of protein loaded biodegradable microparticles for vaccine and drug delivery. Journal of Controlled Release. 33 (3), 437-445 (1995).
- Peyre, M., Sesardic, D., Merkle, H. P., Gander, B., Johansen, P. An experimental divalent vaccine based on biodegradable microspheres induces protective immunity against tetanus and diphtheria. Journal of Pharmaceutical Sciences. 92 (5), 957-966 (2003).
- Mvan de Weert, M., Hennink, W. E., Jiskoot, W. Protein instability in poly(lactic-co-glycolic acid) microparticles. Pharmaceutical Research. 17 (10), 1159-1167 (2000).
- Graf, T. P., et al. A scalable platform for fabricating biodegradable microparticles with pulsatile drug release. Advanced Materials. , https://doi.org/10.1002/adma.202300228 e2300228 (2023).
- Wang, Y., Qin, B., Xia, G., Choi, S. H. FDA's poly (lactic-co-glycolic acid) research program and regulatory outcomes. The American Association of Pharmaceutical Scientists Journal. 23 (4), 92(2021).
- Wan, Y. Development of stabilizing formulations of a trivalent inactivated poliovirus vaccine in a dried state for delivery in the NanopatchTM microprojection array. Journal of Pharmaceutical Sciences. 107 (6), 1540-1551 (2018).
- Smith, T. G., Siirin, M., Wu, X., Hanlon, C. A., Bronshtein, V. Rabies vaccine preserved by vaporization is thermostable and immunogenic. Vaccine. 33 (19), 2203-2206 (2015).
- McHugh, K. J. Fabrication of fillable microparticles and other complex 3D microstructures. Science. 357 (6356), 1138-1142 (2017).
- Sanchez, M. E. N. Rabies vaccine characterization by nanoparticle tracking analysis. Scientific Reports. 10 (1), 8149(2020).
- Fu, K., Pack, D. W., Klibanov, A. M., Langer, R. Visual evidence of acidic environment within degrading poly(lactic-co-glycolic acid) (PLGA) microspheres. Pharmaceutical Research. 17 (1), 100-106 (2000).
Reprints and Permissions
