We describe a protocol to isolate murine small intestinal crypts and culture intestinal 3D organoids from the crypts. Additionally, we describe a method to generate organoids from a single intestinal stem cell in the absence of a sub-epithelial cellular niche.
Method Article
The 3D Culturing of Organoids from Murine Intestinal Crypts and a Single Stem Cell for Organoid Research
In This Article
Summary
Abstract
At present, organoid culture represents an important tool for in vitro studies of different biological aspects and diseases in different organs. Murine small intestinal crypts can form organoids that mimic the intestinal epithelium when cultured in a 3D extracellular matrix. The organoids are composed of all cell types that fulfill various intestinal homeostatic functions. These include Paneth cells, enteroendocrine cells, enterocytes, goblet cells, and tuft cells. Well-characterized molecules are added into the culture medium to enrich the intestinal stem cells (ISCs) labeled with leucine-rich repeats containing G protein-coupled receptor 5 and are used to drive differentiation down specific lineages; these molecules include epidermal growth factor, Noggin (a bone morphogenetic protein), and R-spondin 1. Additionally, a protocol to generate organoids from a single erythropoietin-producing hepatocellular receptor B2 (EphB2)-positive ISC is also detailed. In this methods article, techniques to isolate small intestinal crypts and a single ISC from tissues and ensure the efficient establishment of organoids are described.
Introduction
Intestinal organoids, which were first established in 2009, have emerged as a powerful in vitro tool for studying intestinal biology given their morphological and functional similarity to mature tissues. Recently, technological advances in cultured organoids derived from adult-tissue stem cells have allowed for the long-term culture of intestinal stem cells (ISCs) with self-renewal and differentiation potential. These organoids have been widely used for basic and translational research studies on gastrointestinal physiology and pathophysiology1,2,3,4,5,6. The 3D organoids developed by the Clevers group provide a powerful tool to study the intestinal epithelium with improved physiological relevance7. Since intestinal organoids are derived from tissue stem cells and are composed of multiple cell types, they recapitulate the functionality of the intestinal epithelium. Of note, a single-sorted leucine-rich repeats-containing G protein-coupled receptor 5-positive (Lgr5+) stem cell can also generate 3D organoids without any Paneth cells or an ISC niche such as the epithelial niche or stromal niche7. However, the organoid-forming capacity of single-sorted Lgr5+ cells is low compared to those of crypt and ISC-Paneth cell doublets8.
An increasing number of studies have shown that the methods of ethylenediaminetetraacetic acid (EDTA) incubation or collagenase dissociation cause loosening in the epithelium and the release of crypts. As enzymatic dissociation may have an effect on the cell state of crypts, a mechanical isolation method is usually used to dissociate the tissue. Though mechanical digestion is a rapid technique, this method can be associated with inconsistent crypt yields or poor cell viability9. Therefore, EDTA treatment and mechanical dissociation can be combined to generate better crypt yields. A feature of the methodology shown in this article is the use of vigorous shaking of the tissue fragments after EDTA chelation10. Vigorous shaking permits the efficient isolation of crypts from crypt-villus complexes in the small intestine. The degree of manual shaking determines the separation. Thus, obtaining crypts from complexes is important for experimenters in this field. Additionally, proper skill can reduce villus contamination to a minimum and increase the number of crypts.
Hence, this experimental protocol, which employs murine-derived small intestinal organoids, can better isolate crypts with physical force after treatment with EDTA for dissociation. It is known that the expression pattern of erythropoietin-producing hepatocellular receptor B2 (EphB2) in part reflects the crypt environment. For example, EphB2-positive cells are organized from bottom to top11. Fluorescence-activated cell sorting (FACS) was carried out based on the EphB2 expression, and the cells obtained were divided into four groups: EphB2high, EphB2med, EphB2low, and EphB2neg. Then, the organoid growth from single-sorted EphB2high cells in wild-type (WT) mice was demonstrated.
Protocol
All mouse experiments were approved by the Suntory Animal Ethics Committee (APRV000561), and all animals were maintained in accordance with the committee guidelines for the care and use of laboratory animals. A standard WT strain of Mus musculus (C57BL6/J) was used. Both male and female mice from 10 weeks to 20 weeks of age were used. The mice were euthanized with CO2 asphyxiation.
1. Isolation of the small intestine
- Excise the small intestines, including the duodenum and the proximal half of the jejunum, with laboratory scissors.
- Transfer the tissue into a Petri dish, and flush the small intestines with 5 mL of cold PBS-ABx (PBS + penicillin-streptomycin [1%] + gentamicin [0.5%]) in a 5 mL syringe to clear the luminal content.
- Cut the tissue open lengthwise with laboratory scissors, and manually wash with cold PBS-ABx while shaking.
NOTE: By scraping out the villi with a slide, villus contamination can be reduced12. - Collect approximately 5 mm x 5 mm pieces of the intestinal segment using laboratory scissors. Transfer the fragments to a 50 mL tube with tweezers, and add 25 mL of cold PBS-ABx.
- Wash the fragments by agitating back and forth 10x with 25 mL of cold PBS-ABx to remove the intestinal contents in the 50 mL tube.
2. Crypt isolation
- Incubate the pieces in PBS-ABx containing 2 mM EDTA for 30 min on ice with no shaking.
- For easy solidification of the extracellular matrix (ECM), incubate a 24-well plate in a 37 °C tissue culture incubator beforehand.
- Aspirate the EDTA solution from the cell culture system with a vacuum pump, add 25 mL of fresh, cold PBS-ABx, and then shake the pieces up and down vigorously by hand 30x-40x to release the crypt-villus complexes.
NOTE: The separated crypts and villi can be checked by the microscopic observation of a 25 µL droplet from the suspension at 4x magnification. - Next, filter the suspension through a 70 µm strainer once.
- Centrifuge the suspension at 390 × g for 3 min at 4 °C.
- Resuspend the crypt pellet in 20 mL of sorbitol DMEM (advanced DMEM/F12 + penicillin-streptomycin [1%] + gentamicin [0.5%] + fetal bovine serum [1%] + sorbitol [2%]) with pipetting, and transfer the crypt suspension to two new 15 mL tubes for division into two 10 mL solutions to centrifuge at low speed.
NOTE: The large cell mass and cells/debris can be separated using low-speed centrifugation. The large cell mass is in the pellet, and cells/debris are in the supernatant. - Centrifuge the two crypt suspensions at 80 × g for 3 min at 4 °C, and then aspirate the supernatant gently.
NOTE: As the pellet formation is weak, do not aspirate too much. Leave 2 mL of supernatant in each tube. - Add 10 mL of sorbitol DMEM to each tube again. Centrifuge the suspension at 80 × g for 3 min at 4 °C.
- After aspirating the supernatant, leaving 2 mL of supernatant in each tube, add 10 mL of sorbitol DMEM for resuspension, and centrifuge the crypt suspension at 80 × g for a final 3 min at 4 °C.
- After aspirating the supernatant, leaving 2 mL of supernatant in each tube, add 10 mL of complete DMEM (advanced DMEM/F12 + penicillin-streptomycin [1%] + gentamicin [0.5%] + fetal bovine serum [1%]) for resuspension of the pellet by pipetting up and down, and leave it for 1 min.
NOTE: Wait for 1 min to obtain the floating crypts efficiently. - After 1 min, collect each 10 mL suspension for a total of 20 mL, and filter once with a 70 µm cell strainer to purify the crypts.
- Before seeding essentially pure crypts, count the number of crypts in the filtered complete DMEM, and then centrifuge at 290 × g for 3 min at 4 °C.
- Drip 25 µL droplets into a 6 cm dish at three points. Count the number of crypts under a microscope at 4x magnification, and calculate the concentration of crypts per 25 µL droplet.
- Suspend 100 crypts with 40 µL of ECM per well. Pipet up and down 5x-10x to obtain a homogeneous suspension of crypts in the ECM, and then seed in a 37 °C prewarmed 24-well plate.
NOTE: Always keep the ECM on ice to avoid polymerization. Pipette carefully to avoid making air bubbles in the ECM. - Incubate the 24-well plate for 15 min in a 37 °C, 5% CO2 incubator for the polymerization of the ECM.
- Finally, cover the ECM with 500 µL of culture medium containing mouse epidermal growth factor (EGF), recombinant mouse R-spondin 1, and recombinant mouse Noggin at room temperature. The final concentration of materials per well is as follows: penicillin-streptomycin (1%), 50 U/mL each; gentamicin (0.5%), 25 µg/mL; EGF, 20 ng/mL; Noggin, 100 ng/mL; R-spondin 1, 500 ng/mL; L-glutamine, 2 mM.
- Start the crypt culture at 37 °C in a 5% CO2 incubator.
NOTE: For the culture medium for organoids in a 24-well plate, see Table 1. - Carry out long-term live imaging to observe organoid morphogenesis with a recording time-lapse image microscope equipped with a 20x objective every 3 h for up to 7 days. Obtain serial z-stacked images at z-steps of 1 µm (1 µm x five steps).
- Change the medium every other day.
3. Fluorescence-activated cell sorting (FACS)
- Isolate crypts from the mice (see section 2).
- Treat the isolated crypts with 2 mL of trypsin for 30 min at 37 °C.
- Stop the reaction with 10 mL of PBS, and then pass through a 20 µm cell strainer.
- Centrifuge the solution at 390 × g for 3 min at 4 °C, and resuspend with 100 µL of complete DMEM.
- Add anti-EphB2 APC-conjugated antibody (1/50), and incubate for 30 min on ice.
- Wash the cells 3x with PBS, and finally add 7-amino-actinomycin D (7-AAD) (1/100).
- Sort the stained cells via FACS.
- Adjust the area scaling factor, and sort according to cell size (forward scatter, FSC-A) versus granularity (side scatter, SSC-A).
- Sort 7-AAD negative and positive cells for viability with the laser set at a wavelength of 488 nm and 50 mV power.
- Demarcate the gates to sort the EphB2-high (EphB2high), EphB2-medium (EphB2med), EphB2-low (EphB2low), and EphB2-negative (EphB2neg) cells with the laser set at a wavelength of 640 nm and 100 mV power.
- Start the EphB2high cell culture at 37 °C in a 5% CO2 incubator.
4. Single-cell cultured organoids
- Carry out the cell isolation method according to graded EphB2 surface levels11, and then obtain four distinct populations (high, medium, low, and negative).
- Collect, pellet with centrifugation at 390 × g for 3 min at 4 °C, and embed the single-sorted EphB2high cells in the ECM by pipetting, followed by seeding on a 24-well plate (100 singlets/40 µL of ECM/well).
- As in step 2.14, allow the ECM to polymerize, and cover the ECM with a culture medium containing a Rho-associated kinase (ROCK) inhibitor (10 µM) for the first 2 days to maintain the EphB2high cells.
NOTE: The ROCK inhibitor is effective against anoikis. - Manually inspect the cells using an inverted microscope at 40x magnification, and observe viable organoids with spheroid formation and crypt protrusion.
Results
To generate mouse small intestinal organoids, a combination of EDTA treatment and a mechanical isolation method can be used to efficiently isolate crypts10,13. The results of this study showed that almost all the isolated crypts were immediately sealed and appeared cone-shaped after they were squeezed out of the epithelial niches (Figure 1A). To minimize villus contamination, the resulting suspension was passed through a 70 µm cell strainer, and then the filtrate was centrifuged. As some crypts are disrupted during filtration and suspension, these steps should be carried out carefully. The results showed that almost all crypts in the final fraction were integrated and suitable for use in culture (Figure 1B). To visualize all the plated crypts individually, 100 crypts per well were plated (Figure 1C). After adding the specific crypt culture medium (Figure 1D), the development of organoids was monitored with a microscope daily. Furthermore, organoid growth from the crypts was observed by time-lapse images to monitor their development (Figure 1E and Supplementary Video S1). The cultured crypts behaved in a stereotypical fashion. The inner lumen of the organoid was filled with a mass of apoptotic cells. Active proliferation and differentiation of ISCs occurred in the crypt region with budding (Figure 1E and Supplementary Video S1). Budding was coupled with ISC migration and proliferation and Paneth cell differentiation. The differentiated Paneth cells were always located at the budding site (Supplementary Figure S1). As the organoids were confirmed to be stable in culture using an inverted microscope at 10x magnification, the technique could be used to examine crypt formation in the developing small intestine and to determine the capacity for tissue regeneration and ISC long-term survival for the production of new intestinal epithelial cells14,15,16.
Lgr5 is defined as an ISC marker, and murine Lgr5+ cells form 3D organoids7. However, as the cell surface abundance of LGR5 protein is low and there is a lack of high-affinity anti-LGR5 antibodies, it is challenging to efficiently isolate murine ISCs by FACS. EphB2 has been previously identified as a surface marker for the purification of murine and human ISCs from intestinal tissues17,18. The expression pattern of EphB2 increases the complexity involved in ISC markers. EphB2-positive cells are organized throughout the proliferative compartment, peaking at the bottom of the crypts, while they decrease in a gradient toward the top of the crypts11. Paneth cells and progenitor cells are also localized at the crypt. Paneth cells mainly express EphB3, which is required for their positioning, and the progenitor cells above them in the crypt express mainly EphB2. Thus, contamination of both cell types can occur during the course of ISC purification using the anti-EphB2 antibody. Accordingly, their marker gene expression and the organoid-forming capacity of cells isolated using EphB2 by FACS should be assessed.
Based on these facts, using FACS analysis, EphB2 surface-labeled cells can be isolated from WT crypts19. It has been investigated whether EphB2 expression can distinguish among four groups with the expression of specific markers, such as ISC-specific marker genes (Lgr5, Ascl2, and Olfm4) and progenitor cell-specific marker genes (Ki67, Myc, and FoxM1). This experiment demonstrated that EphB2high cells were predominantly ISCs, unlike EphB2med cells20,21. Finally, based on the cell isolation method, the cells obtained were divided into four groups (EphB2high, EphB2med, EphB2low, and EphB2neg cells) (Figure 2). Then, single cells expressing high levels of EphB2 sorted by FACS were cultured for organoid growth. A single EphB2high cell can independently be applied for localized treatment and recreate self-organizing crypt-villous structures reminiscent of the normal small intestine (Figure 3). However, the cells derived from other groups (EphB2med, EphB2low, and EphB2neg) do not generate organoids20.
In a previous study, ~6% of single-sorted Lgr5-GFPhi cells were able to initiate crypt-villous organoids7. However, the remaining cells were unable to generate organoids and died within the first 12 h7. The authors presumed that this was the result of physical and/or biological stress inherent in the isolation procedure7. Less than 6% organoid growth was also obtained from single-sorted EphB2high cells in WT mice. By day 5 of culture, spheroid-like structures formed (Figure 3). From day 7 to day 9, evagination of the spots to form crypts occurred (Figure 3). Importantly, the application of a selected ROCK inhibitor to the single-sorted EphB2high cells diminished dissociation-induced apoptosis and increased the efficiency of organoid growth.

Figure 1: Generation of mouse small intestinal organoids. (A) Crypts prepared by a combination of EDTA chelation and mechanical dissociation. (B) Resultant purified crypts. (C) Crypts embedded in the extracellular matrix. (A-C) The black arrows indicate crypts. (D) Three-dimensional culture of crypts and organoids. (E) Representative images of a growing organoid derived from a crypt. The white arrows indicate crypt budding. Scale bars = (A-C) 100 µm and (E) 50 µm. Please click here to view a larger version of this figure.
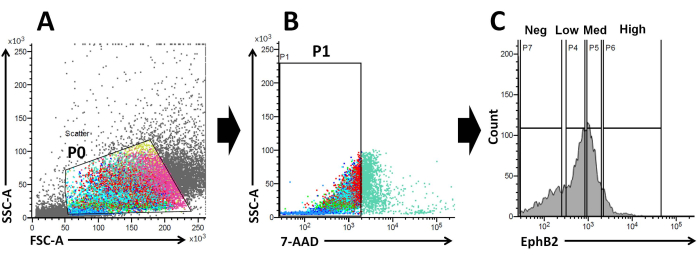
Figure 2: Flow cytometry gating strategy to obtain a population of EphB2-positive (EphB2+) cells in wild-type mice. (A) Forward and side scatter plots are used to separate the cells according to their size and granularity, respectively. (B) Fluorescence scatter is used to separate viable cells according to the 7-AAD (PerCP) fluorescence intensity of the cells. The gate for the 7-AAD-negative cell population was chosen. (C) The gates for the EphB2-high (EphB2high), EphB2-medium (EphB2med), EphB2-low (EphB2low), and EphB2-negative (EphB2neg) cell populations were chosen. Abbreviations: FSC-A = forward scatter-peak area; SSC-A = side scatter-peak area; 7-AAD = 7-amino-actinomycin D. Please click here to view a larger version of this figure.

Figure 3: Time course of single-sorted EphB2high cell organoid growth in wild-type mice. Please click here to view a larger version of this figure.
Table 1: Culture medium for a 24-well plate. Please click here to download this Table.
Supplementary Video S1: Time-lapse images of a growing organoid. Scale bar = 50 µm. Please click here to download this File.
Supplementary Figure S1: Representative image of anti-lysozyme antibody staining in an organoid. The white arrows indicate Paneth cells. Abbreviation: DIC = differential interference contrast microscope. Scale bar = 10 µm. Please click here to download this File.
Discussion
This protocol describes a method for consistently isolating small intestinal crypts and the subsequent culture of 3D organoids. To improve the crypt-releasing rate, a mechanical isolation method involving vigorous shaking after treatment with EDTA was established. The medium composition is different from the original protocol of Sato et al.7. The original medium is relatively costly. Thus, a culture medium and customized media for murine small intestinal organoids containing pharmacological inhibitors, recombinant growth factors, and/or conditioned media are shown in Table 1. Wnt3A and N-acetylcysteine are not included in the culture medium in this protocol. As Paneth cells express Wnt3, the cells produce Wnt3 and support ISC maintenance. Additionally, during the course of crypt isolation, the conditioned medium is not used. The organoid model is dynamic and has cellular and structural heterogeneity (Paneth cells, enterocytes, goblet cells, enteroendocrine cells, tuft cells, and ISCs). Hence, these organoids can be used at scale to study fundamental issues of organoid biology.
The EphB2 gradient maintains ISC stemness and proliferation along the crypt-villus axis in the adult small intestine18. The advantage of making organoids from one single EphB2 cell compared to isolated crypts relates to understanding the biology of murine ISCs, as ISCs play key roles in various human intestinal disorders. Single EphB2high-expressing ISCs can be cultured to form organoids in a similar way to the development of organoids from single Lgr5-expressing ISCs. The most important step is to precisely divide the cells into four groups (EphB2high, EphB2med, EphB2low, and EphB2neg) according to the EphB2 expression in the crypts using FACS. Forward versus side scatter (FSC vs. SSC) plots are commonly used to identify cells of interest based on their size and granularity. FSC indicates the cell size, and SSC relates to the complexity or granularity of the cell in the P0 gate (Figure 2A). In this work, the cells that fell within the defined gate (P0) were subsequently analyzed for viability. Next, their viability was determined according to the negative and positive populations of 7-AAD fluorescence signals. The border between the 7-AAD-negative and -positive cells was strictly decided to gain the negative ones with minimal positive cell contamination. The EphB2 gates were roughly set based on the EphB2 graded expression.
To confirm that the four groups were precisely divided, the mRNA expression of selected genes was analyzed. The mRNA levels of ISC markers are high in EphB2high cells20. Additionally, the mRNA levels of progenitor cell-specific markers are relatively high in EphB2med cells20. However, EphB2 exdpression in EphB2low and EphB2neg cells is low or negative compared with that of EphB2high and EphB2med cells20. The preceding measures should be taken to ensure the enrichment of the EphB2high cell population before plating. However, organoid growth of less than 6% from EphB2high cells may be due to the death of stem cells during the culture process, not the vigorous shaking during the crypt isolation. It has been shown that the application of a selective Rho-associated kinase (ROCK) inhibitor to human embryonic stem cells markedly diminishes dissociation-induced apoptosis22. Thus, as a technical change, it is worth trying to add the ROCK inhibitor at a higher concentration and with a longer incubation to improve the viability.
Wnt3A-secreting Paneth cells next to ISCs provide essential support to the ISCs8. Indeed, ISC-Paneth cell doublets display a strongly increased organoid-forming capacity compared to single ISCs8. Moreover, the addition of Wnt3A at the concentration of 100 ng/mL for the first 3 days of culture has been shown to increase the organoid-forming capacity8. Thus, as another technical change, adding exogenous Wnt3A could improve the organoid-forming capacity of single EphB2high-expressing ISCs.
Compared to in vivo approaches, organoids can be easily used for genetic manipulation, the analysis of malignancy phenotypes, and drug screening20,23. A combination of EDTA chelation and a mechanical isolation method is effective, reproducible, and time-efficient for creating small intestinal organoids from crypts and can be easily followed by laboratory staff without any advanced experience. Thus, the addition of the mechanical isolation with vigorous shaking after the treatment with EDTA can efficiently establish murine small intestinal organoids ex vivo and provide a potential tool for organoid cultivation and disease modeling of other adult epithelial tissues.
Intestinal epithelial cells are polarized and orientated with the apical side directed toward the lumen. However, the apical side facing the lumen of 3D organoids is in their interior. Thus, this organization prevents access to the apical side, which is an issue when studying the effects of luminal components, such as nutrients, microbes, and metabolites on epithelial cells. To circumvent this disadvantage, a culture of organoid cells as 2D monolayers has been developed24. In terms of future applications, the culture of organoid cell monolayers will be utilized, as this represents the most efficient and tractable system.
Disclosures
The authors have no conflicts of interest to declare.
Acknowledgements
This work was supported by Grants-in-Aid for Scientific Research (C) to T.T. (grant numbers JP17K07495 and JP20K06751). We thank Prof. Mineko Kengaku for the use of equipment for the long-term time-lapse imaging (LCV100; Olympus).
Materials
| Name | Company | Catalog Number | Comments |
|---|---|---|---|
| 1.5 mL Eppendorf tube | Eppendorf | 0030 125.215 | |
| 5 mL syringe | TERUMO | SS-05SZ | |
| 15 mL Falcon tube | Iwaki | 2325-015 | |
| 20 μm cell strainer | Sysmex | 04-004-2325 | |
| 24-well plate | Iwaki | 3820-024 | |
| 50 mL Falcon tube | Iwaki | 2345-050 | |
| 60 mm tissue culture dish | FALCON | 353002 | |
| 70 μm cell strainer | Falcon | 352350 | |
| 100 mm Petri dish | Iwaki | 3020-100 | |
| 7-AAD | BD Biosciences | 559925 | |
| Advanced DMEM/F12 | Gibco | 12634-010 | |
| Alexa Fluor 568 Goat Anti-Mouse IgG (H+L) | Invitrogen | A-11004 | |
| Anti-EphB2 APC-conjugated antibody | BD Biosciences | 564699 | |
| C57BL6/J mice | Japan SLC, Inc. | ||
| Clean bench | HITACHI | CCV-1306E | |
| Confocal laser scanning microscope | Olympus | FV3000 | |
| EDTA (0.5 mol/L) | Nacalai Tesque | 06894-14 | 2 mM |
| FACSMelody | BD Life Sciences-Biosciences | 661762 | |
| Fetal bovine serum | Sigma | 173012 | 1% (v/v) |
| Fiji (software) | https://fiji.sc/ | ||
| Gentamicin (10 mg/mL) | Nacalai Tesque | 16672-04 | 25 μg/mL |
| Hammacher laboratory scissor | SANSYO | 91-1538 | |
| Incubator | Panasonic | MCO-170-PJ | |
| Laboratory tweezer | AS-ONE | 7-164-04 | |
| L-Glutamine 200 mM | Gibco | 25030081 | 2 mM |
| Matrigel | BD Biosciences | 354230 | ECM for 3D organoids |
| Mouse Anti-Human Lysozyme | LSBio | LS-B8704-100 | |
| Murine EGF (20 μg/mL stock solution) | PeproTech | 315-09 | 20 ng/mL |
| PBS 1x | Gibco | 10010-023 | |
| Penicillin-Streptomycin (10,000 U/mL) | Gibco | 15140-122 | 50 U/mL |
| Pipetman (10 μL, 20 μL, 200 μL, and 1,000 μL) | GILSON | 1-6855-12, -13, -15, and -16 | |
| Recombinant murine Noggin (20 μg/mL stock solution | R&D Systems | 1967-NG-025 | 100 ng/mL |
| Recombinant murine R-Spondin 1 (250 μg/mL stock solution) | R&D Systems | 3474-RS-050 | 500 ng/mL |
| Sorbitol | Nacalai Tesque | 32021-95 | 2% (w/v) |
| TE2000-S (inverted microscope) | Nikon | 24131 | |
| Time-lapse image microscope | Olympus | LCV100 | |
| TrypLE Express 1x | Gibco | 12605-010 | |
| ULVAC | ULVAC KIKO Inc. | 100073 | |
| Y-27632 | Fujifilm | 331752-47-7 | 10 μM |
References
- Clevers, H. Modeling development and disease with organoids. Cell. 165 (7), 1586-1597 (2016).
- Seidlitz, T., et al. Human gastric cancer modelling using organoids. Gut. 68 (2), 207-217 (2019).
- Nikolaev, M., et al. Homeostatic mini-intestines through scaffold-guided organoid morphogenesis. Nature. 585 (7826), 574-578 (2020).
- Artegiani, B., Clevers, H. Use and application of 3D-organoid technology. Human Molecular Genetics. 27, R99-R107 (2018).
- Lancaster, M. A., Knoblich, J. A. Organogenesis in a dish: modeling development and disease using organoid technologies. Science. 345 (6194), 1247125(2014).
- Dedhia, P. H., Bertaux-Skeirik, N., Zavros, Y., Spence, J. R. Organoid models of human gastrointestinal development and disease. Gastroenterology. 150 (5), 1098-1112 (2016).
- Sato, T., et al. Single Lgr5 stem cells build crypt-villus structures in vitro without a mesenchymal niche. Nature. 459 (7244), 262-265 (2009).
- Sato, T., et al. Paneth cells constitute the niche for Lgr5 stem cells in intestinal crypts. Nature. 469 (7330), 415-418 (2011).
- Aronowitz, J. A., Lockhart, R. A., Hakakian, C. S. Mechanical versus enzymatic isolation of stromal vascular fraction cells from adipose tissue. Springerplus. 4 (1), 713(2015).
- Takahashi, T. New trends and perspectives in the function of non-neuronal acetylcholine in crypt-villus organoids in mice. Methods in Molecular Biology. 1576, 145-155 (2019).
- Batlle, E., et al. β-catenin and TCF mediate cell positioning in the intestinal epithelium by controlling the expression of EphB/ephrinB. Cell. 111 (2), 251-263 (2002).
- Baghdadi, M. B., Kim, T. -H. Analysis of mouse intestinal organoid culture with conditioned media isolated from mucosal enteric glial cells. STAR Protocols. 3 (2), 101351(2022).
- Takahashi, T., et al. Non-neuronal acetylcholine as an endogenous regulator of proliferation and differentiation of Lgr5-positive stem cells in mice. FEBS Journal. 281 (20), 4672-4690 (2014).
- Barker, N. Adult intestinal stem cells: Critical drivers of epithelial homeostasis and regeneration. Nature Reviews Molecular Cell Biology. 15 (1), 19-33 (2014).
- Fordham, R. P., et al. Transplantation of expanded fetal intestinal progenitors contributes to colon regeneration after injury. Cell Stem Cell. 13 (6), 734-744 (2013).
- Miyoshi, H., et al. Wnt5a potentiates TGF-β signaling to promote colonic crypt regeneration after tissue injury. Science. 338 (6103), 108-113 (2012).
- Jung, P., et al. Isolation and in vitro expansion of human colonic stem cells. NatureMedicine. 17 (10), 1225-1227 (2011).
- Merlos-Suárez, A., et al. The intestinal stem cell signature identifies colorectal cancer stem cells and predicts disease relapse. Cell Stem Cell. 8 (5), 511-524 (2011).
- Mao, W., et al. EphB2 as a therapeutic antibody drug target for the treatment of colorectal cancer. Cancer Research. 64 (3), 781-788 (2004).
- Takahashi, T., et al. Muscarinic receptor M3 contributes to intestinal stem cell maintenance via EphB/ephrin-B signaling. Life Science Alliance. 4 (9), e202000962(2021).
- Jung, P., et al. Isolation of human colon stem cells using surface expression of PTK7. Stem Cell Reports. 5 (6), 979-987 (2015).
- Watanabe, K., et al. A ROCK inhibitor permits survival of dissociated human embryonic stem cells. Nature Biotechnology. 25 (6), 681-686 (2007).
- Schulte, L., Hohwieler, M., Müller, M., Klaus, J. Intestinal organoids as a novel complementary model to dissect inflammatory bowel disease. Stem Cells International. 2019, 8010645(2019).
- Puzan, M., Hosic, S., Ghio, C., Koppes, A. Enteric nervous system regulation of intestinal stem cell differentiation and epithelial monolayer function. Scientific Reports. 8 (1), 6313(2018).
Reprints and Permissions
