The present protocol describes a modified parasternal long-axis view for swift and precise localization of the left anterior descending artery. This approach is designed to be simpler and more user-friendly while facilitating the examination of dynamic changes in coronary flow reserve following myocardial ischemia-reperfusion in mice.
Method Article
Dynamic Assessments of Coronary Flow Reserve after Myocardial Ischemia Reperfusion in Mice
In This Article
Summary
Abstract
After cardiac ischemia, there is often insufficient myocardial perfusion, even if flow has been successfully and completely restored in an upstream artery. This phenomenon, known as the "no-reflow phenomenon," is attributed to coronary microvascular dysfunction and has been associated with poor clinical outcomes. In clinical practice, a reduction in coronary flow reserve (CFR) is frequently used as an indicator of coronary artery disease. CFR is defined as the ratio of the peak flow velocity induced by pharmacologic or metabolic factors to the resting flow velocity.
This protocol focused on assessing the dynamic changes in CFR before and after ischemia-reperfusion (IR) using pulse wave Doppler measurements. In this study, normal mice exhibited the ability to increase the peak velocity of coronary blood flow up to two times higher than the resting values under isoflurane stimulation. However, after ischemia-reperfusion, the CFR at 1 h significantly decreased compared to the pre-operation baseline. Over time, the CFR showed gradual recovery, but it remained below the normal level. Despite the preservation of systolic function, early detection of microvascular dysfunction is crucial, and establishing a practical guide could aid doctors in this task, while also facilitating the study of cardiovascular disease progression over time.
Introduction
Coronary heart disease stands as one of the leading causes of mortality worldwide1. Even when the culprit coronary artery is re-opened through primary percutaneous coronary intervention (PCI) after cardiac ischemia, coronary microvascular perfusion often remains diminished. Additionally, there is no guarantee of reperfusion in the downstream capillaries supplying the myocardium1. This phenomenon, known as the "no-reflow phenomenon," is linked to clinical progression and a poor prognosis. Consequently, achieving adequate microvascular reflow after successful reperfusion therapy becomes critical for myocardial salvage. Hence, early assessment of microvascular function following revascularization is crucial for clinical practices.
Various techniques, such as invasive intracoronary temperature/pressure guide wire to index of microcirculatory resistance (IMR) and hyperemic microvascular resistance (HMR), non-invasive cardiovascular magnetic resonance (CMR), single-photon emission computed tomography (SPECT), and Positron emission tomography (PET), can be employed to assess microvascular function2. However, these methods are either invasive or semi-invasive, expensive, and often not readily available, limiting their clinical utility. On the other hand, assessing coronary flow reserve (CFR) by transthoracic Doppler echocardiography offers a noninvasive, relatively simple, and cost-effective approach without exposing patients to ionizing radiation, as seen in other methods3.
Though previous studies have employed transthoracic Doppler echocardiography to measure CFR in mice and rats, challenges remain for operators to locate the complex angles between the platform, mice, and probe. This protocol overcomes this issue by providing an easier method to locate the left anterior descending artery (LAD) coronary artery and measure CFR quickly using the modified parasternal long-axis (PLAX) view.
Furthermore, CFR obtained in the infarct-related artery (IRA) distal to the culprit lesion has shown a strong correlation with perfusion status assessed by myocardial contrast echocardiography (MCE)4. It has also been identified as a predictive marker for viability and left ventricular (LV) function recovery after an acute myocardial infarction (AMI)5. Additionally, CFR has been established as a reliable marker for all-cause mortality and adverse cardiovascular outcomes6,7. Previous reports have described the use of echocardiography to assess CFR in rat models of myocardial infarction8. Nevertheless, the CFR in the early stage of ischemia-reperfusion has not been thoroughly studied. Therefore, this study provides a reference value for diagnosing microvascular dysfunction and assessing the therapeutic effect of ischemia-reperfusion through dynamic tests in IR mice in the early stage of reperfusion.
Protocol
All experiments were approved by the Animal Care and Use Committee of Peking University. 8-12 week-old male C57 mice were used for the present study. The animals were obtained from a commercial source (see Table of Materials).
1. Animal preparation
- Remove the hair from the precordial area using hair removal cream (see Table of Materials). Then, proceed with acquiring the ultrasound images following step 2.
2. Ultrasound imaging before IR surgery
- Anesthetize the mouse by placing it into the isoflurane-induction chamber (see Table of Materials) and initiate isoflurane delivery at a concentration of 1.5% with 1.5-2.0 L/min O2 flow.
- Position the anesthetized mouse in a supine position on the physiologic monitoring platform (ultrasound system's imaging platform, see Table of Materials). Apply a small amount of conductive gel to the copper sheet of the physiological monitoring table and secure the mouse paws with low-adhesive tape on it to obtain physiological information on ECG and respiration. Maintain the body temperature at 37-38 °C using the built-in warming platform.
NOTE: Switch the control switch of the gas anesthesia machine from the chamber to the mask, and keep the anesthetic dose constant at 1.5% during this time. The heart rate of the mice at this point should be approximately 350-450 beats/min. - Apply ophthalmic vet ointment to the eyes before imaging to prevent dryness.
- Perform transthoracic echocardiography using a 40 MHz linear probe9 (e.g., MS550 probe for mice) (Figure 1A).
NOTE: The ultrasound machine is equipped with the MS550 probe. - Liberally apply ultrasound transmission gel (see Table of Materials) to ensure optimal image quality.
- Adjust the position of the probe and platform to form a modified parasternal long-axis (PLAX) view9 (Figure 1A) to examine the left anterior descending artery (LAD) in B-mode. Briefly, image the heart using a parasternal long-axis view with the platform laterally aligned and positioned at a small angle between the probe and platform.
- Locate the suitable heart section in B-mode and activate Color Doppler on the touchscreen (Figure 1B). The LAD (white arrow) can be identified within the left ventricular wall (Figure 1B). The real-time red color indicates the direction of blood flow (i.e., blood flow is towards the probe).
NOTE: By adjusting the x-axis, Color Doppler allows for the visualization of the complete LAD (from the aortic sinus to the distal branch site) within this image window. - Slightly move the probe to find the right position and reduce the influence of pulmonary vein blood flow.
NOTE: To reduce the influence of pulmonary vein blood flow, slightly adjust the probe and differentiate the LAD from the pulmonary vein. The LAD runs in the left ventricular wall, while the pulmonary vein drains into the left atrium. Locate the LAD using Color Doppler, and use B-Mode to select the suitable section. - After visualizing the LAD in Color Doppler mode, press the Pulse Wave (PW) button and switch to the PW-mode. Position the yellow-indicator line on the coronary artery, ensuring it is parallel to the direction of the flow. Then press the Save Clip button to record the baseline data.
- Increase the isoflurane concentration to 3% and wait for 30 s. Ensure that the flow velocity gradually increases with time. Press the Save Clip button frequently to capture the highest blood flow velocity.
NOTE: The isoflurane stimulus causes the heart to work harder, leading to possible movement of the heart and the LAD. Once the image in PW-mode is captured or cine-stored, click on the PW-mode to ensure the yellow-indicator line is on the LAD. If displacement occurs, adjust the yellow-indicator line slightly to the point of blood flow and continue recording. This process requires quick mastery and switching. - After collecting coronary blood flow images, turn off the anesthetic and adjust the probe to the normal PLAX view. Wait for the mouse heart rate to increase slowly to about 500 bpm, then measure the mouse heart function by switching the probe to the parasternal short-axis section (PSAX).
- Upon completing the echocardiographic imaging, remove the animal from the platform and allow it to recover in its home cage. Remove the gel and allow the animal to dry to prevent hypothermia.
- Use the Peak Vel and LV function tools to obtain the peak diastolic velocities and heart systolic function from the images, respectively.
- Calculate CFR as the ratio of diastolic peak coronary flow velocity (CFV) at maximal flow to diastolic peak CFV at baseline.
3. Myocardial ischemia-reperfusion procedure
NOTE: The initial measurement was baseline, and then surgery was performed on the same animal.
- Anesthetize the mice with sodium pentobarbital (60 mg/kg) and administer the analgesic carprofen (5 mg/kg, subcutaneous injection). Use a prewarmed heating pad (37 °C) throughout the surgical procedure. Ensure appropriate depth of anesthesia by the absence of a withdrawal reflex to toe pinching and blink reflexes. Place the mouse supine on the heating pad and apply ophthalmic ointment to the eyes to prevent them from drying out. Perform endotracheal intubation for mechanical ventilation: disinfect the area with 3 alternating scrubs of betadine or chlorhexidine and 70% alcohol before and after removing the hair of the neck. Locate the trachea and gently insert the catheter. Then, connect the mice to the ventilator (inspiratory tidal volume of 250 µL at 120 breaths/min) (see Table of Materials).
- Disinfect the skin of the precordial area with 3 alternating scrubs of betadine or chlorhexidine and 70% alcohol. Expose the heart by performing a left thoracotomy10 at the fourth intercostal space.
- Ligate the left anterior descending artery (LAD) with a slipknot using a 5-0 silk suture (see Table of Materials), inserting 1-2 mm below the root of the left atrial appendage. Ensure that the stitching direction is parallel to the lower edge of the left atrial appendage. Visually confirm ischemia in all mice via local color darkening of the ischemic myocardium.
- Occlude the LAD artery for 30 min11. After 30 min, release the ligature and verify reperfusion by observing the reddening of the previously discolored area of heart muscle for 1-2 min.
- After the coronary occlusion/reperfusion, close the chest in layers and allow the mice to recover for about half an hour11.
4. Ultrasound imaging after IR surgery
- Measure the CFR again at 1 h, 3 h, 5 h, 8 h, 24 h, and 48 h after reperfusion, respectively, following the steps outlined in section 2. Compare these measurements to the CFR values obtained before the ischemia-reperfusion (IR) procedure.
5. Statistical analysis
- Perform statistical analyses using appropriate statistical analysis software (see Table of Materials).
NOTE: For comparison of continuous variables between paired samples, utilize paired t-tests if the data is normally distributed. For non-normally distributed data or when assumptions of normality are not met, use Friedman's ANOVA. Consider p < 0.05 as statistically significant.
Results
This study utilized male C57 mice (BW ~18-20 g) to characterize the dynamic change of CFR. The modified PLAX image was employed to assess the coronary artery flow characteristics of LAD (Figure 1A,B). CFR was calculated as the ratio of the maximal flow velocity during maximal vasodilation induced by 3% isoflurane to the maximal flow velocity at a baseline of 1.5% isoflurane concentration12,13. All measurements and calculations were repeated over three consecutive cardiac cycles and averaged, with representative results shown in Figure 2.
Before the IR surgery, baseline CFR was measured, and the mice had a normal CFR value near 2.14 ± 0.43. However, after the IR surgery, CFR significantly decreased at reperfusion 1 h compared to before IR surgery (1.18 ± 0.14 vs. 2.14 ± 0.43) (Figure 3A). This reduction indicated that microcirculation was not immediately restored even after opening the culprit vessel. As the reperfusion time was prolonged, the CFR values remained at a consistently low level, with values of 1.21 ± 0.20 at 3 h, 1.39 ± 0.33 at 5 h, 1.44 ± 0.38 at 8 h, 1.34 ± 0.36 at 24 h, and 1.48 ± 0.47 at 48 h after reperfusion, suggesting that hypoperfusion could persist for at least two days (Figure 3A). Furthermore, there was no statistical significance between CFR values at 1 h, 3 h, 5 h, 8 h, 24 h, and 48 h.
The mice were also monitored for cardiac function, and it was observed that there were no significant changes in left ventricular cardiac function when the CFR was significantly reduced in the mice (Figure 3B).

Figure 1: Modified parasternal long-axis view. (A) illustrates the positioning of the probe and platform while obtaining the coronary artery velocity of LAD. (B) shows the placement of the Pulse Wave velocity sensor on the LAD coronary artery. The blue color indicates movement away from the ultrasound probe, while the orange color indicates movement toward the ultrasound probe. Please click here to view a larger version of this figure.
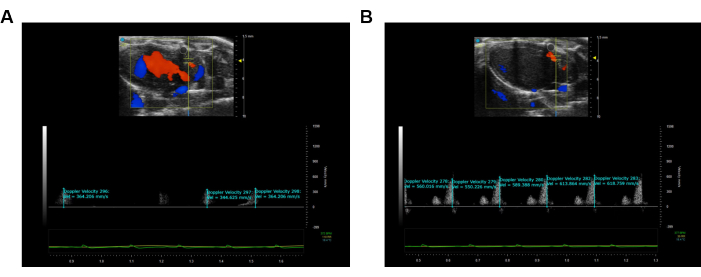
Figure 2: Visualization and recording of the Pulse Wave Velocity imaging of LAD. (A) Pulse Wave image during the rest condition of the LAD coronary artery. (B) Maximum hyperemic coronary Pulse Wave image of the LAD coronary artery. The blue color illustrates movement away from the ultrasound probe, while the orange color illustrates movement toward the ultrasound probe. Please click here to view a larger version of this figure.
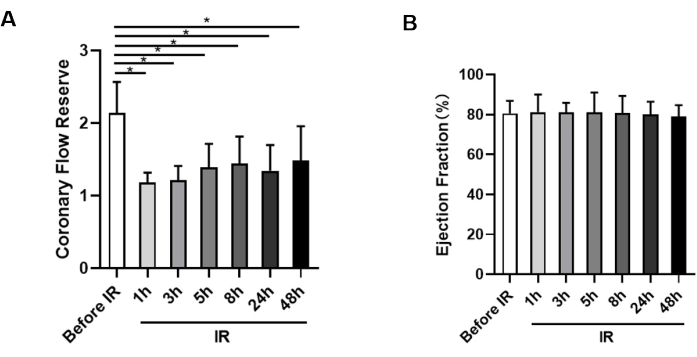
Figure 3: Measurement of coronary flow reserve and ejection fraction. (A) Statistical analysis of CFR in animals before ischemia and at 1 h, 3 h, 5 h, 8 h, 24 h, and 48 h after reperfusion, respectively (n = 9). (B) Assessment of ejection fraction from each group at each time point (n = 9). *p < 0.05; data presented as mean ± SD, analyzed with paired t-tests and Friedman's ANOVA. Please click here to view a larger version of this figure.
Discussion
This study presents a protocol that uses a modified parasternal long-axis view to dynamically assess CFR after ischemia-reperfusion. The major findings indicate a significant decrease in CFR in IR mice, with the most pronounced reduction observed at 1 h after reperfusion. However, cardiac function was not affected within 48 h.
CFR serves as an indicator of myocardial blood supply, offering a noninvasive approach to evaluate both coronary artery stenosis and coronary microvascular circulation. Clinical studies have demonstrated that lower CFR values are associated with worse prognoses14,15,16, and a CFR cut-off value of 1.75 has been established as optimal for risk stratification14. A recent meta-analysis further showed that the risk of death increases by 16% for every 0.1 unit decrease in CFR, indicating that CFR represents a continuum of risk, with lower levels predisposing patients to poorer clinical outcomes17. In this study, CFR showed a trend of increasing with the extension of reperfusion time but remained lower than before the procedure, emphasizing the importance of monitoring patients not only immediately after opening the culprit vessel through PCI but also at 48 h. Moreover, CFR serves as a measure of coronary microvascular dysfunction, integrating the hemodynamic effects of focal, diffuse, and small-vessel disease on myocardial tissue perfusion18. Therefore, CFR is a crucial noninvasive technique for diagnosing coronary microvascular diseases. As CFR on LAD is a strong and independent indicator of mortality6,7, this study aims to provide reference values for clinical decisions. Furthermore, the use of ultrasound machines can potentially reduce the need for coronary angiography in a healthcare cost-containment environment. By appropriately training and upgrading technology, risk stratification can be tailored to individual patient needs.
The modified PLAX view offers greater convenience and time savings for scientific researchers. Continued improvement of this technology will facilitate its broader application in other coronary microvascular diseases. Key steps in this protocol include visualizing the coronary artery and obtaining high-quality PW velocity images. Blood flow velocity gradually increases with an increasing anesthetic concentration, so continuous capture is recommended to avoid missing the maximum blood flow velocity. As increasing anesthetic concentration can alter the heart rate, briefly returning to Color Doppler mode during the measurement is advised to ensure consistent positioning before and after the measurement.
It is essential to acknowledge limitations, including limitations inherent to ultrasound measurement of CFR. Due to the curvature of the coronary artery, it is not possible to display the entire artery fully, leading to measurement in only one segment. Operators must aim to measure the beginning of the coronary artery to identify the point of maximum coronary blood flow velocity as accurately as possible. Additionally, CFR should ideally be determined based on changes in coronary blood flow volume, but this study uses blood flow velocity instead of blood flow volume, overlooking the effect of vessel diameter. However, previous studies have demonstrated a strong correlation between CFR and CFVR (coronary flow velocity reserve)19. Further research on coronary microvascular function may aid in understanding the complex alterations in ischemia and enhance our comprehension of coronary microvascular dysfunction.
Disclosures
The authors declare that they have no known competing commercial or financial relationships that could have appeared to influence the work reported in this paper.
Acknowledgements
This work was supported by the National Natural Science Foundation of China (Grant No. 82270352), Beijing Research Ward Construction Clinical Research Project (2022-YJXBF-04-03), National High Level Hospital Clinical Research Funding (2022-NHLHCRF-YSPY-01), Capital's Founds for Health Improvement and Research (No. 2022-1-4062), National Key Clinical Specialty Discipline Construction Program (Grant No. 2020-QTL-009), and Chinese Society of Cardiology's Foundation (No. CSCF2021B02).
Materials
| Name | Company | Catalog Number | Comments |
|---|---|---|---|
| 5-0 silk suture | Ningbo MEDICAL Needle Co., Ltd. | 210322 | |
| C57 mice | Peking University Health Science Center Department of Laboratory Animal Science | ||
| Depilating agent | Nair | NAR-255-1 | |
| Electrode gel | Cofoe | ||
| High Frequency Ultrasound | FUJIFILM VisualSonics, Inc. | Vevo3100 | |
| Isoflurane | REWARD | R510-22-10 | |
| Linear array high frequency transducer | FUJIFILM VisualSonics, Inc. | MS550 | |
| Rodent Ventilator | Shanghai Alcott Biotech | ALC-V9 | |
| Small Animal Anesthesia Machine | REWARD | R530 | |
| SPSS | IBM Corp, Armonk, NY, USA | version 23.0 | statistical analysis software |
| Ultrasound Gel | Cofoe | ||
| Vevo Lab Software | FUJIFILM VisualSonics, Inc. | Verison 5.7.0 |
References
- O'Farrell, F. M., Mastitskaya, S., Hammond-Haley, M., Freitas, F., Wah, W. R., Attwell, D. Capillary pericytes mediate coronary no-reflow after myocardial ischaemia. Elife. 6, e29280(2017).
- Dimitrow, P. P. Transthoracic Doppler echocardiography-noninvasive diagnostic window for coronary flow reserve assessment. Cardiovascular ultrasound. 1, 4(2003).
- Picano, E. Stress echocardiography: a historical perspective. The American Journal of Medicine. 114 (2), 126-130 (2003).
- Lim, D. S., Kim, Y. H., Lee, H. S. Coronary flow reserve is reflective of myocardial perfusion status in acute anterior myocardial infarction. Catheterization and Cardiovascular Interventions: Official Journal of The Society For Cardiac Angiography & Interventions. 51 (3), 281-286 (2000).
- Feldman, L. J., Himbert, D., Juliard, J. M. Reperfusion syndrome: relationship of coronary blood flow reserve to left ventricular function and infarct size. Journal of the American College of Cardiology. 35 (5), 1162-1169 (2000).
- Cortigiani, L., et al. Coronary flow reserve during dipyridamole stress echocardiography predicts mortality. JACC Cardiovascular imaging. 5 (11), 1079-1085 (2012).
- Han, B., Wei, M. Proximal coronary hemodynamic changes evaluated by intracardiac echocardiography during myocardial ischemia and reperfusion in a canine model. Echocardiography (Mount Kisco, NY). 25 (3), 312-320 (2008).
- Kelm, N. Q., Beare, J. E., LeBlanc, A. J. Evaluation of coronary flow reserve after myocardial ischemia reperfusion in rats. Journal of Visualized Experiments. 148, e59406(2019).
- Batra, A., Warren, C. M., Ke, Y. Deletion of P21-activated kinase-1 induces age-dependent increased visceral adiposity and cardiac dysfunction in female mice. Molecular and Cellular Biochemistry. 476 (3), 1337-1349 (2021).
- Lv, B., Zhou, J., He, S. Induction of myocardial infarction and myocardial ischemia-reperfusion injury in mice. Journal of Visualized Experiments. 179, e63257(2022).
- Huang, G., Lu, X., Duan, Z. PCSK9 knockdown can improve myocardial ischemia/reperfusion injury by inhibiting autophagy. Cardiovascular Toxicology. 22 (12), 951-961 (2022).
- Lenzarini, F., Di Lascio, N., Stea, F., Kusmic, C., Faita, F. Time course of isoflurane-induced vasodilation: a Doppler ultrasound study of the left coronary artery in mice. Ultrasound in Medicine & Biology. 42 (4), 999-1009 (2016).
- Chowdhury, S. A. K., Rosas, P. C. Echocardiographic characterization of left ventricular structure, function, and coronary flow in neonate mice. Journal of Visualized Experiments. 182, e63539(2022).
- Sadauskiene, E., Zakarkaite, D., Ryliskyte, L. Non-invasive evaluation of myocardial reperfusion by transthoracic Doppler echocardiography and single-photon emission computed tomography in patients with anterior acute myocardial infarction . Cardiovascular Ultrasound. 9, 16(2011).
- Bax, M., de Winter, R. J., Schotborgh, C. E. Short- and long-term recovery of left ventricular function predicted at the time of primary percutaneous coronary intervention in anterior myocardial infarction. Journal of the American College of Cardiology. 43 (4), 534-541 (2004).
- Lee, S., Otsuji, Y., Minagoe, S. Noninvasive evaluation of coronary reperfusion by transthoracic Doppler echocardiography in patients with anterior acute myocardial infarction before coronary intervention. Circulation. 108 (22), 2763-2768 (2003).
- Kelshiker, M. A., Seligman, H., Howard, J. P. Coronary flow reserve and cardiovascular outcomes: a systematic review and meta-analysis. European Heart Journal. 43 (16), 1582-1593 (2022).
- Taqueti, V. R., Di Carli, M. F. Coronary microvascular disease pathogenic mechanisms and therapeutic options: JACC state-of-the-art review. Journal of the American College of Cardiology. 72 (21), 2625-2641 (2018).
- Wikström, J., Grönros, J., Gan, L. M. Adenosine induces dilation of epicardial coronary arteries in mice: relationship between coronary flow velocity reserve and coronary flow reserve in vivo using transthoracic echocardiography. Ultrasound in Medicine & Biology. 34 (7), 1053-1062 (2008).
Reprints and Permissions
