This video demonstrates the use of a novel graphical tool for measuring the spatially weighted calcium score (SWCS), an alternative to the Agatston score, for quantifying coronary artery calcification. The graphical tool computes SWCS based on image data from gated cardiac computed tomography and user-defined paths of the coronary arteries.
A subscription to JoVE is required to view this content. Sign in or start your free trial.
Method Article
Semi-Automatic Graphical Tool for Measuring Coronary Artery Spatially Weighted Calcium Score from Gated Cardiac Computed Tomography Images
In This Article
Summary
Abstract
The current standard for measuring coronary artery calcification to determine the extent of atherosclerosis is by calculating the Agatston score from computed tomography (CT). However, the Agatston score disregards pixel values less than 130 Hounsfield Units (HU) and calcium regions less than 1 mm2. Due to this thresholding, the score is not sensitive to small, weakly attenuating regions of calcium deposition and may not detect nascent micro-calcification. A recently proposed metric called the spatially weighted calcium score (SWCS) also utilizes CT but does not include a threshold for HU and does not require elevated signals in contiguous pixels. Thus, the SWCS is sensitive to weakly attenuating, smaller calcium deposits and may improve the measurement of coronary heart disease risk. Currently, the SWCS is underutilized owing to the added computational complexity. To promote translation of the SWCS into clinical research and reliable, repeatable computation of the score, the aim of this study was to develop a semi-automatic graphical tool that calculates both the SWCS and the Agatston score. The program requires gated cardiac CT scans with a calcium hydroxyapatite phantom in the field of view. The phantom allows for deriving a weighting function, from which each pixel's weight is adjusted, allowing for the mitigation of signal variations and variability between scans. With all three anatomical views visible simultaneously, the user traces the course of the four main coronary arteries by placing points or regions of interest. Features such as scroll-to-zoom, double-click to delete, and brightness/contrast adjustment, along with written guidance at every step, make the program user-friendly and easy to use. Once tracing the arteries is complete, the program generates reports, which include the scores and snapshots of any visible calcium. The SWCS may reveal the presence of subclinical disease, which may be used for early intervention and lifestyle changes.
Introduction
Measuring the amount of calcium within arteries using computed tomography (CT) is an established way to assess the severity of coronary atherosclerosis. Knowing and quantifying the extent of atherosclerosis is key to determining the risk of future coronary heart disease1,2,3,4. The most common way of measuring calcium in the coronary arteries is using the Agatston score5. However, part of the Agatston score calculation relies on the intensity of the chosen pixels, measured in Hounsfield Units (HU). Any pixels less than 130 HU are not accounted for in the calculation. Similarly, calcifications with an area less than 1 mm2 are not considered. Due to these thresholds, the Agatston score is not sensitive to small, weakly attenuating foci of calcification, which may still be important in revealing the presence of subclinical disease6.
A previously described metric called the spatially weighted calcium score (SWCS) was proposed to assess the risk of atherosclerotic plaque in patients with low levels of calcification7. Unlike the Agatston score, the SWCS does not use signal thresholding to reduce the impact of image noise. Instead, it makes use of a phantom-an object with known concentrations of calcium hydroxyapatite (CHA) placed on the participant such that it is in the scan's field of view. Here, a phantom with 0 mg/mL, 50 mg/mL, 100 mg/mL, and 200 mg/mL CHA was used during development; however, in the current implementation of the graphical tool, only the 0 mg/mL and 100 mg/mL sections are required. The phantom is used to create a scan-specific weighting function, which is then used to weigh each of the user-selected pixels as well as its neighbors. Pixels with neighboring pixels that have a high attenuation level are given more weight than ones surrounded by pixels with lower attenuation levels. This process makes the SWCS tolerant to noise and comparable from scan to scan8. The SWCS is continuous and produces a score even when there are low levels of calcification, allowing for quantification of the extent of atherosclerosis when the Agatston score is zero. By allowing the evaluation of micro-calcification even when the Agatston score is zero, the SWCS may be important in revealing the presence of subclinical disease. This may allow a better understanding of the genetic, environmental, and other risk factors in atherosclerosis9,10. A previous study, which examined individuals with an Agatston score of zero at baseline and non-zero at a follow-up approximately 15 years later, observed that those with a higher SWCS at baseline had a higher coronary heart disease (CHD) event rate. The predictive power of the SWCS is especially important in younger populations, where the detection and monitoring of residual risk over a long term may be helpful6.
Presented here is a semi-automatic tool for calculating the SWCS along with the Agatston score. The tool utilizes a graphical user interface running on a compatible programming language. The user is able to interact with the images to generate a final series of reports, which include the two calcium scores. To start, the user selects a case, or a series of Digital Imaging and Communications in Medicine (DICOM) files, to input into the program. These images must be breath-held, electrocardiogram-gated CT scans, acquired only during diastole to avoid respiratory and cardiac motion. While the program is operational with any cardiac CT images, to produce meaningful results, the source images should meet the minimum clinical calcium scoring guidelines11,12. For reference, a slice thickness of 3 mm, peak tube voltage of 100 kVp, average CT dose index-vol of 1.19 mGy, and image resolution of 512 x 512 pixels are used in the study here. Any images that are not 512 x 512 pixels are resampled in the program automatically to ensure adequate and consistent resolution of small areas of calcification. Once the images are loaded, the user is able to see them in the axial, sagittal, and coronal views. One may then adjust the brightness and contrast of the images for better visualization before selecting the 0 mg/mL and 100 mg/mL sections of the phantom. Next, the user can trace each of the four coronary arteries-left anterior descending (LAD), left coronary artery (LCA), left circumflex (LCX), and right coronary artery (RCA)-by placing either a point, a region of interest (ROI), or a combination of both to allow for a thorough selection of an artery's pixels regardless of how the artery appears in the axial plane. The user may delete and replace or redraw points and ROIs as needed. Clicking the SWCS button generates the final reports. Cases are auto-saved so that images, along with the points and ROIs, can be reloaded at a later time. Written instructions are also available at every point while using the program, making the program easy to use.
Access restricted. Please log in or start a trial to view this content.
Protocol
This study was conducted with approval of the Mount Sinai Institutional Review Board (HS-20-01011), and all subjects gave written informed consent.
1. Preparation before starting the protocol
- Appropriate folder structure is necessary for this program. Start by creating a main folder for the project anywhere on the computer by right-clicking and selecting the New Folder option in the files directory. All input DICOM files and results will be stored in this main folder.
NOTE: All DICOM headers required by this program are standard. Therefore, the program is translatable across scanner platforms. - Within this main folder, create two new folders by right-clicking and selecting the New Folder option twice.
- Rename the first of these two folders to make it obvious that it stores raw data (e.g., Original_Data) by right-clicking on it and selecting the Rename option.
- Create a new folder for a given patient within this Original_Data folder by right-clicking and selecting the New Folder option. Rename it as an anonymized patient identifier by right-clicking on the folder and selecting the Rename option. Import only the complete set of raw DICOM files for this patient into this folder.
- Repeat step 1.3.1 for all the patients to be analyzed in the program.
- Rename the second of these two folders as Meta_Data for the storage of results by right-clicking on it and selecting the Rename option. This folder will be empty until the program is run and results are generated.
- Download the program file (Supplementary File 1) and the cover art image (Supplementary File 2) and move them from the downloads folder to the main project folder by dragging and dropping. The final setup of the project folder should look similar to Figure 1.
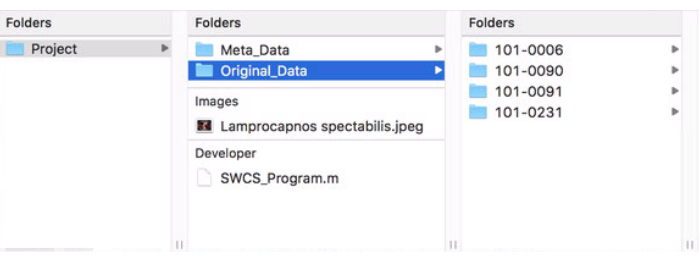
Figure 1: Format of main project folder. This figure shows how the project's main folder should be structured and formatted for proper use of the program. Please click here to view a larger version of this figure.
2. Launching the Program
- Open the program's code by double-clicking on its file in the project's main folder. This will open the software and display the program's code.
- Enter the editor window by single-clicking anywhere on it. Click the green Run button located in the top ribbon of the editor tab to launch the program. The initial program window, after opening, should look like the image in Figure 2.
NOTE: Written instructions on the expected actions from the user and the progress of result generation will be displayed in the bottom left area throughout the course of using the program. - Click the Open DICOM button in the bottom left corner. This will open the files directory.
- Navigate to the project's main folder, the folder containing the original data, and to a patient to analyze. Single-click on the patient's folder so that it's highlighted and click Open.
- The images will now appear in three views: axial, sagittal, and coronal. Hovering and scrolling on a particular view will go through the slices in that view. The crosshairs on each view display the location of the pointer at that moment. Adjust the brightness and contrast in the bottom right area of the program by sliding the bars, as in Figure 3.
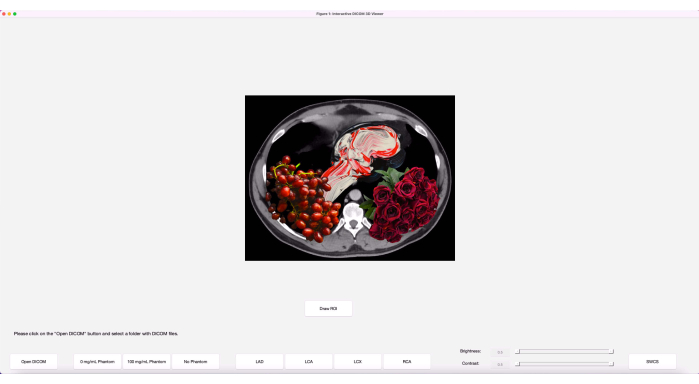
Figure 2: Initial program window. The program, when initially launched, has the buttons laid out along with an art image. Please click here to view a larger version of this figure.
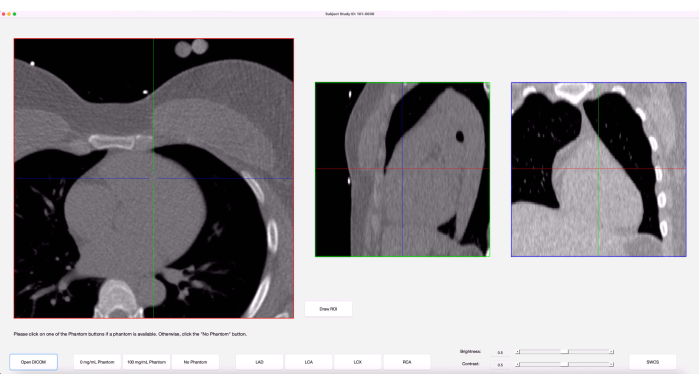
Figure 3: Graphical user interface (GUI). Once images are loaded in, the program's GUI shows three anatomical views of the images along with crosshairs on each view, representing the cursor. Please click here to view a larger version of this figure.
3. Analyzing coronary artery calcification
- When ready to start analyzing, click the 0 mg/mL Phantom button. Hover over the axial view and scroll up or down until the 0 mg/mL section of the phantom is visible.
- Move the cursor to the center of the 0 mg/mL phantom in the axial view. Now, without moving the cursor, observe the crosshairs in the sagittal and coronal views.
- Slowly scroll up and down a few slices until the crosshairs in all three views are in the center of the 0 mg/mL phantom. Single-click to place a 10-by-10 grid of points on the current slice and its neighboring two slices. Doing so will cause a red cluster of circles to appear in the axial view and a column of three points to appear in the sagittal and coronal views. These points will be used in the calculation of the weighting function.
- Repeat steps 3.1-3.3 for the 100 mg/mL phantom.
- If a phantom is not available or is unusable due to quality issues, click the No Phantom button for an aggregation of 10 sample phantoms and its corresponding weighting function to be used.
- When done selecting the phantoms, begin tracing each of the four coronary arteries by clicking on one of the artery buttons- LAD, LCA, LCX, or RCA.
- Hover over the axial view and scroll to navigate to either the proximal or distal end of the chosen artery. Observe the shape of the artery in this slice.
- If the shape of the artery is circular in the axial view of this slice and at most 5 mm in diameter, follow these sub-steps. If it is not circular, move on to step 3.9.
- Place a point on the artery by single-clicking on the center of the artery in the axial view. The point placed will be displayed with a circle that is 5 mm in diameter. If the artery does not fit in the circle, delete it by double-clicking on it and move on to step 3.9 to draw an ROI. The point will appear in the sagittal and coronal views as well.
- If the artery is easier to visualize in the sagittal or coronal view, place a point there instead. Ensure it aligns with the center of the artery in the axial view.
- If a point placed is accidental or is not optimal, it can be deleted by rapidly double-clicking on it in any of the three views. The text in the bottom left area will give a notification that the point has been deleted.
- If the shape of the artery is not circular in the axial plane, follow the steps below.
- While ensuring the desired axial slice is in view, click on the Draw ROI button. In the pop-up window, scroll to zoom in/out and start single-clicking around the artery to trace it, as in Figure 4.
NOTE: ROIs, unlike points, can only be placed in the axial view. - While the ROI is still open, the backspace key may be utilized to delete the previous point placed in the tracing of the artery. To close the ROI, either double-click where the last point is to be placed or double-click on the first point placed.
- Adjust the closed ROI further and refine by dragging the ROI's perimeter points or double-clicking on the perimeter of an ROI to add a point.
- Once the ROI is closed, two buttons will appear at the bottom of the pop-up window: Lock in and Redraw ROI. If the ROI needs to be redrawn, click the Redraw ROI button to clear the current one and draw a new one.
- When satisfied with the current ROI, click the Lock in button and close the pop-up window by clicking the red button in the top left corner (Mac) or the X button in the top right corner (PC) of the pop-up.
- A ROI can be deleted even once it is locked in by double-clicking on any of the perimeter points in the axial view of the main program window (not the pop-up).
- While ensuring the desired axial slice is in view, click on the Draw ROI button. In the pop-up window, scroll to zoom in/out and start single-clicking around the artery to trace it, as in Figure 4.
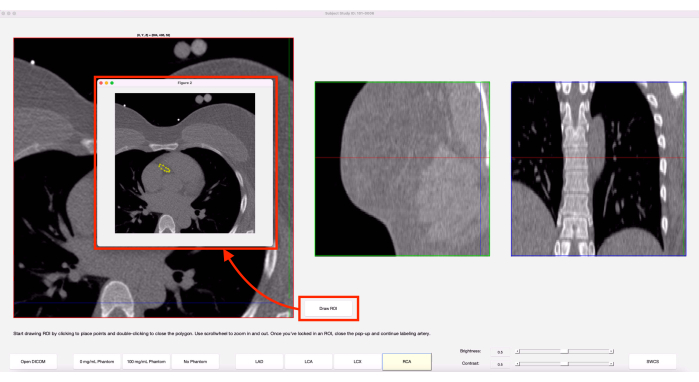
Figure 4: Draw ROI feature. When the Draw ROI option is chosen, a pop-up of the current axial slice appears. The yellow shows an ROI that was previously drawn on this slice. Please click here to view a larger version of this figure.
- Scroll up or down one slice in the axial view and repeat steps 3.8-3.9 until the end of the chosen artery is reached. When done, re-click on the finished artery's button to review the tracing of the artery and ensure no accidental points were placed.
NOTE: More than one point or ROI can be placed on any given axial slice. Extra lines connecting two ROIs on a slice can be ignored. If any slices for a given artery are not labeled, an error message will appear. Close the message and label the missed slice(s). - Move on to the next of the four arteries and repeat steps 3.6-3.10.
- When all four arteries have been traced, click the SWCS button in the bottom right corner to generate the results. The bottom left area will show the progress and will display "Done Processing" when finished. Close the program window by clicking the red button in the top left corner (Mac) or the X button in the top right corner (PC).
4. Accessing the results
- To access the results for the case just analyzed, open the files directory and navigate to the project's main folder. Go into the Meta_Data folder and notice that a new folder with the same name as the original data folder for that subject has appeared.
- Within this folder, there will be three types of documents: CSVs, PNGs, and PDFs. Review the PDFs to get the final SWCS and Agatston score for the case, as well as the weighting function used.
NOTE: The CSVs store the coordinates of the various points/ROIs placed when analyzing this subject. Having these CSVs will allow this subject's images to be reopened in the program on a later day and have the previous points/ROIs appear automatically. Any changes made to the case, when reopened, will be automatically reflected in the CSVs.
Access restricted. Please log in or start a trial to view this content.
Results
The representative results shown in this section display what successful use of the program entails. Here, a patient with an Agatston score greater than zero is used as an example. As discussed earlier, the results within a patient's metadata folder will have spreadsheets in the form of CSV files, images in the form of PNG files, and reports in the form of PDF files, as shown in Figure 5. The number of PNG files differs from case to case, since only snapshots of selected pixels with noticeab...
Access restricted. Please log in or start a trial to view this content.
Discussion
While the protocol for this program is relatively easy to follow, there are a few critical steps that are necessary for successful use and reliable results. Before starting, it is important to make sure the patient data that will be used in this program is anonymized to ensure patient confidentiality. The initial formatting and naming of the project's main folder must be correct for the program to recognize where to pull and place data. Incorrect naming and/or placement of folders, especially the Meta_Data folder, leads ...
Access restricted. Please log in or start a trial to view this content.
Disclosures
The authors declare that they have no conflicts of interest to disclose.
Acknowledgements
This work was supported by NIH grant R01ES029967.
Access restricted. Please log in or start a trial to view this content.
Materials
| Name | Company | Catalog Number | Comments |
|---|---|---|---|
| Calcium Hydroxyapatite | Sigma-Aldrich | 289396-100G | Suspended in EpoxAcast 690 resin for phantom creation |
| Clinical Cardiac CT Scanner | Siemens | SOMATOM Force Dual Source CT | Used for the source images; Any cardiac CT will be sufficient |
| EpoxAcast 690 | Smooth-On | 03641 | Used for phantom creation |
| MATLAB | Mathworks | R2019a | Requires Image Processing Toolbox and Statistics and Machine Learning Toolbox; Any version compatible with and able to run version R2019a scripts is sufficient |
| Standard Computer | N/A | N/A | macOS or Windows operating system |
| syngo.via | Siemens | VB60A_HF04 | Commercial software used for computing Agatston score for validation study |
References
- O'Malley, P. G., Taylor, A. J., Jackson, J. L., Doherty, T. M., Detrano, R. C. Prognostic value of coronary electron-bean computed tomography for coronary heart disease events in asymptomatic populations. The American Journal of Cardiology. 85 (8), 945-948 (2000).
- Budoff, M. J., et al. Assessment of coronary artery disease by cardiac computed tomography. Circulation. 114 (16), 1761-1791 (2006).
- Rumberger, J. A., Simons, D. B., Fitzpatrick, L. A., Sheedy, P. F., Schwartz, R. S. Coronary artery calcium area by electron-beam computed tomography and coronary atherosclerotic plaque area. Circulation. 92 (8), 2157-2162 (1995).
- Mautner, G. C., et al. Coronary artery calcification: assessment with electron beam CT and histomorphometric correlation. Radiology. 192 (3), 619-623 (1994).
- Agatston, A. S., et al. Quantification of coronary artery calcium using ultrafast computed tomography. Journal of the American College of Cardiology. 15 (4), 827-832 (1990).
- Shea, S., et al. Spatially weighted coronary artery calcium score and coronary heart disease events in the multi-ethnic study of atherosclerosis. Circulation: Cardiovascular Imaging. 14 (1), e011981(2021).
- Liang, C. J., Budoff, M. J., Kaufman, J. D., Kronmal, R. A., Brown, E. R. An alternative method for quantifying coronary artery calcification: the multi-ethnic study of atherosclerosis (MESA). BMC Medical Imaging. 12, 14(2012).
- McCollough, C. H., et al. Coronary artery calcium: a multi-institutional, multimanufacturer international standard for quantification at cardiac CT. Radiology. 243 (2), 527-538 (2007).
- Detrano, R., et al. Coronary calcium as a predictor of coronary events in four racial or ethnic groups. The New England Journal of Medicine. 358 (13), 1336-1345 (2008).
- Budoff, M., et al. Cardiovascular events with absent or minimal coronary calcification: The Multi-Ethnic Study of Atherosclerosis (MESA). American Heart Journal. 158 (4), 554-561 (2009).
- Hecht, H. S., et al. 2016 SCCT/STR guidelines for coronary artery calcium scoring of noncontrast noncardiac chest CT scans: A report of the Society of Cardiovascular Computed Tomography and Society of Thoracic Radiology. Journal of Cardiovascular Computed Tomography. 11 (1), 74-84 (2017).
- American College of Radiology. ACR-NASCI-SPR practice parameter for the performance and interpretation of cardiac computed tomography (CT). American College of Radiology. , (2021).
Access restricted. Please log in or start a trial to view this content.
Reprints and Permissions
