Drosophila is a well-established model for studying key molecules that regulate myogenesis. However, current methods are insufficient to determine mRNA transcriptional dynamics and spatial distribution within syncytia. To address this limitation, we optimized an RNA fluorescence in situ hybridization method allowing the detection and quantification of mRNAs at a single-molecule scale.
Method Article
Studying Muscle Transcriptional Dynamics at Single-molecule Scales in Drosophila
In This Article
Summary
Abstract
Skeletal muscles are large syncytia made up of many bundled myofibers that produce forces and enable body motion. Drosophila is a classical model to study muscle biology. The combination of both Drosophila genetics and advanced omics approaches led to the identification of key conserved molecules that regulate muscle morphogenesis and regeneration. However, the transcriptional dynamics of these molecules and the spatial distribution of their messenger RNA within the syncytia cannot be assessed by conventional methods. Here we optimized an existing single-molecule RNA fluorescence in situ hybridization (smFISH) method to enable the detection and quantification of individual mRNA molecules within adult flight muscles and their muscle stem cells. As a proof of concept, we have analyzed the mRNA expression and distribution of two evolutionary conserved transcription factors, Mef2 and Zfh1/Zeb. We show that this method can efficiently detect and quantify single mRNA molecules for both transcripts in the muscle precursor cells, adult muscles, and muscle stem cells.
Introduction
Adult skeletal muscles are made of differentiated multinucleated myofibers whose contractile properties generate movements. Muscle growth, maintenance, and regeneration rely upon muscle progenitors and muscle stem cells (MuSCs) that are specified during embryonic development1. The myogenic program is finely controlled by a set of core myogenic transcription factors (TFs) (e.g., Pax3/7, MYOD, Mef2, and ZEB)2,3,4. Deciphering the molecular mechanisms regulating muscle biology is important for elucidating fundamental myology-related questions and for possible therapeutic use in treating muscle-degenerative diseases.
Drosophila has a long history as a genetic model to study myogenesis5. It has recently emerged as a new model to investigate muscle regeneration6,7,8. The muscle structure and core myogenic programs are highly conserved between flies and mammals. For example, the TFs Mef2 and Zfh1/ZEB have a conserved function in regulating muscle development and regeneration3,9,10,11. Adult Drosophila muscles, such as the Indirect Flight Muscles (IFMs), are formed from a specific population of MuSCs, known as Adult Muscle Progenitors (AMPs)12. These AMPs are specified during embryogenesis and associate with epithelial structures such as wing and leg discs. Throughout embryonic and larval stages, AMPs remain undifferentiated until metamorphosis when they engage in differentiation and fusion to form the IFMs13,14. The TF Spalt major (spalt, salm) is expressed during flight muscle development and is necessary to determine their structural identity15. Mef2 is another important myogenic TF that is essential for adult muscle formation16,17. It is expressed in the AMPs and maintained in the adult IFMs10,18. While the majority of AMPs differentiate into functional muscles, a subset escapes differentiation and forms the adult MuSCs11. Similar to vertebrates, the TF Zfh1/ZEB is required to prevent premature differentiation of the adult MuSCs and to maintain their stemness9,10.
Gene expression dynamics have been proven to regulate various muscle biological processes19,20. The advent of high-throughput single-cell and single-nuclei RNA sequencing techniques has enabled a comprehensive exploration of these transcriptional dynamics21,22. One notable limitation of these approaches is their inability to provide the spatial distribution of mRNA molecules in the multinucleated muscle fibers. These features can be investigated by single-molecule fluorescence in situ hybridization (smFISH) that reveals two types of mRNA bodies: 1. Individual mRNA molecules spread out in the cytoplasm and representing the mature RNA and 2. A maximum of two bright nuclear foci correspond to the nascent transcript and reveal the transcriptionally active alleles23. Therefore, smFISH is a method of choice for individual mRNA molecule quantification, investigating their spatial distribution and providing snapshots of the gene transcriptional dynamics.
The smFISH method relies on a set of short fluorescent oligonucleotide probes specifically designed to be complementary to the target transcript. Upon annealing, it generates high-intensity point sources permitting the detection of mRNA at a single-molecule level using confocal microscopy24. This method is increasingly applied for a wide variety of cell types, including mammalian muscle tissues19,20. However, in Drosophila like other animal models, most of the knowledge about adult muscle gene expression is derived from bulk molecular assays, which lack quantitative information on the spatial location of mRNA molecules. Here we optimized a method for performing smFISH on muscle precursor cells and adult Drosophila muscles23,25. This protocol includes a fully automated analysis pipeline for nuclei segmentation and mRNA counting and localization.
Protocol
1. Wing disc and adult muscle dissection and preparation
NOTE: Clean up the dissection bench and all the dissection instruments with RNAse inhibitor solution (Table of Materials). Laboratory gloves should be worn during the whole experimental procedure.
- Wing disc
- Place the L3 staged larvae in cold 1x phosphate-buffered saline (PBS) (Figure 1A).
- Rinse the larvae 3x with 1x PBS and keep them in this solution for 5 min.
- Using two pairs of sharp forceps, hold the larva from the anterior part and pull and discard the rest of the body tissues (around 2/3).
- Hold both the first 1/3 of the larva with one pair of forceps and the mouth hooks with the other pair. Retract the mouth hooks inside the larva until it is fully inverted.
NOTE: Dissect approximately 30 larvae per experiment, to ensure adequate sample size for analysis. - Observe that the wing discs are closely associated with the two primary branches of the tracheae, which run along each side of the larva.
- Remove all the other larval components (leg discs and brain) to obtain a clean inverted larval carcass with a pair of wing discs attached to the trachea (Figure 1B).
- Place the samples in a 1 mL centrifuge tube and fix them in 4% paraformaldehyde (PFA) diluted in 1x PBS for 45 min at room temperature under agitation.
NOTE: The sample agitation is achieved by an oscillating stirrer (Table of Materials). - Wash the samples 3 x 5 min with 70% ethanol (EtOH, diluted in RNAse-free water) and store them in the same washing solution at 4 °C for at least 2 days and up to 1 week.
- Indirect flight muscles
- Anesthetize the adult flies on a CO2 fly pad and remove the heads, abdomens, legs, and wings.
- Place the dissected thoraxes in cold 1x PBS and continue doing so until all samples are dissected (Figure 1D).
- Prefix the thoraxes in 4% PFA, (1% Triton) for 20 min at room temperature under agitation.
- Rinse the samples 3 x 5 min with 1x PBT washing solution (1% Triton in 1x PBS).
- Position the thoraxes on a double-sided tape (Table of Materials) on a glass slide and bisect them with a sharp microtome blade to produce two hemi-thoraces (Figure 1E,F).
- Fix the samples in 4% PFA (1% Triton) for 45 min at room temperature under agitation.
- Wash 2 x 20 min with 1x PBT washing solution (1% Triton, 1x PBS) at room temperature under agitation.
- Place the hemi-thoraces in cold 1x PBS and use the forceps to gently isolate the IFMs from the hemi-thorace (Figure 1G).
NOTE: To achieve this, it is important to remove the cuticle as thoroughly as possible. - To permeabilize the samples, store the isolated IFMs in 70% EtOH solution for at least 2 days and up to 1 week at 4 °C.
NOTE: Isolate the IFMs from approximately 10 thoraxes per experiment to ensure adequate sample size for analysis.
2. Hybridization, immunostaining, and mounting
NOTE: Similar hybridization procedure is applied for both wing discs and IFMs samples. It is critical to isolate the wing discs from the larval carcasses and put them in 200 µL of Buffer A prior to starting the hybridization.
- Resuspend the probes in 400 µL of TE buffer (10 mM Tris-HCl, 1 mM EDTA, pH 8.0) for a final stock solution of 12.5 µM.
- Transfer the samples to a 0.5 mL centrifuge tube containing Buffer A (Table of Materials).
NOTE: By decreasing the volume of the container, it becomes easier to visualize the samples and avoid losing them during the washing process. - Wash the samples 2 x 20 min with Buffer A.
- Aspirate Buffer A, replace it with 400 µL of the hybridization buffer (Table of Materials), and prehybridize the samples for 30 min at 37 °C in a thermal mixer (Table of Materials).
- Dilute the probes to a final concentration of 125 nM for wing discs and 200 nM for adult muscles, in the hybridization buffer and add the primary antibody.
NOTE: The antibody dilution varies depending on the specific antibody being used (Table of Materials). Adding antibodies is optional. Users may opt to forego protein staining and instead use a similar smFISH protocol that does not include the addition of antibodies. - Aspirate the hybridization buffer and replace it with 100 µL of hybridization buffer containing the probe and the antibody.
- Incubate the samples in the dark at 37 °C for at least 16 h under 300 rpm agitation in a thermal mixer.
- Warm up an aliquot of Buffer A at 37 °C.
- Wash the samples for 3 x 10 min in the thermal mixer at 37 °C under 300 rpm agitation.
- During the last wash, dilute the secondary antibody (1/200) and DAPI (1/10,000) in Buffer A and incubate the samples in this solution at 37 °C for at least 1 h.
- Wash the samples for 3 x 20 min with Buffer B (Table of Materials).
- Carefully transfer the samples on a microscope slide, wipe off the residual Buffer B, and add 30 µL of mounting medium, and cover with an 18 x 18 mm coverslip. Use a nail polish to seal the preparation.
- Store the samples for up to 1 week at 4 °C.
NOTE: However, it is recommended to perform the imaging as soon as possible to avoid probe signal degradation.
3. Imaging
- Acquire images with an xyz acquisition mode using a confocal microscope equipped with 40x and 63x oil immersion objectives (Table of Materials). The smFISH signal is detected by the HyD detector via a photon counting mode.
- Locate the samples using the DAPI signal and UV lamp.
- To image the wing disc-associated muscle progenitors and IFMs (Figure 2 and Figure 3), apply the following setup for laser lines and emission filters: select DAPI (excitation (ex.) 405 nm, emission (em.) 450 nm), Alexa Fluor 488 (ex. 496 nm, em. 519 nm), and Quasar 670 for the smFISH probes (ex. 647 nm, em. 670 nm).
- To image the adult MuSCs (Figure 2D), apply the following setup for laser lines and emission filters: select DAPI (ex. 405 nm, em. 450 nm), Alexa Fluor 488 (ex. 496 nm, em. 519 nm), Alexa Fluor 555 (ex. 555 nm, em. 565 nm), and Quasar 670 for the smFISH probes (ex. 647 nm, em. 670 nm).
NOTE: For the imaging, the wavelengths can be adapted according to the dyes associated with secondary antibodies and probes. - Save the confocal images as .TIFF files.
4. Post imaging analysis
- To get started, launch ImageJ and navigate to the Plugins menu. From there, select Macros | Edit to open the macros source code.
NOTE: This will enable adjustment of the parameters as needed, and if required, modify the folder directory for each channel within the macro's source code. - To follow this protocol and quantify Mef2 smFISH spots in larvae, use the following settings: Log_radius = 3.0 and Log_quality = 20.0. Segement Mef2-positive nuclei with blur = 2; nucleus_scale_parameter = 30; nucleus_threshold = -8.0; nucleus_size = 300.
- In muscle fibers, use the following parameters: Log_radius = 2.5; Log_quality = 60.0; blur = 2; nucleus_scale_parameter = 100; nucleus_threshold = 0.0; nucleus_size = 300.
- To initiate the macro, simply execute the run command and wait for the macro to automatically load all images from the designated folder and quantify them in a sequential manner.
NOTE: Please note that the duration of this process may vary from a few seconds to several hours, depending on the volume of data being analyzed. - Look for the results displayed in two new .csv files: file_FISH_results and file_nuclei_results. The first shows the number of transcriptional spots and their average and maximum intensities. The second one gives both the total number of nuclei and the number of spots inside each nucleus.
Results
In this protocol, we used commercially produced probes targeting Mef2 and zfh1 mRNA. We designed the probes with the manufacturer's FISH probes designer (Table of Materials). The Mef2 set targets the exons common to all Mef2 RNA isoforms (from exon 3 to exon 10). The zfh1 set targets the third exon common to both zfh1-RB and zfh1-RE isoforms10. Both probes are conjugated to the Quasar 670 fluorescent dye.
We generated a macro in-house that was compatible with ImageJ software to automatically analyze the raw .tif data. The macro allows the 3D segmentation of the nuclei by Cellpose26 with the Fiji plugin BIOP and the transcriptional spot quantification by a Laplacian of Gaussian as implemented in the Trackmate plugin27. MorpholibJ plugin28 is used for postprocessing (Supplemental File 1).
As a first step, we performed smFISH on wing imaginal discs, where Mef2 and zfh1 are known to be expressed in the AMPs. These data show that both transcripts are uniformly detected in the AMPs population co-stained with either Mef2 or Zfh1 antibodies (Figure 2A,B). Active transcription sites (TS) can be revealed and distinguished from mature mRNA by smFISH as they tend to be larger and have more intense signals than individual cytoplasmic transcripts or mature nuclear transcripts. Consistently, higher magnifications of AMPs distinguish between TS foci and mature mRNA scattered in the cytoplasm (Figure 2A',B'), validating the sensitivity of this smFISH protocol. It should, however, be mentioned that we observed one active TS per nucleus for both zfh1 and Mef2 (Figure 2A',B'). These data further validate the accuracy of the probe design since Mef2 and zfh1 transcriptional patterns in the AMPs colocalize with the detection of their respective proteins (Figure 2).
In a second step, we examined the transcription site and distribution of Mef2 and zfh1 mRNAs in differentiated adult IFMs and associated stem cells (Figure 2C,D). These data clearly illustrate Mef2 TSs in the syncytial muscle nuclei and Mef2 mRNA distribution throughout the cytoplasm (Figure 2C,C'). Zfh1 specifically marks the MuSCs population10,11. Using this smFISH protocol, we successfully detected zfh1 transcription in MuSCs marked by Zfh1-Gal4 > GFP expression. Higher magnification illustrates the detection of both zfh1 TS and cytoplasmic single mRNAs (Figure 2D').
Finally, we used our in-house-built ImageJ macro to quantitatively analyze Mef2 transcriptional dynamics and spatial distribution. The computational pipeline can efficiently detect and segment Mef2 spots and muscle nuclei (Figure 3A-C). However, due to signal-to-noise ratio issues, some spots may not be detected in certain cases (Figure 3A',B'). We used this automated method to investigate whether Mef2 mRNA abundance varies between muscle precursor cells (AMPs) and differentiated adult IFMs. Our analysis shows that the number of Mef2 mRNA per nuclei in adult IFMs and the AMPs are not significantly different (Figure 3D).
To gain insight into the spatial distribution of Mef2 transcripts in adult IFM muscles, we quantified the fraction of cytoplasmic versus nuclear Mef2 mRNA spots (Figure 3E,F). Using our program, we counted both the total number of Mef2 mRNA spots and the number of Mef2 mRNA spots overlapping with nuclei staining (Mef2). Subtracting the nuclei-associated mRNA from the total mRNA number provides the number of cytoplasmic mRNA spots. Our findings reveal that approximately 92% of Mef2 mRNA is present in the cytoplasm, while the remaining 8% is associated with muscle nuclei, as shown in Figure 3E,F.
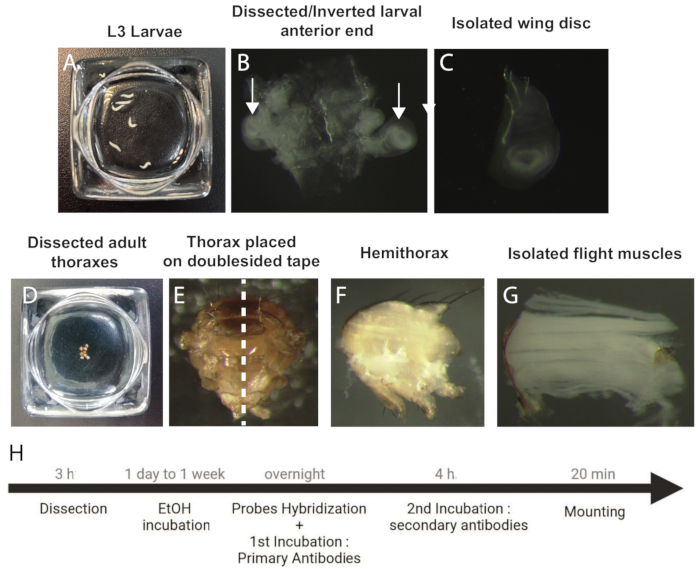
Figure 1: Procedure to dissect and prepare wing discs and IFM samples for smFISH. (A) L3 staged larvae. (B) Dissected and inverted anterior end of the larva. Arrows indicate the wing discs. (C) Isolated wing disc. (D) Dissected adult thoraxes. (E) Adult thorax oriented on a doublesided tape prior to bisection (dotted line). (F) Adult hemithorax. (G) Isolated IFMs. (H) Workflow of the smFISH protocol. Abbreviations: IFMs = indirect flight muscles; smFISH = single-molecule RNA fluorescence in situ hybridization; EtOH = ethanol. Please click here to view a larger version of this figure.
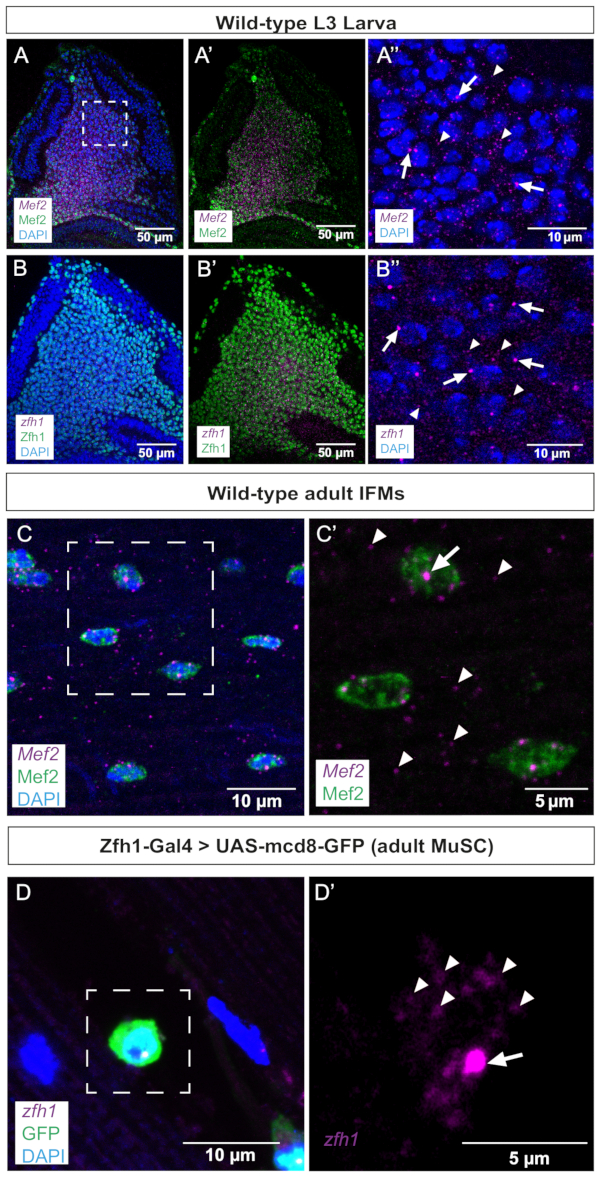
Figure 2: Representative images of Mef2 and zfh1 smFISH in wing discs and adult IFMs. (A,B) Mef2 and zfh1 mRNAs (purple) are detected uniformly in AMPs and co-localize with (A,A') Mef2 and (B,B') Zfh1 proteins (green), respectively. (A'',B'') Higher magnification of the AMPs. (C) Mef2 mRNAs and Mef2 protein are detected in adult IFMs. (C') Higher magnification of the boxed region in C. (D) Zfh1-Gal4 >UAS-mCD8GFP expression (green) labels adult MuSCs. zfh1 RNA is detected in adult MuSCs. (D') Higher magnification of the boxed region in D. Zfh1 transcription start sites and single mRNAs are indicated by arrows and arrowheads, respectively. DAPI staining (blue). Scale bars = 50 µm (A,B,A',B'), 10 µm (A",B",C,D), 5 µm (C',D'). Abbreviations: IFMs = indirect flight muscles; smFISH = single-molecule RNA fluorescence in situ hybridization; AMPs = adult muscle progenitors; MuSCs = muscle stem cells; DAPI = 4',6-diamidino-2-phenylindole; GFP = green fluorescent protein. Please click here to view a larger version of this figure.

Figure 3: Quantification of Mef2 transcription and cytoplasmic mRNA accumulation by smFISH. (A) Distribution of Mef2 transcripts (purple) and Mef2 protein (green) in wildtype adult IFMs. (A') Higher magnification of boxed region in A. Transcription start sites and single mRNAs are indicated by arrows and arrowheads, respectively. (B,C) Automatic Mef2 spots finding and nuclear segmentation. Cytoplasmic and nuclear Mef2 mRNAs are indicated in green and magenta, respectively. (B',C') Higher magnifications of boxed regions in B and C. Asterisks indicate spots that are not counted by the macro. (D) Example of Mef2 spot quantification in AMPs and adult IFMs, relative to the total number of nuclei. (p = 0,0785, Student's t-test, wing discs (n = 4), IFMs (n = 11)). (E) Example of quantification of Mef2 spot distribution in adult IFMs. (*** p< 0.0007, Student's t-test, n = 5). (F) Percentage of Mef2 mRNA spots detected inside and outside the nuclei (n = 5). Scale bars = 10 µm (A,A'). Abbreviations: IFMs = indirect flight muscles; smFISH = single-molecule RNA fluorescence in situ hybridization; AMPs = adult muscle progenitors. Please click here to view a larger version of this figure.
Supplemental File 1: Macro used for postprocessing. Please click here to download this File.
Discussion
The application of the smFISH method has gained popularity in recent times, with its use extending to various cell types and model organisms. However, in the case of Drosophila, the majority of knowledge about adult muscle gene expression is derived from bulk molecular assays, which fail to provide quantitative information on the precise spatial location of mRNA molecules. To address this gap, we have optimized a method for performing smFISH on muscle precursor cells and adult Drosophila muscles. This approach has been adapted from a previously published protocol23 and optimized for Drosophila muscle tissues.
The major obstacle in obtaining high-quality smFISH images is the thickness of adult muscles, which hinders the optimal penetration of probes. Therefore, it is crucial to separate the adult muscles from the other tissues of the animal and carry out the hybridization process with mild agitation. This particular step ensures effective permeabilization of the tissues.
Another critical aspect is that the signal-to-noise ratio can cause the computational pipeline to fail in detecting certain mRNA spots. We found that increasing the signal-to-noise ratio can be achieved by finding the optimal concentration of probes. The optimal dilution may differ depending on the composition of each probe set, including the conjugated dye and oligonucleotide composition. We recommend trying different dilutions; a final dilution of 200 nM yielded the best signal-to-noise ratio for adult tissues in these experiments.
With the smFISH method, it is possible to quantify the number of newly synthesized RNAs at the TS foci. When a gene is actively transcribed, multiple nascent RNAs are produced concurrently at the TS. As a result, the TS's intensity will surpass that of mature cytoplasmic RNA, and this feature, combined with its nuclear localization, can differentiate the TS from individual cytoplasmic RNAs. In the context of muscle biology, TS detection and quantification are particularly important for determining the synchronization of transcription of a specific gene among muscle nuclei within the same syncytium. However, this computational pipeline is not designed to differentiate between cytoplasmic mRNA and TS signals. As an alternative, we suggest combining this smFISH method with other well-established smFISH analysis tools, such as BayFISH or FISH-quant29,30. These tools have been proven to facilitate automated segmentation and fluorescence intensity calculations of RNA aggregates with remarkable precision.
Finally, while smFISH detects mRNA molecules with high spatial resolution, it is limited to analyzing a small number of mRNA at the same time. Multiscale methods like merFISH (multiplexed error-robust fluorescence in situ hybridization) enable the simultaneous analysis of a large number of different mRNA31. By combining oligonucleotide probes and error-correcting codes, this method facilitates the detection of hundreds of RNA species in single cells.
Disclosures
The authors have no conflicts of interest to disclose.
Acknowledgements
We thank Alain Vincent for his critical reading of the manuscript. We thank Ruth Lehmann for providing the Zfh1 antibody. We acknowledge the help of Stephanie Dutertre and Xavier Pinson for confocal microscopy at the MRic Imaging Platform. EL is supported by PhD fellowship from ministère de l'enseignement supérieur et de la recherche scientifique. NA is supported by the AFM-Telethon Ph.D. fellowship 23846. TP is funded by a Chan Zuckerberg Initiative DAF grant to T.P. (2019-198009). HB is supported by CNRS, the Atip Avenir program, and the AFM-Telethon trampoline grant 23108.
Materials
| Name | Company | Catalog Number | Comments |
|---|---|---|---|
| Confocal microscope SP8 | Leica | SP8 DMI 6000 | |
| DAPI | ThermoFisher | 62248 | |
| Double-sided tape | Tesa | 57910-00000 | |
| Dumont #55 Forceps | Fine Science Tools | 11255-20 | |
| Formaldehyde 16% | Euromedex | EM-15710 | |
| Mef2 antibody | DHSB | NA | |
| PBS 10x | Euromedex | ET330 | |
| RNaseZAP | Sigma-Aldrich | R2020 | |
| Stellaris probes | LGC | NA | |
| Stellaris RNA FISH Hybridization Buffer | LGC | SMF-HB1-10 | |
| Stellaris RNA FISH Wash Buffer A | LGC | SMF-WA1-60 | |
| Stellaris RNA FISH Wash Buffer B | LGC | SMF-WB1-20 | |
| Swann-Morton Blades | Fisher scientific | 0210 | |
| ThermoMixer | Eppendorf | 5382000015 | |
| Triton X-100 | Euromedex | 2000 | |
| UAS-mCD8::GFP line | Bloomington | RRID:BDSC_5137 | |
| Ultrapure water | Sigma-Aldrich | 95284 | |
| Watch Glass, Square, 1 5/8 in | Carolina | 742300 | |
| Zfh1 antibody | Gifted by Ruth Leahman | ||
| Zfh1-Gal4 | Bloomington | BDSC: 49924, FLYB: FBtp0059625 |
References
- Relaix, F., et al. Perspectives on skeletal muscle stem cells. Nature Communications. 12 (1), 692(2021).
- Chal, J., Pourquie, O. Making muscle: skeletal myogenesis in vivo and in vitro. Development. 144 (12), 2104-2122 (2017).
- Taylor, M. V., Hughes, S. M. Mef2 and the skeletal muscle differentiation program. Seminars in Cell and Developmental Biology. 72, 33-44 (2017).
- Siles, L., et al. ZEB1 imposes a temporary stage-dependent inhibition of muscle gene expression and differentiation via CtBP-mediated transcriptional repression. Molecular and Cellular Biology. 33 (7), 1368-1382 (2013).
- Weitkunat, M., Schnorrer, F. A guide to study Drosophila muscle biology. Methods. 68 (1), 2-14 (2014).
- Boukhatmi, H. Drosophila, an integrative model to study the features of musclestem cells in development and regeneration. Cells. 10 (8), 2112(2021).
- Bothe, I., Baylies, M. K. Drosophila myogenesis. Current Biology. 26 (17), R786-R791 (2016).
- Catalani, E., et al. RACK1 is evolutionary conserved in satellite stem cell activation and adult skeletal muscle regeneration. Cell Death Discovery. 8 (1), 459(2022).
- Siles, L., Ninfali, C., Cortes, M., Darling, D. S., Postigo, A. ZEB1 protects skeletal muscle from damage and is required for its regeneration. Nature Communications. 10 (1), 1364(2019).
- Boukhatmi, H., Bray, S. A population of adult satellite-like cells in Drosophila is maintained through a switch in RNA-isoforms. Elife. 7, e35954(2018).
- Chaturvedi, D., Reichert, H., Gunage, R. D., VijayRaghavan, K. Identification and functional characterization of muscle satellite cells in Drosophila. Elife. 6, e30107(2017).
- Gunage, R. D., Reichert, H., VijayRaghavan, K. Identification of a new stem cell population that generates Drosophila flight muscles. Elife. 3, e03126(2014).
- Figeac, N., Daczewska, M., Marcelle, C., Jagla, K. Muscle stem cells and model systems for their investigation. Developmental Dynamics. 236 (12), 3332-3342 (2007).
- Aradhya, R., Zmojdzian, M., Da Ponte, J. P., Jagla, K. Muscle niche-driven insulin-Notch-Myc cascade reactivates dormant adult muscle precursors in Drosophila. Elife. 4, e08497(2015).
- Schonbauer, C., et al. Spalt mediates an evolutionarily conserved switch to fibrillar muscle fate in insects. Nature. 479 (7373), 406-409 (2011).
- Bryantsev, A. L., Baker, P. W., Lovato, T. L., Jaramillo, M. S., Cripps, R. M. Differential requirements for Myocyte Enhancer Factor-2 during adult myogenesis in Drosophila. Developmental Biology. 361 (2), 191-207 (2012).
- Soler, C., Han, J., Taylor, M. V. The conserved transcription factor Mef2 has multiple roles in adult Drosophila musculature formation. Development. 139 (7), 1270-1275 (2012).
- Soler, C., Taylor, M. V. The Him gene inhibits the development of Drosophila flight muscles during metamorphosis. Mechanisms of Development. 126 (7), 595-603 (2009).
- Pinheiro, H., et al. mRNA distribution in skeletal muscle is associated with mRNA size. Journal of Cell Science. 134 (14), jcs256388(2021).
- Denes, L. T., Kelley, C. P., Wang, E. T. Microtubule-based transport is essential to distribute RNA and nascent protein in skeletal muscle. Nature Communications. 12 (1), 6079(2021).
- Li, H., et al. Fly Cell Atlas: A single-nucleus transcriptomic atlas of the adult fruit fly. Science. 375 (6584), eabk2432(2022).
- Santos, M. D., et al. Extraction and sequencing of single nuclei from murine skeletal muscles. STAR Protocols. 2 (3), 100694(2021).
- Raj, A., van den Bogaard, P., Rifkin, S. A., van Oudenaarden, A., Tyagi, S. Imaging individual mRNA molecules using multiple singly labeled probes. Nature Methods. 5 (10), 877-879 (2008).
- Femino, A. M., Fay, F. S., Fogarty, K., Singer, R. H. Visualization of single RNA transcripts in situ. Science. 280 (5363), 585-590 (1998).
- Raj, A., Tyagi, S. Detection of individual endogenous RNA transcripts in situ using multiple singly labeled probes. Methods in Enzymology. 472, 365-386 (2010).
- Stringer, C., Wang, T., Michaelos, M., Pachitariu, M. Cellpose: a generalist algorithm for cellular segmentation. Nature Methods. 18 (1), 100-106 (2021).
- Tinevez, J. Y., et al. TrackMate: An open and extensible platform for single-particle tracking. Methods. 115, 80-90 (2017).
- Legland, D., Arganda-Carreras, I., Andrey, P. MorphoLibJ: integrated library and plugins for mathematical morphology with ImageJ. Bioinformatics. 32 (22), 3532-3534 (2016).
- Mueller, F., et al. FISH-quant: automatic counting of transcripts in 3D FISH images. Nature Methods. 10 (4), 277-278 (2013).
- Gomez-Schiavon, M., Chen, L. F., West, A. E., Buchler, N. E. BayFish: Bayesian inference of transcription dynamics from population snapshots of single-molecule RNA FISH in single cells. Genome Biology. 18 (1), 164(2017).
- Chen, K. H., Boettiger, A. N., Moffitt, J. R., Wang, S., Zhuang, X. RNA imaging. Spatially resolved, highly multiplexed RNA profiling in single cells. Science. 348 (6233), aaa6090(2015).
Reprints and Permissions
