This study provides experimental data for treating immunoglobulin A nephropathy (IgAN) with Dioscin (DIO), the active ingredient of Dioscoreae Nipponicae Rhizoma (DNR), and a paradigm for studying herbal medicine's effects and underlying mechanisms in vivo and in vitro.
Method Article
Dioscin Mediated IgA Nephropathy Alleviation by Inhibiting B Cell Activation In Vivo and Decreasing Galactose-Deficient IgA1 Production In Vitro
* These authors contributed equally
In This Article
Summary
Abstract
The increase of circulating galactose-deficient IgA1 (Gd-IgA1) is caused by excessive activation of IgA-positive secretory cells in the process of mucosal immune responses, which is a critical link in the pathogenesis of IgA nephropathy (IgAN). Peyer's patch, the prominent place where B lymphocytes are transformed into IgA-secreting plasma cells, is the primary source of IgA. In addition, the lower expression of core 1β-1,3-galactosyltransferase (C1GalT1) and its molecular chaperone, C1GalT1-specific molecular chaperone (Cosmc), is related to abnormal glycosylation of IgA1 in IgAN patients. Our clinical experience shows that Dioscoreae Nipponicae Rhizoma's (DNR) herbal medicine can relieve proteinuria and hematuria and improve renal function in IgAN patients. Dioscin (DIO) is one of the main active ingredients of DNR, which has various pharmacological activities. This study explores DIO's possible mechanism in treating IgAN.The IgAN model mouse was established by mucosal immune induction. The mice were divided into the control, model, and DIO gavage groups. The glomerular IgA deposition in mice, renal pathological changes, and B cell markers CD20 and CXCR5 expression in Peyer's patch were detected by immunofluorescence and immunohistochemistry. After lipopolysaccharide (LPS) stimulation, DIO's effects on DAKIKI cells proliferation, IgA and Gd-IgA1 secretion, C1GalT1, and Cosmc expression were studied by cell counting kit-8 (CCK-8) assay, enzyme-linked immunosorbent assay (ELISA) test, quantitative real-time polymerase chain reaction (QRT-PCR), and western blotting (WB). In in vivo studies, IgA deposition accompanied by glomerular mesangial hyperplasia and increased expression of CD20 and CXCR5 in Peyer's patch in the IgAN model mouse was alleviated by DIO. In vitro studies showed 0.25 µg/mL to 1.0 µg/mL DIO inhibited LPS-induced DAKIKI cell proliferation, IgA and Gd-IgA1 secretion, and up-regulated the mRNA and protein expression of C1GalT1 and Cosmc. This study demonstrates that DIO may reduce Gd-IgA1 production by inhibiting excessive activation of IgA-secreting cells and up-regulating C1GALT1/Cosmc expression.
Introduction
IgA Nephropathy (IgAN) is the most common type of primary glomerulonephritis, for which there is no specific treatment, and it remains a significant cause of end-stage renal disease1. Although the pathogenesis of IgAN is still not fully understood, the "multi-hit hypothesis" is generally accepted and supported by a large body of clinical and experimental research evidence2. The pathogenesis of IgAN involves activating B cells and producing Galactose-deficient IgA1 (Gd-IgA1)3. The increase in circulating Gd-IgA1 due to the excessive proliferation and activation of IgA-secreting cells during the mucosal immune response is a critical link in the pathogenesis of IgAN4,5,6. As the central place for the proliferation and activation of B lymphocyte phenotype conversion to IgA-secreting cells, Peyer's patch is the primary source of IgA secretion, closely related to the occurrence and development of IgAN7,8. In addition, the proliferation of IgA1-secreting cells, as well as expression of Core 1β-1,3-galactosyltransferase(C1GalT1) and C1GalT1-specific molecular chaperone (Cosmc), were associated with abnormal glycosylation of IgA1, which causes GD-IgA1 production in IgAN patients6,9.
Clinical study on IgAN treatment with herbal medicine has progressed in recent years. Yiqi Qingjie Formula is an essential formula for treating IgAN by the Department of Nephrology of Guang'anmen Hospital. The previous study of our group found that Gd-IgA1 decreased in the serum of IgAN patients after treatment with Yiqi Qingjie Formula. As one of the most used herbs in the Yiqi Qingjie Formula, Dioscoreae Nipponicae Rhizoma (DNR) is the dried rhizome of Dioscorea Nipponica Makino, which has various functions such as regulating immunity, suppressing inflammation, relieving cough and asthma10,11. Several scholars treated IgAN with DNR and achieved good results12,13,14. As the main active ingredient in DNR15, Dioscin (DIO) lowers uric acid, inhibits fibrosis, inhibits inflammatory response, and anti-oxidative stress16,17. Therefore, DIO may have a novel action mechanism to inhibit the cellular secretion of excessive Gd-IgA1 and exert specific kidney protection effects. Still, no study has been reported on DIO's action mechanism for treating IgAN.
To explore the potential therapeutic mechanism of DIO on IgAN and provide a new method for the treatment of IgAN, we carried out experiments for the therapeutic effects of DIO on IgAN in vivo and in vitro.
Protocol
The ethics committee of Guanganmen Hospital approved this experiment (animal experiment ethical approval number: IACUC-GAMH-2023-003).
1. Preparing mice for the experimental procedure
- Raise 22 SPF-grade male Balb/c mice (6-7 weeks old, body weight 20-25 g) in the animal facility of the hospital/research center. Divide the animals into control (n = 8) and model (n = 14) groups using the random number table method.
- After 1 week of adaptive rearing in the laboratory cage, feed the model group (IgAN group) with 0.1% bovine gamma globulin (BGG) solution in acidified water containing 6 mmol/L HCl for 9 weeks according to the modeling protocol of Zou et al.18.
- Inject 0.1 mL of 0.1% BGG solution in saline into the tail vein for 3 consecutive days while continuing to drink BGG solution to prepare an IgAN experimental mouse model18.
- Let the control group freely drink 6 mmol/L HCl acidified water without BGG for 9 weeks. Inject the corresponding volume of saline into the tail vein for consecutive 3 days.
NOTE: The control and model groups were fed the same quality as normal feed. - After the tail vein injection, select 2 mice in the control group and 2 mice in the model group randomly and examine them by proteinuria, light microscopy, and immunofluorescence to determine whether the modeling was successful.
NOTE: No food is provided to the animals, but they are not prohibited from water; record urine output. - Collect urine for 24 h by metabolic cages and centrifuge it at 400 x g for 5 min; discard urine sediment. After a 10-fold dilution of the supernatant, measure proteinuria concentration using a urine protein assay kit and then multiply by the dilution factor and urine volume to obtain 24 h of total urine protein.
NOTE: Microscopy and immunofluorescence methods are shown in sections 3 and 4, respectively. - After successfully preparing the model, divide 12 mice in the model group into 6 mice, each in the model group (IgAN group) and DIO gavage group (DIO group), according to the random number table method.
- Let the control group continue to drink 6 mmol/L HCl acidified water without BGG, and the model group 0.1% BGG solution composed of acidified water containing 6 mmol/L HCl. Calculate the dose of DIO group gavage administration according to the dose conversion formula of pharmacological experimental methodology (converted according to the human body mass of 70 kg)19. Gavage DIO tablets 0.06 g/kg once a day for 8 weeks.
- After 8 weeks of gavage, anesthetize the mice intraperitoneally with 0.4% pentobarbital sodium (60 mg/kg), and after confirming proper anesthetization by toe pinch, isolate kidneys and Peyer's patch for subsequent light microscopy and immunohistochemistry analyses.
NOTE: The scheme for the in vivo model is in Supplementary Figure 1.
2. Histological analysis
- Paraffin sections for kidneys and Peyer's patch
- Fix 3 mm thick kidney tissues or 1 Peyer's patch with 4% paraformaldehyde for 24 h, dehydrate with gradient ethanol and xylene. Dip in wax for 2 h, seal, and freeze.
- Cut 2 µm thick kidney sections and 4 µm thick Peyer's patch sections and spread them in warm water. Scoop up the unfolded slices with a clean glass slide and bake them in a constant temperature oven at 40 °C for 1 h. Start staining after the pre-processing of the specimen.
NOTE: Take the coronal surface of the hilar part of the kidney, with a thickness of 3 mm tissue block.
- Dewax and stain the paraffin sections at room temperature (RT) for 10 min with periodic acid solution, avoiding light. Rinse with distilled water and wipe dry-stained with Schiff's staining solution for 20-30 min, avoiding light. Rinse with distilled water until the sections were red under the microscope.
- Place the sections in hematoxylin staining solution, stain nuclei for 3 min (nuclei stained too profoundly can be divided by ethanol hydrochloride), and rinse with running water until the slides are colorless.
- Perform routine dehydration with gradient concentrations of ethanol and xylene, seal the sections with neutral gum, and observe under a microscope. PAS-positive is red, and the nucleus is blue.
3. Immunohistochemical analysis of the Peyer's patch
- Prepare paraffin sections of the Peyer's patch as described in step 2.1.
NOTE: The thickness of the sections for Immunohistochemical and subsequent immunofluorescence is 4 µm. - Dewax the paraffin sections:
- Put the sections into xylene I for 5 min, xylene II for 5 min, and xylene III for 5 min.
- Further, rinse the slides in anhydrous ethanol I for 5 min, anhydrous ethanol II for 5 min, 85% alcohol for 5 min, 75% alcohol for 5 min. Then rinse the slides in distilled water.
- Antigen retrieval
- Prepare 50x stock solution of sodium citrate and dilute with distilled water to 1x for use. Heat it in an autoclave for 2 min, then place the slices in the autoclave, ensuring that the liquid level exceeds the level of the slices.
- Heat at high temperature for 5 min, then allow the slides to cool naturally. Wash the slices three times with PBS solution for 5 min each.
- Blocking of endogenous peroxidase: Mark the borders of the tissue in a circle with an immunohistochemical pen. Incubate the sections in 3% hydrogen peroxide solution for 15 min at RT, protected from light, and wash the sections three times with PBS solution for 5 min each time.
- Serum blocking: Block the sections by dropping 10% goat serum on the tissue sections marked for 30 min at RT. Ensure that the sections are evenly covered with the stain.
- Primary antibody incubation: Gently shake off the blocking solution and add a proportion of the prepared primary antibody (CD20 [1:800]; CXCR5 [1:800]) to the section. Place the section flat in a wet box and incubate overnight at 4 °C.
NOTE: Add a small amount of water to the wet box to prevent evaporation of the antibody. - Secondary antibody incubation: Wash the sections thrice with PBS solution for 5 min each time. Remove PBS by shaking the sections dry, cover the tissue with a drop of secondary antibody (HRP-label) of the related species of the primary antibody, and incubate at RT for 50 min.
- 3,3'-diaminobenzidine (DAB) homogenization: Wash the sections with PBS solution thrice for 5 min each. After shaking the sections dry, drop the freshly prepared DAB chromogenic solution on the sections. Observe the color development time under the microscope; the positive is brownish-yellow. Rinse with tap water to terminate the color development.
- Staining nuclei: Re-stain with hematoxylin for about 1 min, wash with tap water, and then rinse for 10 min with tap water to return to blue.
- Dehydration and sealing:
- Place the sections in 75% alcohol for 5 min and 85% alcohol for 5 min. Place the sections in anhydrous ethanol I for 5 min, anhydrous ethanol II for 5 min, and anhydrous ethanol III for 5 min.
- Wash the sections in xylene I for 5 min, take them out to dry slightly and seal the sections with neutral gum.
- Image acquisition: Collect Images by microscopic examination and analyze by halo software for panoramic image analysis of the tissue.
NOTE: Hematoxylin-stained nuclei are blue, and DAB positive expression is observed as brownish-yellow.
4. Renal IgA immunofluorescence
- Prepare paraffin sections for kidneys as described in step 2.1.
- Dewax paraffin sections:
- Put the sections into xylene I for 5 min, xylene II for 5 min, and xylene III for 5 min. Treat the sections in anhydrous ethanol I, anhydrous ethanol II, 95% ethanol, 90% ethanol, 80% ethanol, 70% ethanol, and 50% ethanol, each for 5 min, and wash with distilled water.
- Proteinase K retrieval: Shake the sections dry and draw a circle around the tissue section with a histochemical pen. Add the proteinase K working solution (1:9 ratio of stock solution and PBS) dropwise to cover the tissue and incubate at 37 °C for 30 min. Wash the sections three times with PBS for 5 min each.
- Penetrating the cell membrane: Shake the sections dry slightly and then cover them with 0.1% Triton. Incubate for 20 min at RT, and wash the sections three times with PBS for 5 min each.
- Blocking: Add 10% goat serum dropwise to cover the tissue evenly for blocking at RT for 30 min.
- Primary antibody incubation: Add an appropriate amount of goat anti-mouse AF488-conjugate IgA antibody (1:500) dropwise to cover the tissue uniformly and incubate overnight at 4 °C.
- Staining nuclei: Wash the slices thrice with PBS for 5 min each. After removing the PBS, add the 4′,6-diamidino-2-phenylindole (DAPI) stain dropwise on the sections and incubate for 15 min at RT, protected from light.
- Wash and seal the sections: Wash the sections thrice with PBS for 5 min, then seal them with an antifade mounting medium.
- Microscopy and photography: Observe the sections under a fluorescent microscope and take images.
NOTE: For DAPI, ultraviolet excitation is wavelength 330-380 nm, and the emission wavelength is 420 nm, blue light. Fluorescein isothiocyanate (FITC) excitation wavelength is 465-495 nm, and the emission wavelength is 515-555 nm, green light.
5. Cell culture
- Obtain human B lymphocyte line DAKIKI from ATCC, USA. Culture DAKIKI cells in RPMI-1640 medium supplemented with 10% FBS and 1% penicillin-streptomycin.
- Culture the cells in a 37 °C, 5% CO2 incubator and sub-culture them every 2-3 days. Use cells at the logarithmic growth phase for all experiments.
- At 70%-80% confluency, collect the cells with a sterile pipette and centrifuge the cells at 140 x g for 5 min. Discard the supernatant, resuspend with the serum-free medium, and after 24 h, leave all cells in a quiescent period for subsequent treatment.
6. LDH cytotoxicity assays for screening safe concentrations of DIO on normal DAKIKI cells
- Seed DAKIKI cells in 96-well plates at a density of 4x10⁵ cells/well and set up a Low control group, a High control group, and different concentrations of DIO (0.25, 0.5, 1.0, 2.0, 4.0, 8.0 µg/mL). Incubate in 5% CO2, 37 °C incubator for 24 h after corresponding treatment according to the grouping method.
- According to the instructions of the cytotoxicity detection kit, add 5 µL of lysate per well in the high control group, and then place the plate in a 5% CO2, 37 °C incubator for 15 min.
- Take out the plate, add 100 µL of the reaction mixture to each well, incubate in the dark for 10 min at RT, and then add 50 µL of the stop reaction solution. Measure the OD value at 490 nm on the microplate reader as soon as possible.
- Calculate the LDH release rate of different concentrations of DIO and ≤10% as the maximum dose administered according to the formula: LDH release rate = (experimental well LDH - low control LDH) / (high control LDH - low control LDH) x 100%.
7. CCK-8 assay for detecting the effect of DIO on DAKIKI cell proliferation
- Based on the results of our previous experiments20, establish an IgAN model using LPS 40 µg/mL to induce DAKIKI cells.
- Then, seed 4x10⁵ cells/well in 96-well plates and divide into the control, model, and DIO low, medium, and high concentration groups (0.25 µg/mL, 0.5 µg/mL, and 1.0 µg/mL). Incubate the plates in a 5% CO2, 37 °C incubator for 24 h.
- Then, add 20 µL of CCK-8 reagent to each well and place the plates back in the incubator (5% CO2, 37 °C) for 2 h. After the incubation, detect the OD at a wavelength of 450 nm on the microplate reader as soon as possible.
8. ELISA for detecting the effect of DIO on the secretion of IgA and Gd-IgA1 by DAKIKI cells
- Seed DAKIKI cells in 6-well plates at a density of 6x10⁶ cells/well, and group and treat the cells according to step 7.2. Culture the cells for 24 h, then centrifuge at 850 x g for 10 min at 4 °C to obtain the supernatant.
- Detect IgA and Gd-IgA1 concentrations according to the kit instructions.
9.qRT-PCR for detecting the effect of DIO on C1GALT1 and Cosmc mRNA levels in DAKIKI cells
- Seed the DAKIKI cells at a density of 6x10⁶ cells/well in a 6-well plate, group and treat the cells as CCK8 mentioned in step 7.2, and incubate for 24 h. Extract total RNA from DAKIKI cells according to the instructions of the total RNA extraction kit.
- After taking 1 µL of extracted RNA from each group of samples and measuring its concentration, transcribe reversely 1 µg of total RNA from each sample into cDNA according to the kit instructions.
- Then, perform RT-PCR amplification to detect the expression of each gene (95 °C for 15 min, 95 °C for 10 s, and 60 °C for 30 s). Calculate the expression level of each gene using the 2-ΔΔCT method with β-actin as the internal reference.
NOTE: The primer sequences were as follows:
C1GALT1: 5'-AAGGTTGACACCCAGCCTAA-3', 5'-CTTTGACGTGTTTGGCCTTT-3';
Cosmc: 5'-GCTCCTTTTTGAAGGGTGTG-3', 5'-TACTGCAGCCCAAAGACTCA-3';
β-actin: 5'-TCACCCACACTGTGCCCATCTACGA-3', 5'-CAGCGGAACCGCTCATTGCCAATGG-3'.
10. Western blotting for examining the effect of DIO on the expression of C1GALT1 and Cosmc proteins in DAKIKI cells
- Seed the DAKIKI cells at a density of 6x10⁶ cells/well in a 6-well plate. Group and treat them as mentioned in step 7.2. After 24 h of incubation, collect each group of cells.
- Add an appropriate amount of cell lysis solution (PMSF: phosphatase inhibitor: RIPA lysis solution = 1:1:100) and incubate on ice for 30 min. Then centrifuge at 13,500 x g for 10 min at 4 °C and collect the supernatant.
- Determine the protein concentration using the BCA protein concentration assay kit.
- Mix the protein samples with 5x SDS-PAGE loading buffer at 4:1 by vortexing, and heat the mixed samples at 100 °C for 5 min to denature the protein.
- To detect proteins with different molecular weights, add the protein marker (5 µL/well) and samples (20 µg/well) into different lanes of a 12% SDS-PAGE gel, run SDS-PAGE electrophoresis, and transfer the gel to PVDF membranes.
- Block the membranes with 5% nonfat milk for 2 h at RT and incubate with the corresponding primary antibodies (C1GALT1 [1:1000], Cosmc [1:2000]) for 24 h. Use β-actin antibody (1:100000) as an internal control.
- Wash the polyvinylidene fluoride (PVDF) membrane with 1x Tris-Buffered Saline, 0.1% Tween 20 detergent (TBST) three times (10 min/time), then incubate with the corresponding secondary goat anti-rabbit IgG antibody (1: 10000) at RT for 2 h.
- Wash the membrane with TBST again (three times for 10 min each), and treat it with an appropriate amount of enhanced chemiluminescence (ECL) working solution (per the manufacturer's instructions) for protein band detection.
- Capture the images using the chemiluminescence imaging system and perform a semi-quantitative analysis of the gray values of proteins using the Image J image analysis system.
11. Statistical analysis
- Use an appropriate software application for analyzing the data. Express all data as the means ± SD (standard deviation) and evaluate multiple samples by a one-way ANOVA test for comparison between groups.
NOTE: SPSS statistical software 26.0 was used for statistical analysis. The LSD method was used for two-way comparisons between groups when the variances were equal, and the Dunnett T3 method was used for two-way comparisons between groups when the variances were not equal. P<0.05 was considered to indicate a statistically significant difference.
Results
Effect of DIO on kidney tissue in IgAN mice model
Compared with the control group, the mucosal immune-induced IgAN mice model (model group) had a significant increase in proteinuria (Supplementary Figure 2), IgA deposition was visible in the mesangial region, fluorescence was uniformly distributed in clusters throughout the entire mesangial region (Figure 1A), PAS staining of the renal tissue showed mesangial cells proliferation and stromal hyperplasia (Figure 1B), which was reduced in the DIO gavage group (DIO group).
Effect of DIO on B lymphocytes in Peyer's patch
Peyer's patch is the leading site of the conversion of B lymphocytes into IgA-secreting cells. We took Peyer's patch as the research object to observe the effect of DIO on B lymphocytes by detecting the expression of B cell markers CD20 and CXCR5. Immunohistochemical results showed that the expression of CD20 and CXCR5 was significantly higher in the model group compared with the control group. DIO could inhibit the expression of the above molecular markers (Figure 2A,B).
The safe concentration range of DIO on DAKIKI cells
LDH is a marker of plasma membrane integrity and an indicator of cell death, with higher LDH release rates indicating more severe cell damage. The LDH release assay was used to determine the safe concentration range of DIO. The maximum safe concentration of DIO was determined by an LDH release rate below 10%. The results (Figure 3) showed no significant cytotoxicity induced by DIO at concentrations of 0.25 to 1.0 µg/mL. Therefore, the following study used 0.25, 0.5, and 1.0 µg/mL DIO as the dosing level.
Effects of DIO on DAKIKI cell proliferation
The experimental results (Figure 4) showed that compared with the model group (LPS-stimulated group), DIO inhibited LPS-induced DAKIKI cell proliferation in a concentration-dependent manner. DIO at 0.5 and 1.0 µg/mL concentrations significantly inhibited LPS-induced DAKIKI cell proliferation (P < 0.01).
Effects of DIO on the secretory function of DAKIKI cells
Gd-IgA1 levels are closely related to the pathological process of IgAN, and total IgA is tested together as an indicator of cellular secretory function. An ELISA assay was used to detect IgA and Gd-IgA1 content in the supernatant of the DAKIKI cell culture. The results showed (Figure 5A,B) that DAKIKI cells stimulated by LPS secreted more IgA compared with the control group (P < 0.01). In comparison, DIO significantly inhibited DAKIKI cells from secreting IgA (P < 0.01) in a concentration-dependent manner. Compared with the control group, DAKIKI cells stimulated by LPS secreted more Gd-IgA1 with a statistical tendency (P < 0.10), and DIO inhibited Gd-IgA1 secretion from LPS-stimulated DAKIKI cells in a concentration-dependent manner (P < 0.05 and P < 0.01), among which DIO at 1.0 µg/mL significantly inhibited the secretion of Gd-IgA1 with the inhibited rate of 25%.
The mechanism of DIO inhibits Gd-IgA1 secretion by DAKIKI cells
To further investigate the possible mechanism of DIO inhibiting excessive Gd-IgA1 secretion by DAKIKI cells, the levels of glycosylated transferase C1GALT1 and chaperone protein Cosmc mRNA in DAKIKI cells were detected by qRT-PCR, and the results showed (Figure 6A,B) that the relative mRNA expression of C1GALT1 and Cosmc was down-regulated in DAKIKI cells in the model group compared with the control group (P < 0.01). DIO up-regulated the relative mRNA expression of C1GALT1 and Cosmc to different degrees compared with the model group, with DIO 1.0 µg /mL significantly up-regulated the relative mRNA expression of C1GALT1 and Cosmc (P < 0.05).
At the same time, the WB method was used to detect the effect of DIO on the protein expression of C1GALT1 and Cosmc in DAKIKI cells. Compared with the control group, the protein expression of C1GALT1 and Cosmc in DAKIKI cells in the model group decreased obviously (P < 0.05). Compared with the model group, the protein expression of C1GALT1 and Cosmc after DIO intervention was up-regulated. The protein expression of C1GALT1 and Cosmc was significantly up-regulated by DIO at a concentration of 1.0 µg/mL (P < 0.05) (Figure 7A-C).
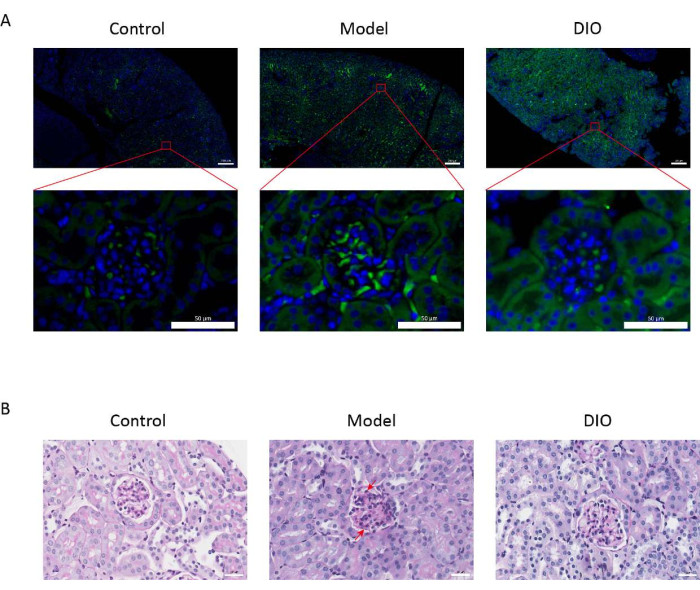
Figure 1: Histopathology of the kidneys. (A) Immunofluorescence microscope. Kidney sections of mice in each group were stained with anti-IgA (green) and DAPI (blue). The above picture scale bar = 200 μm. The below picture scale bar = 50 μm. n = 6 per group. (B) Representative pictures of PAS staining of kidney tissue from mice in the Control, Model, and DIO groups. Scale bar = 30 μm. The downward arrow shows the mesangial cells and the upward arrow shows the stroma. Scale bar = 30 μm. n = 6 per group. Please click here to view a larger version of this figure.
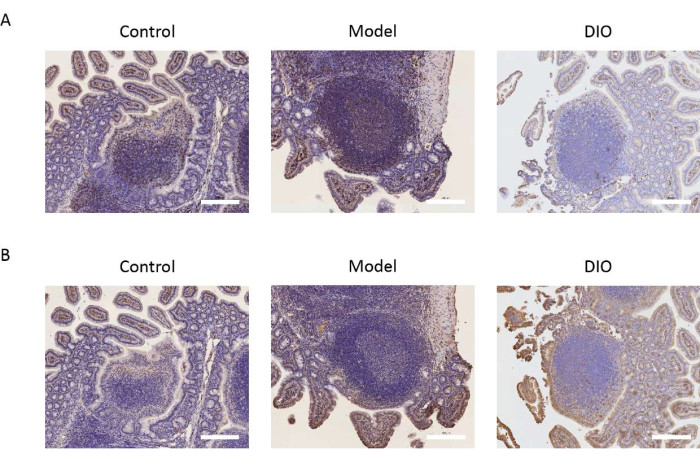
Figure 2: Effect of DIO on B lymphocyte markers. (A) The expression of CD20 in the Peyer's patch. Scale bar = 200 μm. n = 6 per group. (B) The expression of CXCR5 in the Peyer's patch. The scale bars are in the lower right corner of the image. Scale bar = 200 μm. n = 6 per group. Please click here to view a larger version of this figure.
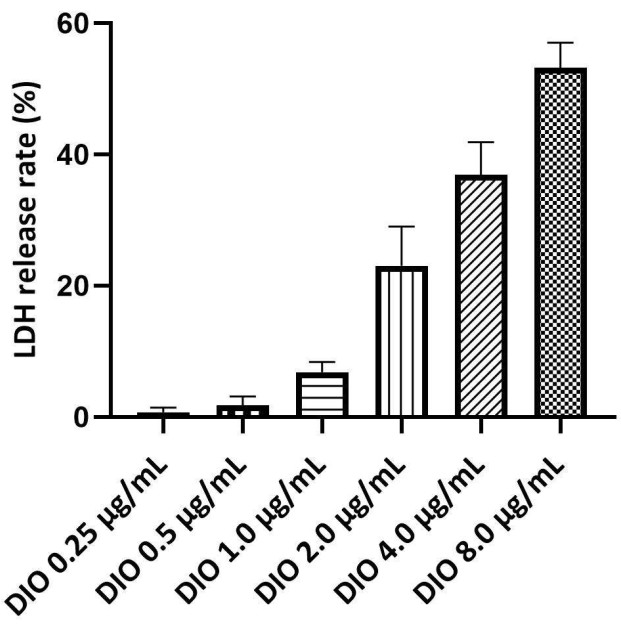
Figure 3. Screening of the safe concentration of DIO on DAKIKI cells. Statistical values are expressed as the mean ± SD from three independent experiments. Please click here to view a larger version of this figure.
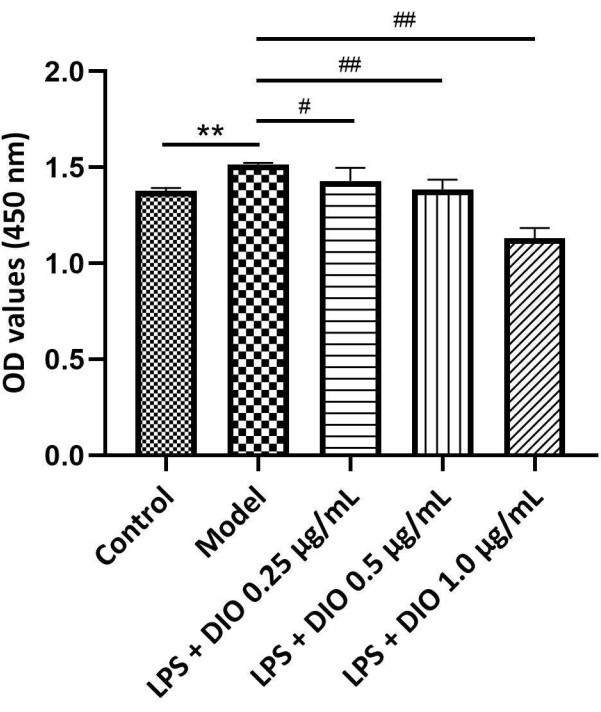
Figure 4. Different concentrations of DIO affect the proliferation of DAKIKI cells. The data were expressed as mean ±SD. Compared with the control group, **P < 0.01; compared with the model group, #P < 0.05‚ ##P < 0.01; The results of all experiments were repeated three times. Please click here to view a larger version of this figure.
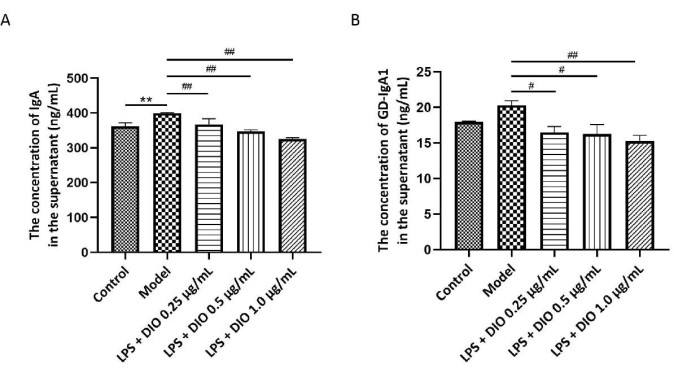
Figure 5. DIO inhibits IgA and Gd-IgA1 secretion by DAKIKI cells. (A) ELISA method detected the expression of IgA in each group. (B) ELISA method detected the expression of Gd-IgA1 in each group. The data were expressed as mean ± SD. Compared with the control group, **P < 0.01; compared with the model group, #P < 0.05, ##P < 0.01; all experimental results were repeated three times. Please click here to view a larger version of this figure.
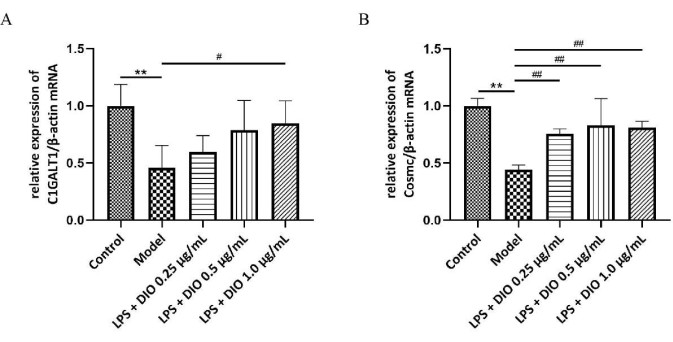
Figure 6. The mechanism of DIO inhibits excessive Gd-IgA1 secretion by DAKIKI cells. (A) QRT-PCR detected the mRNA expression of C1GALT1. (B) QRT-PCR detected the mRNA expression of Cosmc. The data were expressed as mean ± SD. Compared with the control group, **P<0.01; compared with the model group, #P < 0.05, ##P < 0.01; all experimental results were repeated three times. Please click here to view a larger version of this figure.
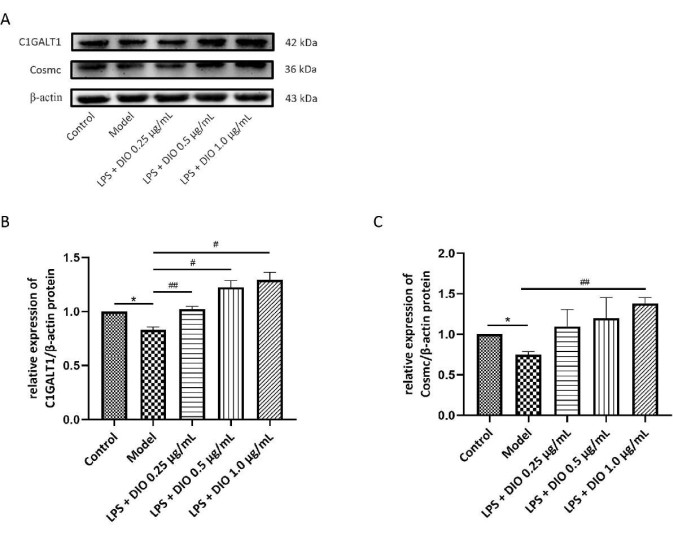
Figure 7. DIO affects protein expression of C1GALT1 and Cosmc in DAKIKI cells. (A) WB verified the up-regulation of protein expression of C1GALT1 and Cosmc by DIO. (B) Semi-quantitative analysis of C1GALT1 expression was performed using Image J. (C) Semi-quantitative analysis of Cosmc expression using Image J. The data were expressed as mean ±SD. Compared with the control group,*P < 0.05; compared with the model group, #P < 0.05, ##P < 0.01, all experimental results were repeated three times. Please click here to view a larger version of this figure.
Supplementary Figure 1. The schema for the in vivo model. Please click here to download this figure.
Supplementary Figure 2. Changes in proteinuria. The data were expressed as mean ± SD; n = 6 per group. Please click here to download this figure.
Discussion
The characteristic pathological feature of IgAN is the deposition of IgA1 and GD-IgA1-containing immune complexes in the mesangial region of the glomerulus21,22. Reducing the formation of immune complexes can reduce renal injury and alleviate the clinical symptoms of IgAN. In an in vivo experiment, we studied the therapeutic effects of DIO on IgAN, and we found that DIO can reduce IgA deposition in the kidney of IgAN model mice. It is demonstrated that the accumulation of IgA-secreting cells in the kidney is related to the pathogenesis of IgAN23. As an important site of proliferation and activation of B lymphocytes, Peyer's patch is an important source of IgA-secreting cells, so we examined the expression of B lymphocyte markers (CD20, CXCR5) in Peyer's patch and found that DIO could inhibit the expression of B lymphocytes in the Peyer's patch of IgAN mice model. These experimental results could provide a basis for applying DIO in treating IgAN.
We performed the following experiments In vitro to further investigate the action mechanism of DIO on IgAN. Firstly it has been demonstrated earlier that DAKIKI, an EBV-immortalized B cell line that secretes IgA1, part of which is GD-IgA124, is ideal for in vitro research of the drug's mechanism of action on IgAN. We chose DAKIKI cells to investigate the molecular mechanism of DIO in the treatment of IgAN. In addition, the mucosal inflammatory immune response plays an integral role in the pathogenesis of IgAN. As mentioned above, we use LPS to stimulate DAKIKI cells, which can release pro-inflammatory factors and mediate inflammatory responses, which can better mimic the mechanism of mucosal immune responses in IgAN. The in vitro cellular model may help investigate the possibility and mechanism of other drugs for treating IgAN. The results showed that DIO inhibited the proliferation of DAKIKI cells stimulated by LPS in a concentration-dependent manner. DIO could inhibit the secretion of IgA and Gd-IgA1 in DAKIKI cells caused by LPS stimulation and up-regulate the expression of mRNA and protein of C1GalT1 and its chaperone Cosmc in DAKIKI cells, suggesting that DIO could reduce the secretion of Gd-IgA1 by up-regulating C1GALT1/Cosmc expression and thus inhibit the excessive activation of DAKIKI cells.
Key steps should be noted during the experimental procedures. The concentration of Gd-IgA1 in the DAKIKI cell supernatant is not within the detection range of the ELISA kit (1.56~100 ng/mL), and the collected supernatant must be centrifuged by an ultrafiltration tube to obtain the concentrated Gd-IgA1. Also, ensure the volume of supernatant starting from each group is the same and the final volume of concentrate obtained after ultrafiltration is the same.
In this study, we used both in vitro and in vivo methods simultaneously, which can mutually support each other in pharmacological effects and provide an example for studying the effects and their mechanisms of herbal medicine. Some things could be improved in this protocol. Firstly, We did not detect blood concentrations in the mice's DIO gavage group; therefore, the concentration of DIO equivalent to blood concentrations is not used in vitro experiments. Secondly, only the DIO monomer, the active component of DNR, was investigated; the effects of other components of DNR on IgAN still need further study.
In conclusion, this study provides an experimental basis for treating IgAN with DIO, the active ingredient of DNR. This study established a cellular pathological model of IgAN by mimicking the mucosal immune response of IgAN both in vitro and in vivo. It gives a new idea for studying traditional Chinese medicine to prevent and treat IgAN.
Disclosures
The authors declare that they have no competing financial interests.
Acknowledgements
This work was supported by the National Natural Science Foundation of China (81973675).
Materials
| Name | Company | Catalog Number | Comments |
|---|---|---|---|
| Anti-CD20/MS4A1 Antibody | Boster Biotechnology Company | A03780-3 | |
| Antifade mounting medium | Beyotime, Shanghai, China | P0128S | |
| Balb/c mice | Beijing Weitong Lihua Laboratory Animal Technology Co., Ltd. | 110322220101424000 | |
| blocking serum | Solarbio, Beijing, China | SL038 | |
| Bovine gamma globulin | ShangHai YuanYe Biotechnology Company | S12031 | |
| C1GALT1 polyclonal antibody | Proteintech Group, Inc,USA | 27569-1-AP | |
| Citrate antigen retrieval solution(50×) | Phygene Biotechnology Company | PH0422 | |
| COSMC polyclonal antibody | Proteintech Group, Inc,USA | 19254-1-AP | |
| Cytotoxiciy detection kit | Roche Company | 4744926001 | |
| Dako REAL EnVision detection system, Peroxidase/DAB+ | Dako | K5007 | |
| DAPI | Invitrogen | D1306 | |
| Dioscin | National Institute For Food and Drug Control | 111707-201703 | |
| DIO tablets | Chengdu No 1 Pharmaceutical Co. Ltd. | H51023866 | |
| ECL working solution | Merck Biotechnology, Inc | WBKLS0100 | |
| Enhanced cell counting kit-8 | Beyotime, Shanghai, China | C0043 | |
| Fasking one-step removal of gene cDNA first-strand synthesis premix | TIANGEN,Beijing, China | KR118-02 | |
| Glycogen Periodic acid Schiff (PAS) stain kit | BaSO Biotechnology Company | BA4080A | |
| Goat anti-mouse IgA-AF488 | SouthernBiotech | 1040-30 | |
| Goat anti-rabbit IgG antibody (H+L), HRP conjugated | BeiJing Bioss Biotechnology Company | BS-0295G-HRP | |
| Human Gd-IgA1 ELISA kit | IBL | 27600 | |
| Human IgA ELISA kit | MultiSciences (LiankeBio) | 70-EK174-96 | |
| Pierce BCA protein assay kit | Thermo Scientific | 23227 | |
| PMSF solution | Beyotime, Shanghai, China | ST507 | |
| Proteinase K | Phygene Biotechnology Company | PH1521 | |
| Rabbit anti-CXCR5 polyclonal antibody | BeiJing Bioss Biotechnology Company | bs-23570R | |
| RIPA lysis buffer | Beyotime, Shanghai, China | P0013B | |
| RNAsimple total RNA extraction kit | TIANGEN,Beijing, China | DP419 | |
| RPMI Medium 1640 | Solarbio, Beijing, China | 31800 | |
| Super-Bradford protein assay kit | CWBIO, Beijing, China | CW0013 | |
| Triton X-100 | Beyotime, Shanghai, China | ST795 | |
| β-Actin Rabbit mAb | Abclonal, Wuhan, China | AC026 |
References
- Knoppova, B., et al. The origin and activities of IgA1-containing immune complexes in IgA nephropathy. Frontiers in Immunology. 7, 117(2016).
- Suzuki, H., et al. The pathophysiology of IgA nephropathy. Journal of The American Society of Nephrology. 22 (10), 1795-1803 (2011).
- He, L., et al. Synthetic double-stranded RNA poly(I:C) aggravates IgA nephropathy by triggering IgA class switching recombination through the TLR3-BAFF axis. American Journal of Nephrology. 42 (3), 185-197 (2015).
- Zhao, N., et al. The level of galactose-deficient IgA1 in the sera of patients with IgA nephropathy is associated with disease progression. Kidney International. 82 (7), 790-796 (2012).
- Xing, Y., et al. C1GALT1 expression is associated with galactosylation of IgA1 in peripheral B lymphocyte in immunoglobulin a nephropathy. BMC Nephrology. 21 (1), 18(2020).
- Qin, W., et al. External suppression causes the low expression of the Cosmc gene in IgA nephropathy. Nephrology Dialysis Transplantation. 23 (5), 1608-1614 (2008).
- Sakai, F., et al. Lactobacillus gasseri SBT2055 induces TGF-β expression in dendritic cells and activates TLR2 signal to produce IgA in the small intestine. PLoS One. 9 (8), 105370(2014).
- Gutzeit, C., Magri, G., Cerutti, A. Intestinal IgA production and its role in host-microbe interaction. Immunological Reviews. 260 (1), 76-85 (2014).
- Serino, G., et al. In a retrospective international study, circulating miR-148b and let-7b were found to be serum markers for detecting primary IgA nephropathy. Kidney International. 89 (3), 683-692 (2016).
- Lu, F., et al. Therapeutic effect of Rhizoma Dioscoreae Nipponicae on gouty arthritis based on the SDF-1/CXCR 4 and p38 MAPK pathway: an in vivo and in vitro study. Phytotherapy research: PTR. 28 (2), 280-288 (2014).
- Wang, W., Xu, L., Zhou, L., Wan, S., Jiang, L. A Network pharmacology approach to reveal the underlying mechanisms of Rhizoma Dioscoreae Nipponicae in the treatment of asthma. Evidence-Based Complementary and Alternative Medicine: eCAM. 2022, 4749613(2022).
- Tian, W. W., Wei, Y. Professor TONG Xiaolin used the experience of Dioscoreae Nipponicae. Jilin Journal of Chinese Medicine. 40 (05), 589-592 (2020).
- Rao, X. R., Bai, Y. W. Das Xiwen's experience in treating IgA nephropathy. Beijing Journal of Traditional Chinese Medicine. 9, 691-693 (2008).
- Si, Y., Zhang, Y. A data mining study on the pattern of medication use in the treatment of IgA nephropathy by Professor Zhang Yu. Journal of Chinese Physician. 20 (01), 109-111 (2018).
- Jiang, H., et al. Optimization of the enzymatic extraction technology of Diosgenin from Dioscorea nipponica. Chinese Traditional Patent Medicine. 39 (03), 621-624 (2017).
- Qi, M., et al. Dioscin alleviates lipopolysaccharide-induced inflammatory kidney injury via the microRNA let-7i/TLR4/MyD88 signaling pathway. Pharmacological Research. 111, 509-522 (2016).
- Yang, L., et al. Recent advances in the pharmacological activities of Dioscin. BioMed Research International. 2019, 5763602(2019).
- Nal Zou, J., et al. Toll-like receptor 4 signaling pathway in the protective effect of Pioglitazone on experimental immunoglobulin A nephropathy. Chinese Medical Journal. 130 (8), 906-913 (2017).
- Xu, S. Y., Bian, R. L., Chen, X. Pharmacological experiments methodology. Chinese Pharmacological Bulletin. 1, 19(1992).
- Shen, J. C., Ren, Y., Rao, X. R., You, Y., Li, S. Network pharmacology, molecular docking, and in vitro experiments to explore the molecular mechanism of Dioscorea Nipponica Makion in the treatment of IgA nephropathy. World Journal of Integrated Traditional and Western Medicine. 16 (12), 2246-2254 (2021).
- Mestecky, J., et al. IgA nephropathy: molecular mechanisms of the disease. Annual Review of Pathology. 8, 217-240 (2013).
- Novak, J., et al. IgA1-containing immune complexes in IgA nephropathy differentially affect proliferation of mesangial cells. Kidney International. 67 (2), 504-513 (2005).
- Nihei, Y., et al. Identification of IgA autoantibodies targeting mesangial cells redefines the pathogenesis of IgA nephropathy. Science Advances. 9 (12), (2023).
- Raska, M., et al. Identification and characterization of CMP-NeuAc: GalNAc-IgA1 alpha2,6-sialyltransferase in IgA1-producing cells. Journal of Molecular Biology. 369 (1), 69-78 (2007).
Reprints and Permissions
