The current study is a randomized, placebo-controlled trial to determine the efficacy of cranial electrical stimulation (CES) for improving pain and function in fibromyalgia and further develop resting functional connectivity magnetic resonance imaging (rs-fcMRI) as a clinical tool to assess the neural correlates and mechanisms of chronic pain and analgesic response.
A subscription to JoVE is required to view this content. Sign in or start your free trial.
Method Article
A Randomized, Sham-Controlled Trial of Cranial Electrical Stimulation for Fibromyalgia Pain and Physical Function, Using Brain Imaging Biomarkers
In This Article
Summary
Abstract
Fibromyalgia is a chronic pain syndrome that presents with a constellation of broad symptoms, including decreased physical function, fatigue, cognitive disturbances, and other somatic complaints. Available therapies are often insufficient in treating symptoms, with inadequate pain control commonly leading to opioid usage for attempted management. Cranial electrical stimulation (CES) is a promising non-pharmacologic treatment option for pain conditions that uses pulsed electrical current stimulation to modify brain function via transcutaneous electrodes. These neural mechanisms and the applications of CES in fibromyalgia symptom relief require further exploration.
A total of 50 participants from the Atlanta Veterans Affairs Healthcare System (VAHCS) diagnosed with fibromyalgia were enrolled and then block-randomized into either a placebo plus standard therapy or active CES plus standard therapy group. Baseline assessments were obtained prior to the start of treatment. Both interventions occurred over 12 weeks, and participants were assessed at 6 weeks and 12 weeks after treatment initiation. The primary outcome investigated whether pain and functional improvements occur with the application of CES. Additionally, baseline and follow-up resting state functional connectivity magnetic resonance imaging (rs-fcMRI) were obtained at the 6-week and 12-week time points to assess for clinical applications of neural connectivity biomarkers and the underlying neural associations related to treatment effects.
This is a randomized, placebo-controlled trial to determine the efficacy of CES for improving pain and function in fibromyalgia and further develop rs-fcMRI as a clinical tool to assess the neural correlates and mechanisms of chronic pain and analgesic response.
Introduction
Of the many existing states of chronic pain, one of the most notoriously difficult diseases to diagnose, clinically assess, and treat is fibromyalgia. Fibromyalgia is a debilitating chronic pain syndrome that involves chronic widespread pain, decreased physical function, fatigue, psycho-emotional and sleep disturbances, and various somatic complaints affecting approximately 2-3% of the general population in the Americas (about 8 million people in the U.S.)1. Diagnosis of the disease is heavily reliant on a patient's understanding of their own symptom profile and pain experience, and without that proper understanding by both clinician and patient of the disease, methods of treatment lose considerable efficacy2. A better definition of fibromyalgia's origins and impact as well as a reliable clinical biomarker to guide fibromyalgia diagnosis and treatment are necessary to best serve all patients.
Even with a confirmed diagnosis, difficulties with the treatment process only grow. As a whole, chronic pain affects more individuals than heart disease, diabetes, and cancer combined. The subjective nature of its assessment places it as a primary driver for the opioid epidemic, especially given the difficulty in discerning incompletely treated physical pain from substance use disorder and drug-seeking behavior3. In 2020, 91,799 drug overdose deaths occurred in the United States (a 30% increase from 2019), and opioids were found to be the main cause of these deaths (74.8% of all 2020 drug overdose deaths)4. Thus, non-pharmacologic alternatives are needed for chronic pain and fibromyalgia treatment to slow the opioid epidemic, which is particularly important in the veteran population where the risk of suicide and opioid use disorder is higher5. Non-pharmacologic and complementary therapies are therefore often used as first-line treatments6.
The search for novel, efficacious fibromyalgia interventions has led many researchers and clinicians to methods of noninvasive brain stimulation, including cranial stimulation. Even though the pathophysiologic mechanisms that result in the development of the disease have not been definitively determined, existing evidence supports the idea that fibromyalgia is a disorder of autonomic nervous system dysfunction and central (i.e., brain and spinal cord) pain processing mechanisms7,8. Stimulation of certain areas of the brain could lead to improved function in those areas of processing. Repetitive transcranial magnetic stimulation (rTMS) and transcranial direct current stimulation (tDCS) have been correlated with reductions in pain but have also been associated with activation site scalp irritation, headaches, and inaccessibility outside of treatment facilities9. Noninvasive vagus nerve stimulation (nVNS), which can provide neuromodulation through stimulation over the skin at the neck or at the level of the ear, has the potential for the treatment of chronic pain, and invasive vagus nerve stimulation (VNS) has been shown to improve chronic pain symptoms10. However, neither invasive nor noninvasive VNS have been sufficiently explored in the literature or fully validated for use in fibromyalgia treatment11,12,13,14.
Cranial electrical stimulation (CES) is a non-pharmacological, noninvasive brain stimulation treatment that consists of pulsed, alternating microcurrent (less than 0.5 mA) applied via transcutaneous electrodes placed on the earlobes15. It is remarkably accessible and can be delivered through portable devices used by patients within their own living spaces. In comparison to other cranial stimulation methods, the noninvasive nature and the convenience of patient self-application at home increases the potential of CES as a beneficial option for widespread fibromyalgia treatment use and self-management of pain. It has been cleared by the U.S. Food and Drug Administration (FDA) as a treatment for insomnia, depression, anxiety, and pain15.
The current study evaluates the efficacy of CES as a fibromyalgia treatment modality by comparing active CES (administered by a true study device) versus sham CES (administered by a sham study device). There is some preliminary evidence to support the use of CES in the treatment of pain conditions such as fibromyalgia16,17. A 2001 study of 60 participants randomized to active or sham CES for 3 weeks of daily 60 min sessions revealed a 28% improvement in tender point scores, 27% improvement in general pain scores, and no placebo effect18. CES has not been evaluated in a veteran population, nor has it been adequately evaluated in males with fibromyalgia. A Veterans Affairs (VA)-funded systematic review of CES published in 2018 concluded that evidence is insufficient for CES to have clinically important effects on fibromyalgia, given that most trials had small sample sizes, short durations, and a high risk of bias due to inadequate blinding. However, the review suggests that CES does not cause serious side effects, and there is low-strength evidence to suggest modest benefits in patients with anxiety and depression19. Therefore, further research is warranted regarding the use of this FDA-cleared, low-risk device, particularly in fibromyalgia.
In order to fully evaluate the efficacy, researchers assessed physical fitness alongside neural biomarkers and pain experience. The purpose of treating chronic pain states is to improve physical function. Fibromyalgia is consistently correlated with negative effects on both physical function and patients' perception of their own physical abilities20. Previous studies have utilized simple physical fitness assessments to determine stamina and mobility, such as the 6 Minute Walk Test (6MWT)20,21, Five Time Sit to Stand (5TSTS)20, and various measures of carrying capacity and strength in the context of daily activities22. To account for standard measures while also mitigating the amount of strenuous activity required right before an MRI scan, the study team used the 30-Second Chair Sit Stand Test as a measure of stamina and mobility and both bicep curls and a hand grip test as measures of strength23. The movements required in each of these assessments are very common in everyday activities, so it is a clear measure of how people are physically functioning in their day-to-day lives, both with and without treatment.
Even with subjective pain assessments and physical function measures of efficacy, the mechanisms of CES are not fully understood. Prior neuroimaging studies have sought a better understanding by exploring the direct effect of CES on network connectivity in the brain. Feusner et al.24 found that CES is associated with cortical deactivation for 0.5 Hz and 100 µA stimulation of bilateral frontal, parietal, and posterior midline regions and postulated that frequency of stimulation may have more of an effect than current intensity in relation to cortical deactivation. Their group found significant effects on some but not all nodes of the default mode network (DMN). The authors suggest that based on this data, CES may affect resting state functional connectivity. Fibromyalgia and other chronic pain states have been shown to affect intrinsic brain connectivity in regions associated with pain and perception25,26, so treatments that alter functional connectivity in response could prove to be both beneficial and effective. Further exploration of the longer-term effects of daily treatment in relation to clinical improvement, as well as how deceased activation in the brain relates to previously observed decreases in electroencephalogram frequencies, is needed to further understand the therapeutic mechanism of action27.
Resting-state functional connectivity magnetic resonance imaging (rs-fcMRI) is the neuroimaging method that allows for the observation of these functional connectivity changes. Longitudinal resting state fMRI allows clinicians and researchers to establish a baseline of resting state connectivity and track alterations over time in response to CES treatment methods. It also helps to determine how changes in functional connectivity are correlated to differences in the experience of pain. Initial studies of neuroimaging for fibromyalgia used positron emission tomography (PET) and single-photon-emission computed tomography (SPECT) to examine the brain, but there are issues with both techniques in this regard: SPECT has a lower resolution than PET, and PET scans are invasive, which is not preferable for patients experiencing chronic pain. Functional magnetic resonance imaging (fMRI) scans have greater resolution than SPECT, but they examine brain activity in response to patients' specific actions or perceptions of stimuli28. It is rs-fcMRI scans that can outline functional connectivity between regions of the brain and may be able to determine where and how fibromyalgia exists as well as the best methods of treatment28.
Evaluating the efficacy of non-pharmacologic treatments for pain conditions such as fibromyalgia is of utmost importance both in the current setting of the opioid epidemic and in examining chronic pain as a risk factor for suicide29,30, which is substantially increased among the veteran population. Additionally, the lack of adequate clinical biomarkers for pain is a recognized knowledge gap. Using a combination of behavioral measures and neuroimaging at multiple timepoints to assess treatment response is a novel approach to fibromyalgia evaluation, as is the utilization of auricular CES as a treatment.
The protocol aims to address the gap in fibromyalgia research by investigating the effects of CES on pain and physical function outcomes and evaluating neuroimaging as a tool for predictive and response biomarkers related to the clinical outcomes of CES therapy31.
Access restricted. Please log in or start a trial to view this content.
Protocol
The study was conducted under the approval of the Emory University (IRB 112768) and Atlanta VA Institutional Review Boards (1585632-2; Internal Reference Number: 003) as well as the Atlanta VA R&D Committee (Board Reference Number: 3881). All subjects gave their informed consent for inclusion before they participated in this study. For a visual representation of the study protocol timeline, see Figure 1).
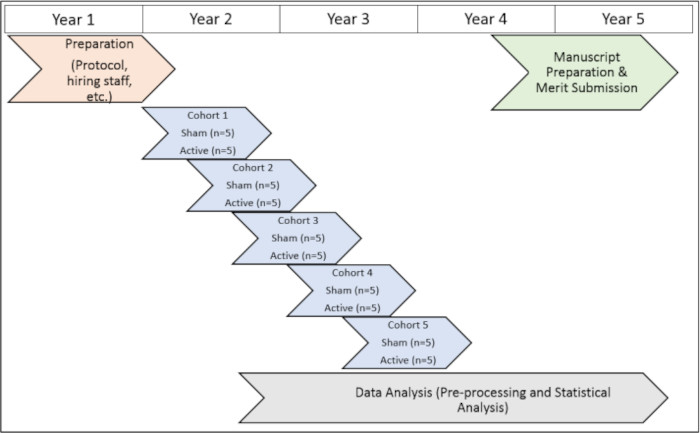
Figure 1: Study timeline. A visual representation of the timeline for executing the study procedures over the trial period. Please click here to view a larger version of this figure.
1. Recruiting participants via available methods
- Follow the required respective institutional guidelines for disseminating study recruitment materials (flyers, posts, emails, calls, etc.) and approved recruitment methods.
NOTE: The current study recruited via recruitment letter mailings to specific cohorts and follow-up phone calls to potential participants. The details regarding ordering the CES devices for the study are included in the supplemental CES device order instructions (Supplementary File 1). - When someone expresses interest in study participation, screen them over the phone to ensure they meet all inclusion and exclusion criteria.
- Include participants who fit the eligibility criteria: age 20-60 years old (limit set during preliminary study to minimize brain structural changes due to aging)31; diagnosis of fibromyalgia by the American College of Rheumatology 2016 criteria32; right-handedness (in order to provide consistency in brain structure and function); pain score of 4 or greater on the Defense and Veterans Pain Rating Scale (DVPRS)33 in the 3 months prior to enrollment; consistent and stable FM related medication for at least 4 weeks prior to enrollment34; and ability to safely tolerate MRI.
- For the fibromyalgia screening portion, fill out the new clinical fibromyalgia diagnostic criteria32 with the potential participant to obtain their widespread pain index (WPI) score and severity score (SS). Score according to the guidelines listed at the bottom of the page.
- For the pain score screening portion, ask potential participants to verbally rate their average, consistent pain over the past 3 months on a scale from zero to ten.
- For the MRI screening portion, complete an MRI safety screening form with the potential participant provided by an institution or the scanner facility itself.
- Ask participants about all possible exclusion criteria. Exclusion criteria include a history of seizures or neurologic conditions that alter the brain; pregnancy; claustrophobia, MRI-incompatible implants, or other conditions incompatible with MRI; and a history of uncontrolled psychiatric illness or autoimmune disease that leads to pain and can better explain symptoms31.
- If any of the exclusion criteria apply to them, they fail the screening. Do not include them in the study.
- Include participants who fit the eligibility criteria: age 20-60 years old (limit set during preliminary study to minimize brain structural changes due to aging)31; diagnosis of fibromyalgia by the American College of Rheumatology 2016 criteria32; right-handedness (in order to provide consistency in brain structure and function); pain score of 4 or greater on the Defense and Veterans Pain Rating Scale (DVPRS)33 in the 3 months prior to enrollment; consistent and stable FM related medication for at least 4 weeks prior to enrollment34; and ability to safely tolerate MRI.
- When someone passes the screening, schedule them for their consent appointment and baseline MRI scan. Schedule 2 h for the consent and scan time.
2. Administering baseline, mid, and post-participant study appointments (see Table 1)
NOTE: All appointments take place at the MRI scanner location.
| Time | Research Activity | |
| Phase 1 | Week 1 | Recruitment, Screening, Enrollment |
| Phase 2 | Week 2–3 | Baseline Assessments, rs-fcMRI |
| Phase 3 | Weeks 2–14 | Intervention |
| Phase 4 | Week 6–10 | Acute follow-up, rs-fcMRI (6 weeks into treatment) |
| Phase 5 | Week 12–16 | Long-term follow-up, rs-fcMRI (12 weeks into treatment) |
Table 1: Research design. A timeline of the phases of individual participation over the 12 weeks of the study.
- Before each baseline visit, prepare a CES device to bring to each participant.
- Open up the case to ensure the device is inside (it should be in bubble wrap). Remove the back of the device and insert two AAA batteries.
- Replace the device back. Turn the device on to ensure it works before bringing it to the participant. Hold down the top button for about 2 s until the screen lights up to turn it on, and hold it down for about 2 s until the screen goes blank to turn it off.
- Ensure each case contains the device, extra batteries, a lanyard, a small solution applicator, and ear clips. Make sure that the bag to give to participants contains the device case, a bottle of conducting solution, an extra cap to fill the small solution applicator, and extra ear clip electrode pads.
- Once their consent and baseline MRI scan have been scheduled, meet the participant at the MRI scanner location for the appointment with two copies of the consent form, a CES device and its materials, eligibility testing paperwork, and a questionnaire packet for them to complete. Additionally, bring the data transfer device through which the MRI data will be transferred to the analysis site.
NOTE: This study utilized an encrypted USB drive.- For the eligibility paperwork, include the new clinical fibromyalgia diagnostic criteria32 and the DVPRS33.
NOTE: The DVPRS should be included for each visit. - For the physical function tests, include a form to record the results of each test20,21,35.
- For the questionnaires that participants will fill out, include the appropriate PROMIS measures (PROMIS Scale v1.2 - Global Health, Neuro-QOL Item Bank v2.0 - Cognition Function - Short Form, PROMIS Item Bank v1.0 - Substance Use/Alcohol: Alcohol Use, PROMIS Item Bank v1.0 - Emotional Distress - Anxiety- Short Form 7a, PROMIS Item Bank v1.0 - Emotional Distress-Depression - Short Form 4a, PROMIS Item Bank v1.0 - Fatigue - Short Form 6a, PROMIS Item Bank v1.0 - Pain Interference - Short Form 4a, PROMIS Item Bank v1.2 - Physical Function - Short Form 8b, PROMIS Item Bank v2.0 - Social Isolation - Short Form 4a)36.
- For the eligibility paperwork, include the new clinical fibromyalgia diagnostic criteria32 and the DVPRS33.
- At the MRI location, administer the baseline visit. Call the participant ahead of time to confirm.
- Read through the full consent form with the participant ensuring that they understand the information. Ask them if they would like to participate, and if they agree, have them print their name, sign, and date the form.
- After consenting, if the participant chooses to participate in the study, complete the inclusion testing paperwork with them. If they are eligible to continue, complete the steps below; if they are ineligible, terminate their study participation at this point.
- Ensure that the eligibility testing paperwork includes the new clinical fibromyalgia diagnostic criteria and the DVPRS.
- If a participant is eligible after the inclusion testing, explain to the participant how to use the CES device.
- Remove the device from the case and show participants how to turn it on and off with the button at the top. Remind participants that the device will automatically deactivate after 60 min has elapsed.
- Show participants how to attach the ear clip cord to the side. The opposite end of the cord from the clips plugs into a small hole on the left side of the device labeled with a "1".
- Demonstrate how to remove the old electrode pads from the ear clips and attach new ones. To remove old pads, pull up the adhesive from where it connects to the clips. To attach new pads, align the hole in the spare electrode pads with the raised area in the center of the clip and press down firmly.
NOTE: Do not pull the electrode pads by the soft portion on top. It is prone to tearing and will leave the adhesive stuck to the clips. - Demonstrate how to clip the ear clips to their earlobes and have them try it once. Squeeze the green tips of the clip to open it, position the earlobe between, and gently close the clip to attach.
- Show them how to remove the plastic top from the small solution applicator and fill it with the solution from the larger bottle (see steps 2.3.3.6-2.3.3.8). Remind them that the solution is necessary for the device to function properly.
- To remove the top of the small solution applicator, remove the cap and press firmly against the side of the tip. The plastic tip will dislodge from the rest of the bottle.
- Attach the alternate cap for filling the small applicator to the top of the larger solution bottle. Push up the small nozzle, slide it into the small applicator, and squeeze the large bottle to fill.
- Tell participants that they should only add about 1-2 drops of the solution to each earclip electrode pad. Any excess solution should be dabbed off before use.
- Instruct the participants to use the device every day of the week for 60 min in the evening, about 1 h before going to bed. Instruct the participants to use the device while at rest (i.e., sitting still or lying down, not moving around).
NOTE: For both time and position, participants were allowed normal variations in their home environment of usage to increase the practical nature of this therapy for home use. No parameters were set for sound allowed in the environment or required device storage. - Give the participants a blank device log and explain that they need to enter each date of device use, their pain score before and after device use, and the time of device use.
- If participants are not able to use their device for a period of time during the 6 weeks between appointments but are able to make the follow-up appointments, let them remain in the study. If they are not able to use the device or make it to the study visits, end their participation. See the supplemental CES device log (Supplementary File 2) for the device log this study used.
NOTE: The following steps will be repeated during all three visits.
- After the device explanation, have the participant complete three short physical function tests23. For each test, a maximal number will be recorded for the score (total repetitions for the first two and strength per trial for the third).
NOTE: The stopwatch used for this study was an Apple iPhone 12.- Administer the 30 s chair sit stand test. Follow steps 2.3.4.2-2.3.4.6.
- Place a chair with its back against the wall of the testing room. Have the participant sit on the chair with their back against the chair back.
- Instruct the participant to rise to a full standing position and then sit all the way back down with their back against the chair back as many times as they can in 30 s.
NOTE: If they tap the chair but do not fully put their weight back on it in a sitting position, the repetition does not count. - Tell the participants when to begin. Start the timer when they start moving.
- Have participants do arm curls with a dumbbell on each side for 30 s per side. Start with the right arm first and then move to the left.
- Record the total number of curls per side. Use a 5 lb weight for women and an 8 lb weight for men. Ensure that the participants are seated for the arm curl test.
- Have participants do three grip strength trials with each arm on a dynamometer. Follow steps 2.3.4.8-2.3.4.11. Start with the right arm first and then move to the left.
- Place the dynamometer in the participant's hand. They should be squeezing the grip at the bottom and not touching the dial at the top.
- Tell participants to squeeze the dynamometer as hard as they can and then release. The needle on the dial will stop at the highest level of grip strength they displayed.
- Record their grip strength results by writing down the number the needle reaches on the dial. Reset the dial between repetitions by twisting the small knob on the front of the dial face counterclockwise until the needle rests at zero.
- Ensure that the participants are seated for the handgrip test.
NOTE: Between each series, participants receive about 15-20 s of rest as they shift equipment to their other hand. Between each test, participants will receive about 2 min of rest while the equipment and paperwork for the next is prepared.
- After the physical function tests, have participants complete the questionnaire packet with a pen. Check over the packet afterward to make sure they have answered all questions.
- After all review, testing, and questionnaires are completed, walk participants to the MRI scanner itself (for all MRI protocol information, see section 3). Review the screening form with the MRI technicians and ensure participants have removed all metal from their person.
- Make certain that the study team members have no metal on their persons.
- Help MRI technicians get participants into the scanner comfortably. Administer the MRI scan protocol.
- Instruct the participants about safety procedures (test call button and speakers).
- Remind the participants not to move at all during the scan.
- Remind the participants of the total duration of the scan, which should be 60 min.
- When the scan has been completed, help the participants out of the scanner.
- After the scan, finish participants' baseline visit and schedule their mid-visit for 6 weeks later. Participants will have three study visits total, each 6 weeks apart. Push MRI data to the study’s secure servers for analysis.
- On the scheduled day, administer the mid-visit following the steps of the baseline visit. Call participant ahead of time to confirm.
- Administer the DVPRS. Have participants return their first completed device log and provide them with a second device log.
- Perform steps 2.3.4-2.3.6 (same as in the baseline visit).
- Finish participants' mid-visit and schedule their post-visit for 6 weeks later. Push MRI data to the study’s secure servers for analysis.
- On the scheduled day, administer the post-visit following the steps of the mid-visit. Call the participant ahead of time to confirm.
- Administer the DVPRS. Have participants return their second completed device log.
- Perform steps 2.3.4-2.3.6 (same as in the baseline and mid-visits). No additional visit scheduling is needed for the last visit.
- If any information is needed to compensate participants, prepare and request that information on this visit.
NOTE: This study required their name and address to issue checks from the Atlanta VA for compensation. - Finish participants' post-visit. Push MRI data to the study’s secure servers for analysis.
NOTE: Throughout the study, be sure to call and check in with the participants between visits to ensure they are using the device, completing the device logs, and aware of when their next visit will be.
3. Setting up MRI scan protocols
- For the MRI scan protocol, acquire BOLD rs-fMRI on a 3T MRI scanner with a 32-channel phased array head coil using a gradient echoplanar imaging (EPI) sequence. Use the following MR parameters: FOV (Field of View)= 220 mm2; TR (Repetition Time)/TE (Echo Time) = 1500/25 ms, multiband-acceleration factor =3; flip angle = 50˚; 110 x 110 matrix size; slice thickness = 2 mm; GRAPPA factor = 2; Partial fourier of 6/8; 34 phase-encode reference lines, 72 interleaved axial slices covering the whole brain, roughly 350 scan volumes to yield 8 min of resting state fMRI data for stable estimation of connectivity networks.
- In the protocol for the anatomical T1w magnetization prepared rapid gradient echo (MPRAGE), set TR = 2530 ms, TE = 3 ms, flip angle = 7°, slice thickness = 0.8 mm, 1 mm phase resolution. The T1w acquisition lasts approximately 6 min.
- Acquire diffusion-weighted imaging (DWI) scans on a 3T MRI scanner with a 32-channel phased array head coil using a diffusion spectrum imaging scheme. Collect a total of 129 diffusion sampling directions with a maximum b-value of 3000 s/mm2, an in-plane resolution of 2x2 mm2, and a slice thickness of 2 mm.
- Acquire physiological data (cardiorespiratory data utilizing a respiratory monitor belt and pulse oximetry) simultaneously (time-locked) to the fMRI data.
- Securely transfer the MRI data from the scanner location to a secure site for preprocessing and analysis. Convert DICOMS to NIFTIs to comply with BIDS formatting utilizing dc2bids v2.1.6.
- Scrub the data of individual identifiers. Use a study subject number on all data wherever applicable. Conduct a quality check to ensure no anomalous artifacts, such as excessive motion, occurred in the data via MRIQC v21.0.0.
4. Preprocessing and analyses
- Once the MRI data from the study has been received, utilize two separate pipelines to analyze it: one to analyze the functional connectivity between participants and another to analyze white matter tractography.
- Preprocess subjects' structural T1w and rsfMRI data via fMRIPrep v20.2.5, including brain extraction, tissue segmentation, and normalization of the T1-weighted (T1w) images as well as reference volume estimation, head-motion estimation, slice timing correction, and registration to the T1w for the functional images. This process results in the T1w and rsfMRI data normalized into MNI152NLin2009cAsym space.
- Use the preprocessed MRI data in the functional connectivity analysis (CONN).
- See the supplemental fMRIPrep Boilerplate document (Supplementary File 337,38,39,40,41,42,43,44,45,46,47,48,49,50,51,52,53,54,55,56). For further details, refer to the link: https://fmriprep.org/en/stable/
- Import the preprocessed dataset into CONN Toolbox v22a for further processing.
NOTE: CONN Toolbox updated from v21a to v22a during this study.- In the setup phase, establish 2nd level covariates to define the study groups (TRUE vs. SHAM) for analysis later and ensure the quality of T1w and rsfMRI images. Smooth fMRI data via 8 mm Gaussian kernel.
- Following preprocessing, denoise the data to remove extraneous and physiological noise.
NOTE: This study computed the first-level analysis but did not evaluate or use it as the researchers are not interested in single-subject results. - Choose seeds/ROIs and subject covariates and set contrasts. Run a group-level seed-to-voxel analysis.
- Once the setup, preprocessing, and denoising steps have been completed for the pipelines, set the cluster and voxel thresholds to view connectivity patterns.
- See Supplementary Figure 1 and the supplemental CES CONN Instructions (Supplementary File 4) document.
- Use correlational tractography57 to determine longitudinal changes in white matter integrity correlated with the experiment group to identify tract bundles and regions associated with the CES treatment. Below are the main analysis steps:
- Convert the raw DWI images from .dcm (DICOM) into .nii.gz (NIfTI) format.
- Pre-process the images to correct for susceptibility-induced distortions using FSL's (version 6.0.6) TOPUP58,59 and for eddy current distortions using FSL's EDDY tool60.
- Generate DWI image quality control (QC) metrics related to motion at the single subject and study-wise levels using FSL's EDDY QC tools.
- Run a two-way repeated measures ANOVA on these QC metrics to identify any between-group variance that may confound group tractography results. If a metric shows a between-group variance that is significant (p > 0.05), then it should be accounted for as a covariate in the correlational tractography analysis.
- Import the preprocessed data into DSI Studio (version "Chen" Nov 21 2022) where they are converted to .src (source) files. For more information regarding DSI Studio, refer to the software's website (https://dsi-studio.labsolver.org).
- Reconstruct the imported diffusion data using Q-Space Diffeomorphic Reconstruction (QSDR)61 to determine the white matter fiber orientations in MNI template space. A .fib (fiber orientation) file is output for each image. The option selections for the reconstruction are:
method (reconstruction method selection) - QSDR
param0 (diffusion sampling length) - 1.25 (this is the default)
template (which template space to reconstruct data to) - ICBM152
align_acpc (whether to rotate the image volume to align ac-pc) - 0 (false) - Create a connectometry database from these .fib files, which extracts the quantitative anisotropy (QA) values from the reconstructed diffusion data. Calculate the longitudinal change in QA for each subject in the database. Add demographics such as experiment group, age, sex, along with any covariates identified in the QC step via a .csv file to the database.
- Next, load the connectometry database into the Group Connectometry Analysis GUI.
- Select covariates to be considered in the analysis. One of these selected covariates is designated as the Study variable.
- For this analysis, select Group as the study variable. Tracts with longitudinal changes in QA correlated with Group will be identified while the effect of the other covariates selected will be regressed out.
- The option selections for the group connectometry analysis are:
- FDR Control (False Discovery Rate cutoff, only tracts with a significant correlation below FDR will be output) - 0.05
- Length Threshold (value in voxels of minimum tract length used as null hypothesis) - 20 voxels (or 40 mm for 2 mm voxel sizes)
- T threshold (t-stat measurement threshold for correlation effect) - 2.5
- Study region (this pane allows regions to be included/excluded from the analysis) - select Whole Brain with - Exclude Cerebellum checked
NOTE: For this study, the cerebellum was excluded due to some of the diffusion scans having portions of the cerebellum cut off during acquisition.
- Press the Run Connectometry button to perform the analysis, which outputs several files:
- A .fib file that stores the t-stats and can be opened in DSI studio to visualize the t-stats of tracts with increasing QA (stored as "inc_t") or decreasing QA (stored as "dec_t"), which correlate with Group.
- A .fdr_dist.values.txt, which lists the FDR values with respect to tract length
- A .inc.tt.gz which is a tractography file that stores the tracts with increased longitudinal QA correlated with the study variable. (Group in our case). A .dec.tt.gz file stores the tracts with decreased longitudinal QA correlated with the study variable.
- A .report.html file which conveniently reports the connectometry results along with imbedded tract plots, pictures, as well as the boilerplate information on the correlational tractography analysis steps for publication.
NOTE: To see examples of the R code used for this study, see the supplemental CES R Code Plots (Supplementary File 5) and the supplemental R Code CES eddy-qc Anova files (Supplementary File 6).
Access restricted. Please log in or start a trial to view this content.
Results
In terms of recruitment results, participants were primarily recruited via mailing of recruitment letters and follow-up phone calls based on the outlined regulations of the Atlanta VA Healthcare System. The study team recruited a total of 50 participants, proving the effectiveness of the methods used in meeting the recruitment goal (see Figure 2). The use of the new clinical fibromyalgia diagnostic criteria allowed the study team to properly screen out indivi...
Access restricted. Please log in or start a trial to view this content.
Discussion
The methods of the current study provide not only the possibility of a highly effective treatment modality for fibromyalgia but also the opportunity to improve the diagnostic process of fibromyalgia from the first instance of its pain symptom profile. Use of both active CES and sham CES, with discovery of the type of each individual device being dependent upon serial numbers and a separate key, allowed for blinding of both subjects and researchers until the end of participation, thereby protecting internal validity durin...
Access restricted. Please log in or start a trial to view this content.
Disclosures
The authors declare that they have no known competing financial interests or personal relationships that could have appeared to influence the work reported in this paper. The views expressed in this article are those of the authors and do not necessarily reflect the position or policy of the Department of Veterans Affairs or the United States government.
Acknowledgements
The authors would like to acknowledge the support of investigators at the Center for Visual and Neurocognitive Rehabilitation, including Dr. Bruce Crosson and Dr. Lisa Krishnamurthy, for their input into the work. The authors also thank Grace Ingham for her invaluable help in the filming process. This work was supported in part by the United States Department of Veterans Affairs Rehabilitation Research and Development Service Career Development Award IK2 RX003227 (Anna Woodbury) and Center Grant 5I50RX002358. The funder has no role in study design, data collection, management, analysis, interpretation, or reporting.
Access restricted. Please log in or start a trial to view this content.
Materials
| Name | Company | Catalog Number | Comments |
|---|---|---|---|
| 3T Siemens MAGNETOM Prisma Scanner | Siemens Healthineers | N/A | From Emory's website: "The Siemens Magnetom Prisma 3T whole-body MR system is equipped with: a state-of-the art gradient system with a maximum (per axis) strength of 80 mT/m and slew rate of 200 T/m/sec 64 independent RF receiver channels capable of 204 receiver connections a 2-channel RF transmitter. Multiple coils are available, including: a 64-channel head/neck coil with 52 channels for imaging of the head region a 32-channel head-only coil a 20-channel head/neck coil with 16 channels for head spine array coil flexible chest coil large and small flexible coil for extremity imaging. |
| Alpha-Stim AID Kit | Electromedical Products International Inc. | SKU: 500KIT | A total of 50 devices ordered for research purposes. From the site: "A prescription or order from a licensed healthcare professional is required to purchase this device (within the USA). FDA cleared for anxiety, insomnia and pain only, with approval for depression outside of the United States." |
| CONN Toolbox v21a16 (RRID:SCR_009550) | Whitfield-Gabrieli and Nieto-Castanon | Version v21a16 (RRID:SCR_009550) | CONN is an open-source SPM-based cross-platform software for the computation, display, and analysis of functional connectivity Magnetic Resonance Imaging (fcMRI). CONN is used to analyze resting state data (rsfMRI) as well as task-related designs. |
| DSI Studio (RRID:SCR_009557) | Fang-Cheng (Frank) Yeh | RRID:SCR_009557 | DSI Studio is a tractography software tool that maps brain connections and correlates findings with neuropsychological disorders. It is a collective implementation of several diffusion MRI methods, including diffusion tensor imaging (DTI), generalized q-sampling imaging (GQI), q-space diffeomorphic reconstruction (QSDR), diffusion MRI connectometry, and generalized deterministic fiber tracking. |
| fMRIPrep 20.2.5 (RRID:SCR_016216) | NiPreps (NeuroImaging PREProcessing tools) | Version 20.2.5. (RRID:SCR_016216) | A functional magnetic resonance imaging (fMRI) data preprocessing pipeline that is designed to provide an easily accessible, state-of-the-art interface that is robust to variations in scan acquisition protocols and that requires minimal user input, while providing easily interpretable and comprehensive error and output reporting. It performs basic processing steps (coregistration, normalization, unwarping, noise component extraction, segmentation, skull-stripping, etc.) providing outputs that can be easily submitted to a variety of group level analyses, including task-based or resting-state fMRI, graph theory measures, and surface or volume-based statistics. |
| MRIQC | NiPreps (NeuroImaging PREProcessing tools) | MRIQC extracts no-reference IQMs (image quality metrics) from structural (T1w and T2w) and functional MRI (magnetic resonance imaging) data. (not directly used for analyses) | |
| Sammons Preston Jamar Hydraulic Hand Dynamometer | Alpha Med Inc. | SKU SAMP5030J1 | From the website: Ideal for routine screening of grip strength and initial and ongoing evaluation of clients with hand trauma and dysfunction. Unit comes with carrying/storage case, certificate of calibration and complete instructions. Warranted for one full year. The warranty does not cover calibration. Latex free. |
| SPRI 5-Pound Vinyl-Coated Weight | SPRI | Amazon | N/A | Color: (E) Dark Blue | 5-Pound. Appears on Amazon: Dumbbells Hand Weights Set of 2 - Vinyl Coated Exercise & Fitness Dumbbell for Home Gym Equipment Workouts Strength Training Free Weights for Women, Men (1-10 Pound, 12, 15, 18, 20 lb), https://www.amazon.com/stores/SPRI/Weights/page/9D10835A-CFAB-4DA1-BEE9-AE993C6B5BC1 |
| SPRI 8-Pound Vinyl-Coated Weight | SPRI | Amazon | N/A | Color: (H) Black |8-Pound. Appears on Amazon: Dumbbells Hand Weights Set of 2 - Vinyl Coated Exercise & Fitness Dumbbell for Home Gym Equipment Workouts Strength Training Free Weights for Women, Men (1-10 Pound, 12, 15, 18, 20 lb), https://www.amazon.com/stores/SPRI/Weights/page/9D10835A-CFAB-4DA1-BEE9-AE993C6B5BC1 |
References
- Heidari, F., Afshari, M., Moosazadeh, M. Prevalence of fibromyalgia in general population and patients, a systematic review and meta-analysis. Rheumatology International. 37 (9), 1527-1539 (2017).
- Dennis, N. L., Larkin, M., Derbyshire, S. W. G. 'A giant mess' - making sense of complexity in the accounts of people with fibromyalgia. British Journal of Health Psychology. 18 (4), 763-781 (2013).
- Woodbury, A. Opioids for nonmalignant chronic pain. AMA Journal of Ethics. 17 (3), 202-208 (2015).
- Hedegaard, H., Minino, A. M., Spencer, M. R., Warner, M. Drug overdose deaths in the United States, 1999-2020. NCHS Data Brief. 428, 1-8 (2021).
- Report No.: 17-01846-316. Opioid prescribing to high-risk veterans receiving VA purchased care. Office of Healthcare Inspections. , Department of Veterans Affairs. (2017).
- Perry, R., Leach, V., Davies, P., Penfold, C., Ness, A., Churchill, R. An overview of systematic reviews of complementary and alternative therapies for fibromyalgia using both AMSTAR and ROBIS as quality assessment tools. Systematic Reviews. 6 (1), 97(2017).
- Martinez-Lavin, M., Hermosillo, A. G. Dysautonomia in Gulf War syndrome and in fibromyalgia. The American Journal of Medicine. 118 (4), 446(2005).
- Petersel, D. L., Dror, V., Cheung, R. Central amplification and fibromyalgia: disorder of pain processing. Journal of Neuroscience Research. 89 (1), 29-34 (2011).
- Marlow, N. M., Bonilha, H. S., Short, E. B. Efficacy of transcranial direct current stimulation and repetitive transcranial magnetic stimulation for treating fibromyalgia syndrome: A systematic review. Pain Practice. 13 (2), 131-145 (2013).
- Molero-Chamizo, A., et al. Noninvasive transcutaneous vagus nerve stimulation for the treatment of fibromyalgia symptoms: A study protocol. Brain sciences. 12 (1), 95(2022).
- Cimpianu, C. L., et al. Vagus nerve stimulation in psychiatry: A systematic review of the available evidence. Journal of Neural Transmission. 124 (1), 145-158 (2017).
- Napadow, V., et al. Evoked pain analgesia in chronic pelvic pain patients using respiratory-gated auricular vagal afferent nerve stimulation. Pain Medicine (Malden, Mass). 13 (6), 777-789 (2012).
- Zhang, Y., et al. Transcutaneous auricular vagus nerve stimulation (taVNS) for migraine: an fMRI study. Regional Anesthesia and Pain. 46 (2), 145-150 (2021).
- Tassorelli, C., et al. Noninvasive vagus nerve stimulation as acute therapy for migraine: The randomized PRESTO study. Neurology. 91 (4), e364-e373 (2018).
- NBC4 Washington - Electrotherapy Device Treats Anxiety, Insomnia, Depression. Alpha-Stim. , https://alpha-stim.com/blog/nbc4-washington-electrotherapy-device-treats-anxiety-insomnia-depression/ (2021).
- Taylor, A. G., Anderson, J. G., Riedel, S. L., Lewis, J. E., Bourguignon, C. A randomized, controlled, double-blind pilot study of the effects of cranial electrical stimulation on activity in brain pain processing regions in individuals with fibromyalgia. Explore (NY). 9 (1), 32-40 (2013).
- Taylor, A. G., Anderson, J. G., Riedel, S. L., Lewis, J. E., Kinser, P. A., Bourguignon, C. Cranial electrical stimulation improves symptoms and functional status in individuals with fibromyalgia. Pain Management Nursing. 14 (4), 327-335 (2013).
- Lichtbroun, A. S., Raicer, M. M., Smith, R. B. The treatment of fibromyalgia with cranial electrotherapy stimulation. Journal of Clinical Rheumatology. 7 (2), 72-78 (2001).
- Shekelle, P. G., Cook, I. A., Miake-Lye, I. M., Booth, M. S., Beroes, J. M., Mak, S. Benefits and harms of cranial electrical stimulation for chronic painful conditions, depression, anxiety, and insomnia: A systematic review. Annals of Internal Medicine. 168 (6), 414-421 (2018).
- Dailey, D. L., et al. Perceived function and physical performance are associated with pain and fatigue in women with fibromyalgia. Arthritis Research & Therapy. 18, 68(2016).
- Gowans, S. E., deHueck, A., Voss, S., Silaj, A., Abbey, S. E., Reynolds, W. J. Effect of a randomized, controlled trial of exercise on mood and physical function in individuals with fibromyalgia. Arthritis & Rheumatism. 45 (6), 519-529 (2001).
- Jones, J., Rutledge, D. N., Jones, K. D., Matallana, L., Rooks, D. S. Self-Assessed physical function levels of women with fibromyalgia: A national survey. Women's Health Issues. 18 (5), 406-412 (2008).
- Rikli, R. E., Jones, C. J. Development and validation of criterion-referenced clinically relevant fitness standards for maintaining physical independence in later years. The Gerontologist. 53 (2), 255-267 (2013).
- Feusner, J. D., et al. Effects of cranial electrotherapy stimulation on resting state brain activity. Brain and Behavior. 2 (3), 211-220 (2012).
- Harris, R. E., et al. Pregabalin rectifies aberrant brain chemistry, connectivity, and functional response in chronic pain patients. Anesthesiology. 119 (6), 1453-1464 (2013).
- Napadow, V., Harris, R. E. What has functional connectivity and chemical neuroimaging in fibromyalgia taught us about the mechanisms and management of 'centralized' pain. Arthritis Research & Therapy. 16 (5), 425(2014).
- Schroeder, M. J., Barr, R. E. Quantitative analysis of the electroencephalogram during cranial electrotherapy stimulation. Clinical Neurophysiology. 112 (11), 2075-2083 (2001).
- Cordes, D., et al. Mapping functionally related regions of brain with functional connectivity MR imaging. American Journal of Neuroradiology. 21 (9), 1636-1644 (2000).
- Hassett, A. L., Aquino, J. K., Ilgen, M. A. The risk of suicide mortality in chronic pain patients. Current Pain and Headache Reports. 18 (8), 436(2014).
- Stenager, E., Christiansen, E., Handberg, G., Jensen, B. Suicide attempts in chronic pain patients. A register-based study. Scandinavian Journal of Pain. 5 (1), 4-7 (2014).
- Woodbury, A., et al. Feasibility of auricular field stimulation in fibromyalgia: Evaluation by functional magnetic resonance imaging, randomized trial. Pain Medicine. 22 (3), 715-726 (2021).
- Wolfe, F., et al. Revisions to the 2010/2011 fibromyalgia diagnostic criteria. Seminars in Arthritis and Rheumatism. 46 (3), 319-329 (2016).
- Polomano, R. C., et al. Psychometric testing of the defense and veterans pain rating scale (DVPRS): A new pain scale for military population. Pain Medicine. 17 (8), 1505-1519 (2016).
- Electromedical Products International, Inc. Scientific and clinical literature examination for the Alpha-Stim M microcurrent and cranial electrotherapy stimulator. , Mineral Wells. Texas. (2016).
- Lein, D. H. Jr, Alotaibi, M., Almutairi, M., Singh, H. Normative reference values and validity for the 30-second chair-stand test in healthy young adults. International Journal of Sports Physical Therapy. 17 (5), 907-914 (2022).
- Revicki, D. A., Cook, K. F., Amtmann, D., Harnam, N., Chen, W. H., Keefe, F. J. Exploratory and confirmatory factor analysis of the PROMIS pain quality item bank. Quality of Life Research. 23 (1), 245-255 (2014).
- Tustison, N. J., et al. N4ITK: improved N3 bias correction. IEEE Transactions on Medical Imaging. 29 (6), 1310-1320 (2010).
- Avants, B. B., Epstein, C. L., Grossman, M., Gee, J. C. Symmetric diffeomorphic image registration with cross-correlation: evaluating automated labeling of elderly and neurodegenerative brain. Medical Image Analysis. 12 (1), 26-41 (2008).
- Zhang, Y., Brady, M., Smith, S. Segmentation of brain MR images through a hidden Markov random field model and the expectation-maximization algorithm. IEEE Transactions on Medical Imaging. 20 (1), 45-57 (2001).
- Dale, A. M., Fischl, B., Sereno, M. I. Cortical surface-based analysis: I. Segmentation and surface reconstruction. NeuroImage. 9 (2), 179-194 (1999).
- Klein, A., et al. Mindboggling morphometry of human brains. PLoS Computational Biology. 13 (2), e1005350(2017).
- Fonov, V. S., Evans, A. C., McKinstry, R. C., Almli, C. R., Collins, D. L. Unbiased nonlinear average age-appropriate brain templates from birth to adulthood. NeuroImage. 47 (Supplement 1), S102(2009).
- Evans, A. C., Janke, A. L., Collins, D. L., Baillet, S. Brain templates and atlases. NeuroImage. 62 (2), 911-922 (2012).
- Greve, D. N., Fischl, B. Accurate and robust brain image alignment using boundary-based registration. NeuroImage. 48 (1), 63-72 (2009).
- Jenkinson, M., Bannister, P., Brady, M., Smith, S. Improved optimization for the robust and accurate linear registration and motion correction of brain images. NeuroImage. 17 (2), 825-841 (2002).
- Cox, R. W., Hyde, J. S. Software tools for analysis and visualization of fMRI data. NMR in Biomedicine. 10 (4-5), 171-178 (1997).
- Pruim, R. H. R., Mennes, M., van Rooij, D., Llera, A., Buitelaar, J. K., Beckmann, C. F. ICA-AROMA: A robust ICA-based strategy for removing motion artifacts from fMRI data. NeuroImage. 112, 267-277 (2015).
- Power, J. D., Mitra, A., Laumann, T. O., Snyder, A. Z., Schlaggar, B. L., Petersen, S. E. Methods to detect, characterize, and remove motion artifact in resting state fMRI. NeuroImage. 84, 320-341 (2014).
- Behzadi, Y., Restom, K., Liau, J., Liu, T. T. A component based noise correction method (CompCor) for BOLD and perfusion based fMRI. NeuroImage. 37 (1), 90-101 (2007).
- Satterthwaite, T. D., et al. An improved framework for confound regression and filtering for control of motion artifact in the preprocessing of resting-state functional connectivity data. NeuroImage. 64, 240-256 (2013).
- Lanczos, C. Evaluation of noisy data. Journal of the Society for Industrial and Applied Mathematics Series B Numerical Analysis. 1 (1), 76(1964).
- Oscar, E., et al. fMRIPrep: A robust preprocessing pipeline for functional MRI. Nature Methods. 16, 111-116 (2019).
- Oscar, E., et al. FMRIPrep. Software. Zenodo. , (2018).
- Gorgolewski, K. J., et al. Nipype: a flexible, lightweight and extensible neuroimaging data processing framework in python. Frontiers in Neuroinformatics. 5, 13(2011).
- Gorgolewski, K. J., et al. Nipype. Software. Zenodo. , (2018).
- Abraham, A., et al. Machine learning for neuroimaging with scikit-learn. Frontiers in Neuroinformatics. 8, 14(2014).
- Yeh, F. -C., Badre, D., Verstynen, T. Connectometry: A statistical approach harnessing the analytical potential of the local connectome. NeuroImage. 125 (2016), 162-171 (2015).
- Andersson, J. L. R., Skare, S., Ashburner, J. How to correct susceptibility distortions in spin-echo echo-planar images: application to diffusion tensor imaging. NeuroImage. 20 (2), 870-888 (2003).
- Smith, S. M., et al. Advances in functional and structural MR image analysis and implementation as FSL. NeuroImage. 23 (S1), 208-219 (2004).
- Andersson, J. L. R., Sotiropoulos, S. N. An integrated approach to correction for off-resonance effects and subject movement in diffusion MR imaging. NeuroImage. 125, 1063-1078 (2016).
- Yeh, F. -C., Tseng, W. -Y. I. NTU-90: a high angular resolution brain atlas constructed by -q-space diffeomorphic reconstruction. Neuroimage. 58 (1), 91-99 (2011).
- Nieto-Castanon, A. Cluster-Level Inferences. Handbook of Functional Connectivity Magnetic Resonance Imaging Methods in CONN. , Hilbert Press. Boston, MA. (2020).
- Hemington, K. S., Wu, Q., Kucyi, A., Inman, R. D., Davis, K. D. Abnormal cross-network functional connectivity in chronic pain and its association with clinical symptoms. Brain Structure & Function. 221 (8), 4203-4219 (2016).
- Ichesco, E., et al. Altered resting state connectivity of the insular cortex in individuals with fibromyalgia. Journal of Pain. 15 (8), 815-826 (2014).
- Kim, J., et al. The somatosensory link in fibromyalgia: functional connectivity of the primary somatosensory cortex is altered by sustained pain and is associated with clinical/autonomic dysfunction. Arthritis & Rheumatology. 67 (5), 1395-1405 (2015).
- Napadow, V., LaCount, L., Park, K., As-Sanie, S., Clauw, D. J., Harris, R. E. Intrinsic brain connectivity in fibromyalgia is associated with chronic pain intensity. Arthritis and Rheumatism. 62 (8), 2545-2555 (2010).
- Napadow, V., Kim, J., Clauw, D. J., Harris, R. E. Decreased intrinsic brain connectivity is associated with reduced clinical pain in fibromyalgia. Arthritis and Rheumatism. 64 (7), 2398-2403 (2012).
- Puiu, T., et al. Association of alterations in gray matter volume with reduced evoked-pain connectivity following short-term administration of pregabalin in patients with fibromyalgia. Arthritis & Rheumatology. 68 (6), 1511-1521 (2016).
- Fallon, N., Chiu, Y., Nurmikko, T., Stancak, A. Functional Connectivity with the default mode network is altered in fibromyalgia patients. PLoS One. 11 (7), e0159198(2016).
- Wang, Y., Kang, J., Kemmer, P. B., Guo, Y. An efficient and reliable statistical method for estimating functional connectivity in large scale brain networks using partial correlation. Frontiers in Neuroscience. 10, 123(2016).
- Mease, P. J., et al. Estimation of minimum clinically important difference for pain in fibromyalgia. Arthritis Care and Research (Hoboken). 63 (6), 821-826 (2011).
- Bingel, U., et al. Somatotopic organization of human somatosensory cortices for pain: a single trial fMRI study. NeuroImage. 23 (1), 224-232 (2004).
- Wager, T. D., et al. Pain in the ACC. Proceedings of the National Academy of Sciences of the United States of America. 113 (18), E2474-E2475 (2016).
- Nieto-Castanon, A. FMRI Denoising Pipeline. Handbook of Functional Connectivity Magnetic Resonance Imaging Methods in CONN. , Hilbert Press. Boston, MA. (2020).
- Friston, K. J., Williams, S., Howard, R., Frackowiak, R. S., Turner, R. Movement-related effects in fMRI time-series. Magnetic Resonance in Medicine. 35 (3), 346-355 (1996).
- Hallquist, M. N., Hwang, K., Luna, B. The nuisance of nuisance regression: spectral misspecification in a common approach to resting-state fMRI preprocessing reintroduces noise and obscures functional connectivity. NeuroImage. 82, 208-225 (2013).
- Chai, X. J., Nieto-Castanon, A., Ongur, D., Whitfield-Gabrieli, S. Anticorrelations in resting state networks without global signal regression. NeuroImage. 59 (2), 1420-1428 (2012).
- Nieto-Castanon, A. General Linear Model. Handbook of Functional Connectivity Magnetic Resonance Imaging Methods in CONN. , Hilbert Press. Boston, MA. (2020).
- Worsley, K. J., Marrett, S., Neelin, P., Vandal, A. C., Friston, K. J., Evans, A. C. A unified statistical approach for determining significant signals in images of cerebral activation. Human Brain Mapping. 4 (1), 58-73 (1996).
- Chumbley, J., Worsley, K., Flandin, G., Friston, K. Topological FDR for neuroimaging. NeuroImage. 49 (4), 3057-3064 (2010).
- Page, S. J., Persch, A. C. Recruitment, retention, and blinding in clinical trials. The American Journal of Occupational Therapy. 67 (2), 154-161 (2013).
- McGrath, R. E., Mitchell, M., Kim, B. H., Hough, L. Evidence for response bias as a source of error variance in applied assessment. Psychological Bulletin. 136 (3), 450-470 (2010).
- Robinson-Papp, J., George, M. C., Dorfman, D., Simpson, D. M. Barriers to chronic pain measurement: A qualitative study of patient perspectives. Pain Medicine. 16 (7), 1256-1264 (2015).
Access restricted. Please log in or start a trial to view this content.
Reprints and Permissions
