Ultrasound imaging is becoming more accessible in clinical and research settings, and a consistent protocol will be beneficial for comparison between studies and for clinical interpretations. This protocol for ultrasound evaluation is a valid and reliable method to evaluate Achilles tendon morphology in healthy, tendinopathic, and ruptured tendons.
Method Article
Measurement of Healthy and Injured Triceps Surae Morphology
Opens in a new tab
In This Article
Summary
Loading...
$$\rightleftharpoonup{xx}$$
$$\longleftharp{xx}$$,
$$\longrightharp{xx}$$,
Abstract
Loading...
$$\rightleftharpoonup{xx}$$
$$\longleftharp{xx}$$,
$$\longrightharp{xx}$$,
Achilles tendon injuries occur throughout the lifespan and can negatively affect quality of life and overall health. Achilles tendinopathy is generally classified as an overuse injury associated with fusiform tendon thickening, neovascularization, and interstitial tendon degeneration. Current literature suggests these structural changes are associated with symptoms and lower physical activity levels, as well as symptoms and lower extremity function in the long term. Surgically and non-surgically managed Achilles tendon ruptures result in increased tendon cross-sectional area (CSA) and a lengthened Achilles tendon. Both structural outcomes have clinical implications, as larger CSA positively predicts function, whereas increased tendon lengthening predicts reduced function after Achilles tendon rupture. Given the relationship between structural changes associated with Achilles tendon injuries for both injury severity and injury recovery, it is critical to be able to quantify Achilles tendon structure reliably and accurately. Silbernagel's group has established a valid and reliable method for efficiently evaluating triceps surae muscle and tendon structure. In this protocol, B-mode musculoskeletal ultrasound imaging is used to measure triceps surae structure, including Achilles tendon thickness and CSA, soleus thickness, and the presence of additional findings (calcifications and bursitis). B-mode extended field-of-view is used to measure Achilles tendon length and gastrocnemius anatomical CSA. Finally, power Doppler is used to identify intratendinous neovascularization. Quantification of triceps surae structure allows for comparison between limbs as well as longitudinal changes in response to exercise and treatment for healthy individuals and those with Achilles tendon injuries. This protocol has been used in many research studies to date and proves valuable in understanding the relationship between tendon structure and injury development, severity, and recovery. As ultrasound devices are becoming more affordable and portable, this protocol proves promising as a clinical tool, given its quick and efficient methods.
Introduction
Loading...
$$\rightleftharpoonup{xx}$$
$$\longleftharp{xx}$$,
$$\longrightharp{xx}$$,
The Achilles tendon originates at the myotendinous junctions of the gastrocnemius and soleus muscles and inserts on the posterior calcaneus. The Achilles tendon consists primarily of densely packed, organized collagen tissue arranged in a hierarchical fashion to maximize tensile strength1. Despite its ability to withstand heavy forces, the Achilles tendon is susceptible to several types of injuries throughout one's lifespan. These injuries, such as Achilles tendinopathy and Achilles tendon ruptures, are often accompanied by changes in the structure of the triceps surae and surrounding tissues. In Achilles tendinopathy, patients often exhibit fusiform tendon thickening, tendinosis, collagen disorganization, and neovascularization, a process of proliferation of vascular and neural tissue into the tendon2. Additionally, pathological changes associated with Achilles tendinopathy include paratendinitis, intratendinous, and/or entheseal calcifications, and bursitis2,3. After Achilles tendon ruptures, structural changes are common occurrences, irrespective of treatment, and include Achilles tendon thickening and increased tendon length4,5. Furthermore, muscular changes, such as triceps surae muscular atrophy, are also commonly associated with Achilles tendon injuries5,6.
The ability to assess triceps surae and surrounding tissue structures provides valuable insight into structural integrity, tissue quality, and size, which are known to relate to symptoms, function, and prognosis4,7,8,9. Ultrasound imaging is a reliable and valid assessment tool of these structures, including, but not limited to, Achilles tendon length10, thickness10,11, cross-sectional area (CSA)12, gastrocnemius anatomical CSA13, and neovascularization14,15. Assessment of these measures provides valuable insight into the understanding of healthy triceps surae tissue, as well as quantification of structural alterations to evaluate injury risk, severity, and recovery, as well as understanding healthy tissue qualities16.
Despite the clinical and research utility of ultrasound imaging in assessing triceps surae structure, there are often differences in imaging techniques and measurement parameters among clinical and research studies17,18. As a result, comparisons between studies are difficult. Therefore, the purpose of this methods paper is to describe a valid and reliable protocol for efficiently evaluating triceps surae muscle and tendon structure using musculoskeletal ultrasound imaging. This protocol aims to demonstrate the feasibility of incorporating this tool into research and clinical settings through its entirety or as specific parts in healthy and injured individuals. In addition, representative values for healthy and injured triceps surae are provided.
Access restricted. Please log in or start a trial to view this content.
Protocol
Loading...
$$\rightleftharpoonup{xx}$$
$$\longleftharp{xx}$$,
$$\longrightharp{xx}$$,
The following protocol follows the guidelines set forth by and has been approved by the University Institutional Review Board to ensure safe and ethical human subject research. All subjects provided informed consent for participation in the research studies and dissemination of data. The full protocol takes approximately 20 minutes to perform by a trained sonographer. However, individual measurements may be taken per assessment need.
1. Marking of the skin
- Ask the participant to be seated at the end of a plinth with their legs hanging off the table.
- Palpate and mark the medial tibial plateau and most distal aspect of the medial malleolus bilaterally. Measure the distance between the ipsilateral markings to determine tibial length.
- Calculate 25% of the tibial length. Measure and mark this distance, distal from the medial tibial plateau, to indicate the location for gastrocnemius measurements (Figure 1).
- Calculate 30% of the tibial length. Measure and mark this distance, proximal from the most distal aspect of the medial malleolus, to indicate the location for soleus measurements (Figure 1).
- Record the 25% and 30% tibial length for longitudinally measuring the same location during future evaluations.
- Ask the participant to move into a prone position on the plinth with the knees fully extended and their feet hanging relaxed off the edge of the plinth with ankles in a resting position (Figure 2).
- Transfer the gastrocnemius and soleus markings to the posterior aspect of the lower leg. Palpate and mark the midpoint of the gastrocnemius (the distal most point between the two muscle bellies). Ask the participant to gently plantarflex against manual resistance to palpate this location.
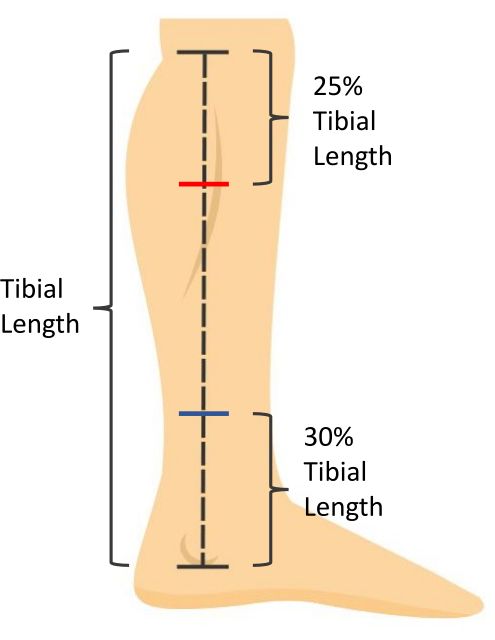
Figure 1: Skin measurement markings. Tibial length is measured as the distance from the medial tibial plateau to the most distal aspect of the medial malleolus. Soleus muscle thickness is measured at 30% of the tibial length proximal to the most distal aspect of the medial malleolus (blue mark). Gastrocnemius muscle CSA is measured at 25% of the tibial length distal to the medial tibial plateau (red mark). Please click here to view a larger version of this figure.
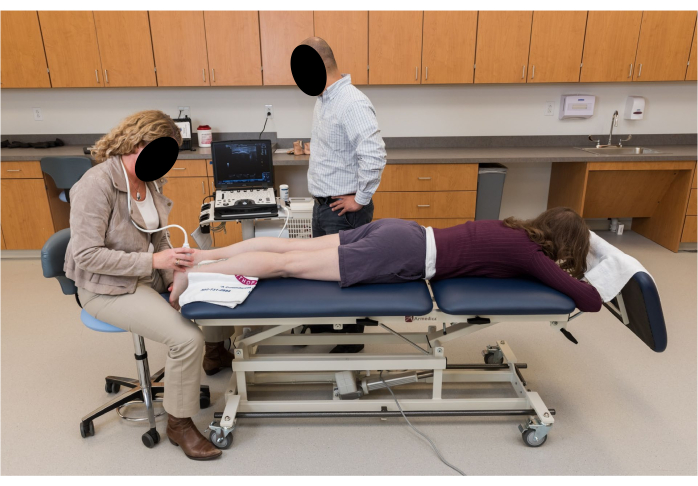
Figure 2: Participant positioning for ultrasound imaging. The participant is prone with knees fully extended and feet hanging relaxed in a resting ankle position off the edge of the plinth. Please click here to view a larger version of this figure.
2. Ultrasound imaging
NOTE: All images will be taken on both legs. All images should be taken along the midline of the Achilles tendon. Use palpation of the medial and lateral borders of the Achilles tendon to determine midline location.
- Use B-mode ultrasound with a 5 cm linear array transducer with parameters set for visualization of the triceps surae. Set frequency to 10 MHz and depth of measurement to 3.5 cm for visualization. Adjust the foci between 0.75 cm and 1.75 cm with gain adjusted to 49 for optimal visualization of tissue.
NOTE: Depth, foci, and gain may be adjusted as appropriate for visualization. - Place ultrasound gel on the posterior calcaneus. Holding the probe on the long axis, visualize the proximal calcaneal notch and align the notch with the midpoint of the ultrasound probe. Mark this location on the skin (Figure 3).
- Marking the skin for measurement of Achilles tendon thickness and CSA will vary depending on the participant. Use the following guidelines to determine this position.
- For healthy individuals, measure 2 cm proximal from the proximal calcaneal notch and mark this location on the skin.
- For individuals with Achilles tendinopathy, visualize the thickest portion of the Achilles tendon with the ultrasound probe on the long axis and mark this location on the skin. Record the distance of this marking from the proximal calcaneal notch forlongitudinally measuring the same location during future evaluations.
- For individuals with Achilles tendinopathy without visible fusiform thickening, mark the skin at the location of most tendon pain upon palpation. Record the distance of this marking from the proximal calcaneal notch for longitudinally measuring the same location during future evaluations.
- For individuals post Achilles tendon rupture, visualize the location of rupture with the ultrasound probe in the long axis and mark this location on the skin. Record the distance of this marking from the proximal calcaneal notch for longitudinally measuring the same location during future evaluations.
- For the uninvolved limb, make the skin marking at the same distance from the proximal calcaneal notch as the involved limb.
- Gastrocnemius tendon length (Full tendon length): Using an extended field-of-view and holding the probe on the long axis, begin the image at the calcaneus by visualizing the Achilles tendon insertion. Glide the probe proximally along the midline of the Achilles tendon towards the mark at the gastrocnemius midpoint until the myotendinous junction is visualized. This will end the image. Take three images of the Achilles' full tendon length (Figure 4).
- Soleus tendon length (Free tendon length): Using an extended field-of-view and holding the probe on the long axis, begin the image at the calcaneus by visualizing the Achilles tendon insertion. Glide the probe proximally along the midline of the Achilles tendon towards the mark at the soleus until the soleus myotendinous junction is visualized. Take three images of the Achilles' free tendon length.
- Achilles tendon thickness: Using the B-mode view, place the probe on the long axis on the skin marking made for Achilles tendon thickness and CSA (step 2.3). Take three images of Achilles tendon thickness.
- Achilles tendon cross-sectional area: Using the B-mode view, place a gel standoff pad on the skin marking made for Achilles tendon thickness and CSA (step 2.3). Holding the probe on the short axis, take three images of the Achilles tendon cross-section.
NOTE: Tendon is of an anisotropic quality; depending on the angle of the sound waves, it will reflect back, making it look bright, or reflect away, making it look dark (Figure 5). Therefore, toggling the probe back and forth will help with visualizing the border of the tendon. - Soleus thickness: Using the B-mode view, place the probe on the long axis on the skin marking made for the soleus (30% of the tibial length from the distal aspect of the medial malleolus). Visualize the anterior border of the soleus muscle. Take three images for soleus thickness19.
- To distinguish between the soleus and flexor hallucis longus, have the participant actively flex and extend the great toe. This will cause movement of the fibers of the flexor hallucis longus without moving the soleus fibers.
- Gastrocnemius cross-sectional area: Using an extended field-of-view, hold the ultrasound probe on the short axis and in line with the mark for the gastrocnemius (25% of the tibial length from the medial tibial plateau). Visualize the medial border of the medial gastrocnemius and begin the image by gliding the probe from medial to lateral until the lateral border of the lateral gastrocnemius is visualized. Take three images for gastrocnemius CSA13.
- To capture the most medial aspect of the medial gastrocnemius it may be needed to ask the participant to abduct their legs and internally rotate the hip slightly. If this is required, ensure the participant is not plantarflexing their foot, as this will impact measurements.
- Using the B-mode view, determine the presence or absence of calcifications within the Achilles tendon (Figure 6D) and/or at the Achilles tendon insertion (enthesis; Figure 6C). These calcifications are unattached from the calcaneus and appear as hyperechoic areas with a shadow below, present in multiple planes of view. Take an image to confirm the findings. Note whether the calcifications occur within the Achilles tendon or at the enthesis.
- Using the B-mode view, determine the presence or absence of bursitis. This is visualized by a hypoechoic area deep to the Achilles tendon at the proximal calcaneus (retrocalcaneal bursitis) and/or superficial to the Achilles tendon insertion (subcutaneous calcaneal bursitis). Take an image to confirm the findings (Figure 6B).
- Using the Doppler setting on the ultrasound, assess for the presence or absence of neovascularization within the Achilles tendon.
- Position the Doppler box (i.e., region of interest) on the tendon, hold the ultrasound probe still, and avoid pressing down or distending the tissue as this may occlude and prevent visualization of blood flow.
- Scan the length of the Achilles free tendon, being sure to assess each portion of the tendon without movement of the probe to prevent artifact. If there is vasculature visible within or in contact with the tendon, take three, 3 s videos in the region with maximal blood flow (Figure 6A).

Figure 3: Achilles tendon thickness and CSA measurement locations. Extended field of view ultrasound images of (A) a healthy and (B) tendinopathic Achilles tendon. Dotted lines indicate tendon borders. Red arrows indicate measurement locations. Yellow lines indicate the distance proximal to the proximal calcaneal notch (white arrow). In the case of thickening at the 2 cm mark (B), healthy tendon thickness should be taken at a healthy area in the free tendon (blue arrow). Please click here to view a larger version of this figure.
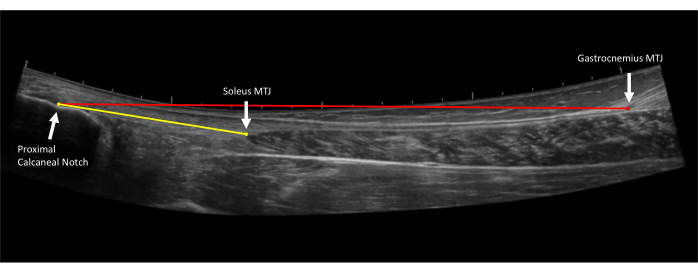
Figure 4: Achilles tendon length measurements. Extended field of view ultrasound image of the Achilles tendon. Free tendon length (yellow line) is measured from the proximal Achilles tendon insertion on the proximal calcaneal notch to the soleus myotendinous junction (MTJ). Full tendon length (red line) is measured from the proximal Achilles tendon insertion on the proximal calcaneal notch to the gastrocnemius myotendinous junction (MTJ)10. Please click here to view a larger version of this figure.
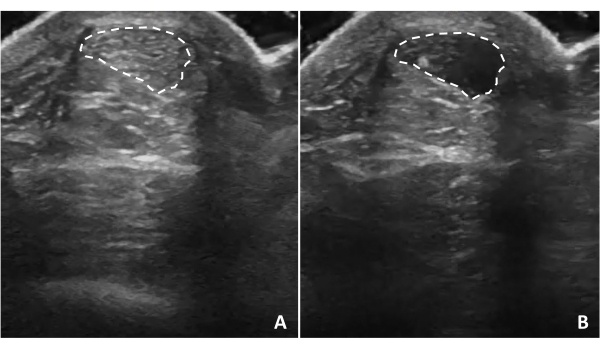
Figure 5: Tendon anisotropy. Achilles tendon anisotropy occurs when the ultrasound waves are not perpendicular to the structure. Tilting the ultrasound probe will cause the tendon structure to appear (A) hyperechoic or (B) hypoechoic depending on the relationship of ultrasound waves to the tendon. Dotted lines indicate tendon borders. Please click here to view a larger version of this figure.

Figure 6: Additional ultrasound imaging findings. (A) Neovascularization, (B) retrocalcaneal bursitis, (C) entheseal calcifications, (D) intratendinous calcifications. Areas colored red and yellow indicate blood flow within the tendon region of interest (yellow box). Dotted lines indicate bursa borders. Arrows indicate calcifications20. Please click here to view a larger version of this figure.
3. Ultrasound measurements
NOTE: Ultrasound measurements can be made on the machine based on the settings and tools for the respective ultrasound machine. Images can also be exported for taking measurements on software such as Osirix DICOM viewer. The average of the three trials for each measure will be used for analysis.
- Gastrocnemius tendon length (full tendon length): Open the longer extended field-of-view tendon image (taken in step 2.4). Measure from the most proximal point of the tendon insertion (proximal calcaneal notch) to the gastrocnemius myotendinous junction (Figure 4).
- Soleus tendon length (free tendon length): Open the shorter extended field-of-view tendon image (taken in step 2.5). Measure from the most proximal point of the tendon insertion (proximal calcaneal notch) to the soleus myotendinous junction (Figure 4).
- Tendon thickness at 2 cm: Open the shoter extended field-of-view tendon image. Measure from the most proximal point of the tendon insertion (proximal calcaneal notch) to 2 cm, with the end of the measurement on the deep border of the tendon. Measure from this point on the deep border of the tendon to the direct superficial aspect of the tendon to get the 2 cm tendon thickness. This measure should represent healthy tendon thickness (Figure 7A).
- In the case of Achilles tendinopathy, if the tendon is thickened at this 2 cm distance, locate a healthy area in the free tendon to take this measurement and document the distance from the proximal calcaneal notch (Figure 7B).
NOTE: Thickness is used to describe the raw thickness of the tendon from the most superficial to deep.
- In the case of Achilles tendinopathy, if the tendon is thickened at this 2 cm distance, locate a healthy area in the free tendon to take this measurement and document the distance from the proximal calcaneal notch (Figure 7B).
- Tendon cross-sectional area: Open image taken in step 2.7. Visually identify the borders of the Achilles tendon and outline the circumference of the tendon (Figure 8A).
- Tendon thickness: Open image taken in step 2.6. At the center of the image, measure the Achilles tendon from the superficial border to the deep border of the tendon (Figure 8B).
- Soleus thickness: Open image taken in step 2.8. At the center of the image, measure from the superficial border to the deep border of the soleus muscle (Figure 9).
- Gastrocnemius cross-sectional area: Open image taken in step 2.9. Visualize the borders of both the medial and lateral heads of the gastrocnemius and outline the medial gastrocnemius and then the lateral gastrocnemius heads (Figure 10).
- Achilles tendon thickening: Use this calculation to determine the degree of thickening of the tendon in Achilles tendinopathy. Subtract thickness at 2 cm (or adjusted location; Figure 7A) from tendon thickness (Figure 7B) to obtain tendon thickening (measurement in step 3.5 minus measurement in step 3.3).
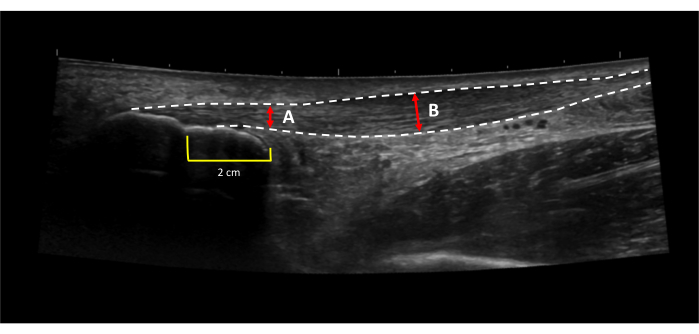
Figure 7: Achilles tendon thickening. Achilles tendon thickening is calculated by subtracting (A) the thickness of the healthy portion of the tendon from (B) the thickness of the thickest portion of the tendon31. Dotted lines indicate tendon borders. Red lines indicate tendon thickness. Yellow lines indicated a 2 cm distance proximal to the proximal calcaneal notch. Please click here to view a larger version of this figure.
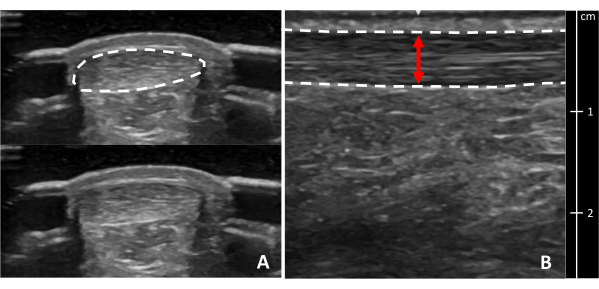
Figure 8: Achilles tendon cross-sectional area and thickness. Ultrasound images of the Achilles tendon in (A) cross-section and (B) longitudinal view at the thickest portion. Dotted lines indicate tendon borders. The red line indicates tendon thickness. A cross-section of the tendon is shown with and without a border for clarity. Please click here to view a larger version of this figure.

Figure 9: Soleus muscle thickness. Ultrasound image of the soleus muscle. Dotted lines indicate muscle borders. The red line indicates muscle thickness. Please click here to view a larger version of this figure.
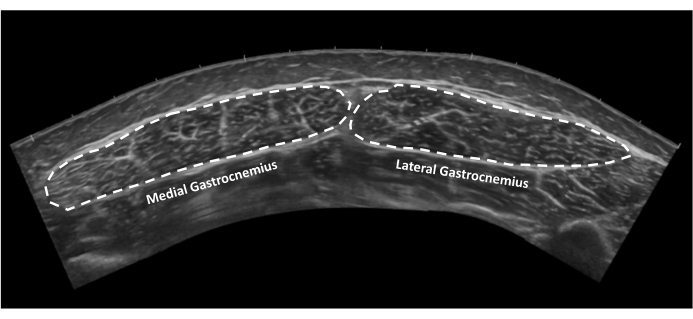
Figure 10: Gastrocnemius muscle cross-sectional area. Extended field of view ultrasound image of medial and lateral gastrocnemius muscles in cross-section. Dotted lines indicate tendon borders. Please click here to view a larger version of this figure.
Access restricted. Please log in or start a trial to view this content.
Results
Loading...
$$\rightleftharpoonup{xx}$$
$$\longleftharp{xx}$$,
$$\longrightharp{xx}$$,
The measures in this protocol have been demonstrated to be reliable and valid10,20. Excellent reliability has been reported for extended field-of-view Achilles tendon length to gastrocnemius (interclass correlation coefficient (ICC): 0.944) and Achilles tendon length to soleus (ICC: 0.898)10. The minimal detectable change at the group level (MDCgroup) for Achilles tendon length measures is 0.43 cm for length to gastrocnemius and...
Access restricted. Please log in or start a trial to view this content.
Discussion
Loading...
$$\rightleftharpoonup{xx}$$
$$\longleftharp{xx}$$,
$$\longrightharp{xx}$$,
Critical steps in the protocol to ensure the validity and reliability of the methods include the use of skin markings on participants to guide the ultrasound exam and the required training of individuals performing the measurements used in research studies. Skin markings at specific documented locations assist in the ability to assess variables of interest consistently and accurately at the same locations in the same individual over time. Furthermore, applying skin markings to different individuals in the same systematic...
Access restricted. Please log in or start a trial to view this content.
Disclosures
Loading...
$$\rightleftharpoonup{xx}$$
$$\longleftharp{xx}$$,
$$\longrightharp{xx}$$,
The authors have no conflicts of interest to disclose.
Acknowledgements
Loading...
$$\rightleftharpoonup{xx}$$
$$\longleftharp{xx}$$,
$$\longrightharp{xx}$$,
The authors would like to thank past and current members of the Delaware Tendon Research Group who have assisted in data collection using this protocol. Research reported in this publication was supported by the National Institute of Arthritis and Musculoskeletal and Skin Diseases of the National Institutes of Health under Award Numbers R01AR072034, R01AR078898, F31AR081663, R21AR067390, and by Eunice Kennedy Shriver National Institute of Child Health and Human Development of the National Institutes of Health under the award number T32HD007490. The content is solely the responsibility of the authors and does not necessarily represent the official views of the National Institutes of Health. Research reported in this publication was also supported by grants provided by the Swedish Research Council for Sport Science, the Stockholm County Council (ALF project), and the Swedish Research Council. This work was also supported in part by a Promotion of Doctoral Studies Scholarship from the Foundation for Physical Therapy Research and by the Rheumatology Research Foundation Medical and Graduate Student Preceptorship.
Access restricted. Please log in or start a trial to view this content.
Materials
| Name | Company | Catalog Number | Comments |
|---|---|---|---|
| Aquaflex Stand Off Pad | Parker Laboratories | E8317C | |
| Aquasonic ultrasound Gel | Parker Laboratories | E8365AF | |
| Linear Array Ultrasound Probe L4-12t-RS | GE Healthcare | 5495987 | |
| LOGIC e Ultrasound | GE Healthcare | E8349PA | |
| Osirix Dicom Viewer | Pixmeo SARL | Software for measurements |
References
Loading...
$$\rightleftharpoonup{xx}$$
$$\longleftharp{xx}$$,
$$\longrightharp{xx}$$,
- Millar, N. L., et al. Tendinopathy. Nat Rev Dis Primers. 7 (1), 1(2021).
- Silbernagel, K. G., Hanlon, S., Sprague, A. Current clinical concepts: Conservative management of Achilles tendinopathy. J Athl Train. 55 (5), 438-447 (2020).
- Chimenti, R. L., Cychosz, C. C., Hall, M. M., Phisitkul, P. Current concepts review update: insertional Achilles tendinopathy. Foot Ankle Int. 38 (10), 1160-1169 (2017).
- Zellers, J. A., Pohlig, R. T., Cortes, D. H., Grävare Silbernagel, K. Achilles tendon cross-sectional area at 12 weeks post-rupture relates to 1-year heel-rise height. Knee Surg Sports Traumatol Arthrosc. 28 (1), 245-252 (2020).
- Aufwerber, S., Edman, G., Grävare Silbernagel, K., Ackermann, P. W. Changes in tendon elongation and muscle atrophy over time after Achilles tendon rupture repair: a prospective cohort study on the effects of early functional mobilization. Am J Sports Med. 48 (13), 3296-3305 (2020).
- Heikkinen, J., et al. Tendon length, calf muscle atrophy, and strength deficit after acute Achilles tendon rupture: Long-term follow-up of patients in a previous study. J Bone Joint Surg Am. 99 (18), 1509-1515 (2017).
- Corrigan, P., Cortes, D. H., Pohlig, R. T., Grävare Silbernagel, K. Tendon morphology and mechanical properties are associated with the recovery of symptoms and function in patients with Achilles tendinopathy. Orthop J Sports Med. 8 (4), 2325967120917271(2020).
- De Jonge, S., et al. Relationship between neovascularization and clinical severity in Achilles tendinopathy in 556 paired measurements. Scand J Med Sci Sports. 24 (5), 773-778 (2014).
- De Jonge, S., et al. The tendon structure returns to asymptomatic values in nonoperatively treated Achilles tendinopathy but is not associated with symptoms: A prospective study. Am J Sports Med. 43 (12), 2950-2958 (2015).
- Silbernagel, K. G., Shelley, K., Powell, S., Varrecchia, S. Extended field of view ultrasound imaging to evaluate Achilles tendon length and thickness: A reliability and validity study. Muscles Ligaments Tendons J. 6 (1), 104-110 (2016).
- Albano, D., et al. Magnetic resonance and ultrasound in Achilles tendinopathy: predictive role and response assessment to platelet-rich plasma and adipose-derived stromal vascular fraction injection. Eur J Radiol. 95, 130-135 (2017).
- Alghamdi, N. H., Killian, M., Aitha, B., Pohlig, R. T., Silbernagel, K. G. Quantifying the dimensions of Achilles tendon insertional area using ultrasound imaging a validity and reliability study. Muscles Ligaments Tendons J. 9 (4), 544-551 (2019).
- Park, E. S., Sim, E., Rha, D. W., Jung, S. Estimation of gastrocnemius muscle volume using ultrasonography in children with spastic cerebral palsy. Yonsei Med J. 55 (4), 1115-1122 (2014).
- Risch, L., et al. Is sonographic assessment of intratendinous blood flow in achilles tendinopathy patients reliable?: Consistency of Doppler ultrasound modes and intra- and inter-observer reliability. Ultrasound Int Open. 2 (1), E13-E18 (2016).
- Risch, L., et al. Reliability of evaluating Achilles tendon vascularization assessed with Doppler ultrasound advanced dynamic flow. J Ultrasound Med. 37 (3), 737-744 (2018).
- Forney, M. C., Delzell, P. B. Musculoskeletal ultrasonography basics. Cleve Clin J Med. 85 (4), 283-300 (2018).
- Dams, O. C., Reininga, I. H. F., Gielen, J. L., van den Akker-Scheek, I., Zwerver, J. Imaging modalities in the diagnosis and monitoring of Achilles tendon ruptures: A systematic review. Injury. 48 (11), 2383-2399 (2017).
- Fredberg, U., Bolvig, L., Andersen, N. T., Stengaard-Pedersen, K. Ultrasonography in evaluation of Achilles and patella tendon thickness. Ultraschall Med. 29 (1), 60-65 (2007).
- Dudley-Javoroski, S., McMullen, T., Borgwardt, M. R., Peranich, L. M., Shields, R. K. Reliability and responsiveness of musculoskeletal ultrasound in subjects with and without spinal cord injury. Ultrasound Med Biol. 36 (10), 1594-1607 (2010).
- Zellers, J. A., Cortes, D. H., Pohlig, R. T., Silbernagel, K. G. Tendon morphology and mechanical properties assessed by ultrasound show change early in recovery and potential prognostic ability for 6-month outcomes. Knee Surg Sports Traumatol Arthrosc. 27 (9), 2831-2839 (2019).
- Zellers, J. A., Bley, B. C., Pohlig, R. T., Alghamdi, N. H., Silbernagel, K. G. Frequency of pathology on diagnostic ultrasound and relationship to patient demographics in individuals with insertional Achilles tendinopathy. Int J Sports Phys Ther. 14 (5), 761-769 (2019).
- de Jonge, S., et al. Incidence of midportion Achilles tendinopathy in the general population. Br J Sports Med. 45 (13), 1026-1028 (2011).
- Lemme, N. J., Li, N. Y., DeFroda, S. F., Kleiner, J., Owens, B. D. Epidemiology of Achilles tendon ruptures in the United States: athletic and nonathletic injuries from 2012 to 2016. Orthop J Sports Med. 6 (11), 2325967118808238(2018).
- Jackson, J. B. 3rd, Chu, C. H., Williams, K. A., Bornemann, P. H. Normal ultrasonographic parameters of the posterior tibial, peroneal, and Achilles tendons. Foot Ankle Spec. 12 (5), 480-485 (2019).
- Schmidt, W. A., Schmidt, H., Schicke, B., Gromnica-Ihle, E. Standard reference values for musculoskeletal ultrasonography. Ann Rheum Dis. 63 (8), 988-994 (2004).
- Ackermann, P. W., Hart, D. A. Metabolic Influences on Risk for Tendon Disorders. , Springer International Publishing, Switzerland. (2016).
- Westh, E., et al. Effect of habitual exercise on the structural and mechanical properties of human tendon, in vivo, in men and women. Scand J Med Sci Sports. 18 (1), 23-30 (2008).
- Cassel, M., et al. Prevalence of Achilles and patellar tendinopathy and their association to intratendinous changes in adolescent athletes. Scand J Med Sci Sports. 25 (3), e310-e318 (2015).
- Hirschmüller, A., et al. Achilles tendon power Doppler sonography in 953 long distance runners - a cross sectional study. Ultraschall Med. 31 (4), 387-393 (2010).
- Radovanović, G., Bohm, S., Arampatzis, A., Legerlotz, K. In Achilles tendinopathy the symptomatic tendon differs from the asymptomatic tendon while exercise therapy has little effect on asymmetries-an ancillary analysis of data from a controlled clinical trial. J Clin Med. 12 (3), 1102(2023).
- Corrigan, P., Cortes, D. H., Pontiggia, L., Silbernagel, K. G. The degree of tendinosis is related to symptom severity and physical activity levels in patients with midportion Achilles tendinopathy. Int J Sports Phys Ther. 13 (2), 196-207 (2018).
- Enriquez, J. L., Wu, T. S. An introduction to ultrasound equipment and knobology. Crit Care Clin. 30 (1), 25-45 (2014).
- Jacobson, J. A. Fundamentals of Musculoskeletal Ultrasound 3rd Edition. , Elsevier, Philadelphia. (2018).
- Scanlan, K. A. Sonographic artifacts and their origins. AJR Am J Roentgenol. 156 (6), 1267-1272 (1991).
- Gimber, L. H., et al. Artifacts at musculoskeletal US: resident and fellow education feature. Radiographics. 36 (2), 479-480 (2016).
Access restricted. Please log in or start a trial to view this content.
Reprints and Permissions
Request permission to reuse the text or figures of this JoVE article
Request Permission