Tropomodulin 3 (TMOD3) has been increasingly studied in tumors in recent years. This study is the first to report that TMOD3 is highly expressed in ovarian cancer and is closely associated with platinum resistance and immune infiltration. These results could help improve the therapeutic outcomes for ovarian cancer.
Method Article
Tropomodulin 3 Overexpression as a Marker for Platinum Resistance and Immune Infiltration in Ovarian Cancer
* These authors contributed equally
In This Article
Summary
Abstract
The cytoskeleton plays an important role in platinum resistance in ovarian cancer. Tropomodulin 3 (TMOD3) is critical in the development of many tumors, but its role in the drug resistance of ovarian cancer remains unexplored. By analyzing data from the Gene Expression Omnibus (GEO), The Cancer Genome Atlas (TCGA), and Clinical Proteomic Tumor Analysis Consortium (CPTAC) databases, this study compared TMOD3 expression in ovarian cancer and normal tissues, and examined the expression of TMOD3 after platinum treatment in platinum-sensitive and platinum-resistant ovarian cancers. The Kaplan-Meier method was used to assess the effect of TMOD3 on overall survival (OS) and progression-free survival (PFS) in ovarian cancer patients. microRNAs (miRNAs) targeting TMOD3 were predicted using TargetScan and analyzed using the TCGA database. Tumor Immune Estimation Resource (TIMER) and an integrated repository portal for tumor-immune system interactions (TISIDB) were used to determine the relationship between TMOD3 expression and immune infiltration. TMOD3 coexpression networks in ovarian cancer were explored using LinkedOmics, the Search Tool for the Retrieval of Interacting Genes/Proteins (STRING), and The Database for Annotation, Visualization, and Integrated Discovery (DAVID) Bioinformatics. The results showed that TMOD3 was highly expressed in ovarian cancer and was associated with the grading, staging, and metastasis of ovarian cancer. TMOD3 expression was significantly reduced in platinum-treated ovarian cancer cells and patients. However, TMOD3 expression was higher in platinum-resistant ovarian cancer cells and tissues compared to platinum-sensitive ones. Higher TMOD3 expression was significantly associated with lower OS and PFS in ovarian cancer patients treated with platinum-based chemotherapy. miRNA-mediated post-transcriptional regulation is likely responsible for high TMOD3 expression in ovarian cancer and platinum-resistant ovarian tissues. The expression of TMOD3 mRNA was associated with immune infiltration in ovarian cancer. These findings indicate that TMOD3 is highly expressed in ovarian cancer and is closely associated with platinum resistance and immune infiltration.
Introduction
Ovarian cancer is the second-highest in the mortality rate of gynecologic tumors worldwide1. It can be classified into three types based on histopathology: germ cell, gonadal mesenchymal, and epithelial tumors, of which 90% of patients are epithelial ovarian cancer. Risk factors associated with ovarian cancer include persistent ovulation, increased gonadotropin exposure, and inflammatory cytokines2. More than 75% of ovarian cancer cases are not detected until advanced stages, resulting in their lack of effective treatment. Patients with advanced ovarian cancer have a poor prognosis, with less than 20% of the 5-year survival rate despite new chemotherapy regimens, such as intraperitoneal administration and targeted therapy. The standard treatment for ovarian cancer mainly consists of tumor resection surgery followed by chemotherapy with drugs such as platinum and paclitaxel. However, tumor recurrence occurs in about 70% of cases1. Cisplatin exerts its therapeutic effects by interfering with DNA replication and transcription and is currently the first-line agent in ovarian cancer chemotherapy. However, a significant proportion of ovarian cancer patients are platinum-resistant3. Multiple cellular processes, such as drug efflux, cellular detoxification, DNA repair, apoptosis, and autophagy, are critical in platinum resistance in ovarian cancer cells4,5,6.
The alteration in the cytoskeleton is an important mechanism affecting platinum resistance in ovarian cancer. It has been recently reported that cytoskeleton-related genes are usually aberrantly expressed, and the actin cytoskeleton is significantly modified in the presence of cisplatin-triggered apoptosis7. Many studies have shown that cisplatin modulates the nanomechanics of ovarian cancer cells. The cell stiffness of sensitive cells increases with platinum dose-dependently, mainly contributed by the disruption of actin polymerization. In contrast, cisplatin-resistant cells showed no significant change in cell stiffness after cisplatin treatment8. Furthermore, the Young's moduli of cisplatin-sensitive ovarian cancer cells were lower, as revealed by atomic force microscopy. In contrast, cisplatin-resistant ovarian cancer cells exhibit a cytoskeleton characterized by long actin stress fibers. Inhibiting Rho GTPase decreases stiffness and enhances cisplatin sensitivity in these resistant cells. Conversely, activating Rho GTPase in cisplatin-sensitive cells increases cell stiffness and reduces their sensitivity to cisplatin9.The RNA-binding protein with multiple splicing (RBPMS), a tumor suppressor gene, reduces cisplatin resistance in ovarian cancer cells by regulating the protein expression of the cytoskeletal network and maintaining cell integrity10. Actin stress fibers are more pronounced in A2780/CP cells compared to A2780 cells. The development of drug resistance in ovarian cancer cells induces extensive reorganization of the actin cytoskeleton, thereby affecting cellular mechanical properties, motility, and intracellular drug transport11.
TMOD3 is a cytoskeleton-regulatory protein that prevents the depolymerization of actin by capping the slow-growing (pointed) ends of actin filaments12.TMOD3 plays different roles in different cell types by regulating actin dynamics and participates in various processes, such as promoting cell shape, cell migration, and muscle contraction. It was shown that TMOD3 deletion in mice leads to embryonic death at E14.5-E18.5, suggesting that TMOD3 may be a critical factor in embryonic development13. Based on its biological functions in stem and progenitor cells, TMOD3 may play an essential role in tumor progression. In hepatocellular carcinoma, TMOD3 promotes the growth, invasion, and migration of hepatocellular carcinoma cells by activating the MAPK/ERK signaling pathway14 and promotes distant metastasis by activating the PI3K-AKT pathway through interaction with the epidermal growth factor receptor15. MiRNA-490-3p inhibits hepatocellular carcinoma cell proliferation and invasion by targeting TMOD316. MiR-145 improves the radiosensitivity of radiation-resistant non-small cell lung cancer by inhibiting TMOD317. In vitro experiments revealed that TMOD3 mediated the invasion of esophageal cancer cells by regulating the cytoskeleton through interaction with lysyl oxidase homolog 2 (LOXL2)18. In addition, proteomic analysis revealed that high expression of TMOD3 could potentially mediate etoposide chemoresistance in lung cancer through the apoptotic pathway19. Although TMOD3 has been increasingly studied in tumors in recent years, there are still no reports on the role of TMOD3 in ovarian cancer and chemotherapy.
This study found that TMOD3 is upregulated in ovarian cancer. Notably, the upregulation of TMOD3 was associated with platinum resistance. This study also evaluated the prognostic value of TMOD3 in ovarian cancer and its correlation with tumor immune infiltration. This study suggests that overexpression of TMOD3 in ovarian cancer is associated with platinum resistance.
Protocol
1. Gene Expression Omnibus (GEO)
NOTE: TMOD3 expression in ovarian cancer, in ovarian cancer treated with platinum drugs, and in drug-resistant ovarian cancer were derived from the GEO datasets. The study type of all datasets was expression profiling by array, and the organisms were Homo sapiens.
- Go to the GEO database (see Table of Materials), and input keywords such as TMOD3, ovarian cancer, and drug-resistant or data accession in the search box (see Supplementary Figure 1A).
- Divide data into different groups in the Define group box. In the option menu, choose Benjamini and Hochberg (False discovery rate) in the Apply adjustment to the P-values box, and then click on analyzed in the GEO2R menu. Click on download full table to get the results.
- Investigate and plot the downloaded data with graphing and statistics software (see Supplementary Figure 1B).
- Use unpaired t-test for the comparison between two groups.
2. TNMplot
NOTE: TNMplot utilizes RNA-seq data from The Cancer Genome Atlas (TCGA), Therapeutic Research to Generate Effective Treatments (TARGET), and Genotype-Tissue Expression (GTEx) repositories20. The expression of TMOD3 in normal ovarian tissues and ovarian cancer was analyzed using TNMplot.
- Go to the TNMplot web tool (see Table of Materials), and click on Compare Tumor and Normal.
- Insert TMOD3 in Choose a gene box, and choose Ovarian Serous Cystadenocarcinoma in Choose tissue box.
- Click on start analysis to get the results (see Supplementary Figure 1C).
3. UALCAN
NOTE: The University of ALabama at Birmingham CANcer data analysis Portal (UALCAN) is a user-friendly online resource for analyzing publicly available cancer data21. Protein level expression of TMOD3 in normal tissue and ovarian cancer in CPTAC data was analyzed using UALCAN.
- Go to UALCAN (see Table of Materials) and click on the Proteomics menu.
- Insert TMOD3 in the Enter gene names box, and choose ovarian cancer in the CPTAC dataset box.
- Click on Explore to get the results (see Supplementary Figure 1D).
4. KM-plotter prognostic analysis
NOTE: The prognostic value of TMOD3 in ovarian cancer was analyzed using Kaplan Meier plotter (KM-plotter), including overall survival (OS) and progression-free survival (PFS)22.
- Go to KM-plotter (see Table of Materials), and click on Start KM-plotter for ovarian cancer.
- Insert TMOD3 in Affy id/ Gene symbol box.
- Choose Auto select best cutoff in Split patients by box.
- Choose contains platin in the chemotherapy option when performing prognosis analysis for platinum-based chemotherapy patients.
- Choose TCGA in Use following dataset(s) for the analysis box.
- Click on Draw Kaplan-Meier plot to get the results (see Supplementary Figure 2).
5. ROC plotter
NOTE: The Receiver Operating Characteristic Curve (ROC) Plotter was used to analyze the expression of TMOD3 in patients resistant or sensitive to platinum-based chemotherapy and allows validation of the interested gene as a predictive marker by ROC curves. Datasets of ROC plotter at the transcriptome level are mainly from the TCGA and GEO databases and contain treatment and response data from 1816 ovarian cancer patients23.
- Go to The ROC Plotter (see Table of Materials), and click on ROC plotter for ovarian cancer.
- Insert TMOD3 in the Gene symbol box.
- Choose Relapse-free survival at 6 months in the Responds box, and choose Platin in the Treatment box.
- Click on Calculate to get the results (see Supplementary Figure 3).
6. mRNA-miRNA analysis
NOTE: The miRNAs targeting TMOD3 were predicted by TargetScan24, and then the correlation of TMOD3 with these miRNAs in the TCGA ovarian cancer dataset was analyzed by cBioportal25. Then, the result above was visualized by Cytoscape26. MiRNA expression in cisplatin-sensitive and drug-resistant ovarian cancer patients was analyzed by LinkedOmics27.
- Go to TargetScan (see Table of Materials), and insert TMOD3 in the Enter a human gene symbol box (see Supplementary Figure 4A).
- Go to cBioportal (see Table of Materials).
- Choose Ovarian Serous Cystadenocarcinoma (TCGA, Nature 2011) dataset and insert TMOD3 and miRNA symbols in the Enter Genes box.
- Click on Submit Query to get the correlation data of TMOD3 with miRNAs in the TCGA ovarian cancer data set (see Supplementary Figure 4B), then visualize the result by Cytoscape (see Table of Materials) (see Supplementary Figure 4C).
- Go to LinkedOmics (see Table of Materials), and select TCGA_OV Sample cohort.
- Choose clinical in the Select Search Dataset box, and select platinum status in the Select Search Dataset Attribute box.
- Choose miRNASeq in the Select Target Dataset box, and choose t-test in Select Statistical Method.
- Click on Submit Query to get the results (see Supplementary Figure 4D).
7. Immuno-infiltration analysis
NOTE: The Human Protein Atlas (HPA) database was used to analyze the distribution of TMOD3 in various immune cells. TIMER is a convenient online database that analyzes immune infiltration associated with multiple cancer types28. This study used TIMER to analyze the relationship between TMOD3 mRNA expression and ovarian cancer purity, and immune cell infiltration. TISIDB is an online portal for tumor-immune system interactions29. This study used TISIDB to determine the correlation between TMOD3 and immunomodulators in ovarian cancer.
- Go to HPA (see Table of Materials), and Insert TMOD3 in the Search box, then get the result.
- Choose Immune to show the distribution of TMOD3 in various immune cells (see Supplementary Figure 5A).
- Go to TIMER (see Table of Materials) and insert TMOD3 in the Gene Symbol box.
- Choose OV in the cancer types box and click on Submit to get the result (see Supplementary Figure 5B).
- Go to TISIDB (see Table of Materials) and insert TMOD3 in the Gene Symbol box.
- Click on Submit to get the result (see Supplementary Figure 5C).
8. TMOD3 coexpression networks in ovarian cancer
NOTE: Genes co-expressed with TMOD3 were analyzed by LinkedOmics, and TOP50 genes were displayed by heat maps. TMOD3 interacting genes were predicted by STRING30. Then, the overlapping genes were displayed by the Venn diagram. The overlapping genes were functionally annotated by DAVID31for Gene Ontology Biological Process (GO-BP), Gene Ontology Cellular Component (GO-CC), Gene Ontology Molecular Function (GO-MF), and Kyoto Encyclopedia of Genes and Genomes (KEGG) pathways.
- Go to LinkedOmics, and select TCGA_OV Sample cohort.
- Choose RNAseq in Select Search Dataset box and Select Target Dataset box.
- Click on Submit Query to get the results of genes co-expressed with TMOD3.
- Go to STRING (see Table of Materials), and insert TMOD3 in the Protein Name box.
- Choose homo sapiens in the Organisms box and click on search to get the result (see Supplementary Figure 6).
- Go to DAVID (see Table of Materials).
- Insert the overlapping genes in the Enter Gene List box and choose ENSEMBL _GENE_SYMBOL in the Select Identifier box.
- Click on Submit List to get the results (see Supplementary Figure 7).
9. CTD database
NOTE: The CTD database is a novel tool to analyze the relationships between chemistry, genes, phenotypes, disease, and the environment32. The CTD database predicts drugs that target TMOD3. The PubChem database is then used to determine the definitive molecular structure of the drug.
- Go to the CTD database (see Table of Materials) and choose Chemical - Gene Interaction Query in the Search menu.
- Insert TMOD3 in the GENE box, and click on search to get the results (see Supplementary Figure 8).
- Go to the PubChem database (see Table of Materials) and insert drugs in the search box to get the results (see Supplementary Figure 9).
Results
TMOD3 expression in ovarian cancer
First, the GEO database showed that the mRNA expression levels of TMOD3 were elevated in microarray datasets GSE51088 and GSE66957 (Figure 1A,B). TMOD3 was also highly expressed in ovarian cancer compared to normal ovarian tissues by the TNMplot web tool (Figure 1C). Analysis of CPTAC data by the UALCAN web tool showed that the protein level of TMOD3 was also significantly higher in ovarian cancer than in normal ovarian tissues (Figure 1D). Besides, the GEO dataset GSE53963 showed that TMOD3 expression was significantly higher in ovarian cancers with grade 4 than in those with grades 2 and 3 (Figure 1E), and the GSE23554 dataset showed that TMOD3 levels were higher in patients with stage 3 ovarian cancer than in those with stages 1 and 2 (Figure 1F). In addition, the GSE131978 dataset showed that TMOD3 expression was also significantly higher in ovarian cancer tissues with metastasis than in those without metastasis (Figure 1G). These results suggest that TMOD3 may influence ovarian cancer progression.
Effects of platinum on TMOD3 expression in ovarian cancer
Chemotherapy is an important factor influencing ovarian cancer progression33. To investigate whether TMOD3 affects ovarian cancer progression by influencing chemotherapy, this study first observed whether TMOD3 expression was altered in ovarian cancer when treated with chemotherapeutic drugs. GSE47856 dataset showed that the expression level of TMOD3 decreased after being treated with cisplatin in the ovarian cancer CH1 cell line (Figure 2A). The GSE49577 dataset showed that TMOD3 mRNA expression was lower in ovarian cancer xenograft mice treated with carboplatin than untreated ones (Figure 2B). In addition, the GSE63885 dataset also showed that TMOD3 expression was significantly reduced after platinum-based chemotherapy in ovarian cancer patients who were highly sensitive to platinum compared to ovarian cancer patients who were not treated with chemotherapy, but there was no difference in ovarian cancer patients who were moderately sensitive to platinum (Figure 2C). The above results suggest that TMOD3 is a possible target of platinum.
TMOD3 expression in platinum-sensitive or resistant ovarian cancer
Based on the above results, this study hypothesized that high expression of TMOD3 in ovarian cancer might affect ovarian cancer progression by regulating platinum resistance. Therefore, this study first examined TMOD3 expression in drug-resistant cell lines or patient cancer tissues by multiple GEO datasets. Both GSE15372 and GSE33482 datasets showed that TMOD3 expression in cisplatin-resistant ovarian cancer cell line a2780 was significantly higher than that in the cisplatin-sensitive group (Figure 3A,B). The GSE45553 dataset showed that TMOD3 expression in cisplatin-resistant ovarian cancer spheroid expression was significantly higher than that of the cisplatin-sensitive group (Figure 3C). Finally, a comprehensive analysis of TCGA and GEO ovarian cancer chemotherapy patients using the ROC plotter revealed that the expression of TMOD3 was significantly higher in ovarian cancer patients with platinum resistance than with platinum-sensitive (Figure 3D). Moreover, the ROC curve showed TMOD3 as a marker for determining platinum resistance in ovarian cancer (Figure 3E). The above results suggest that high expression of TMOD3 may play an essential role in platinum resistance in ovarian cancer.
The effect of TMOD3 expression on ovarian cancer patient survival rate
Prognostic analysis of TCGA ovarian cancer patients by KM-plotter tool revealed that high expression of TMOD3 mRNA was significantly associated with low OS and PFS in total patients or patients with platinum treatment (Figure 4). Interestingly, PFS in patients with platinum treatment was more significant than total patients (Figure 4D). Because PFS is a better indicator of treatment outcomes than OS, the prognostic analysis further demonstrates the critical role of TMOD3 in patients with platinum-based chemotherapy for ovarian cancer.
mRNA-miRNA analysis of TMOD3 in ovarian cancer
Post-transcriptional regulation mediated by microRNAs is an important mechanism affecting gene expression. The function of a gene can be predicted based on the function of microRNAs targeting it34. To explore the possible mechanism of elevated TMOD3 expression in ovarian cancer, twenty-one microRNAs targeting TMOD3 were identified by TargetScan prediction. Their correlation with TMOD3 was also validated in TCGA ovarian cancer samples (Figure 5A). All of them have been shown to mediate tumor chemoresistance, and the majority (17/21) were shown to associate with cisplatin resistance in ovarian cancer35,36,37,38,39,40,41,42,43,44,45,46,47,48, except hsa-miR-301a-3p, hsa-miR -301b-3p, hsa-miR-365a-5p, and hsa-miR-365b-5p. In addition, analysis of the TCGA ovarian cancer samples revealed that both hsa-miR-454-3p and hsa-miR-133a-3p were most significantly negatively correlated with TMOD3 expression (Figure 5A-C). Furthermore, hsa-miR-133a-3p was found to be lowly expressed in cisplatin-resistant ovarian cancers by Linkedomics analysis (Figure 5E), while there was no significance in hsa-miR-454-3p (Figure 5D). Therefore, it is possible that post-transcriptional regulation mediated by microRNAs, especially hsa-miR-133a-3p, is responsible for the high expression of TMOD3 in cisplatin-resistant ovarian cancer.
Relationship between TMOD3 expression and immune infiltration in ovarian cancer
Immunotherapy is a novel and promising therapeutic strategy compared to chemotherapy and surgery. About 50% of ovarian cancer patients have spontaneous multiple immune cell infiltration49,50. Moreover, immunotherapy for ovarian cancer patients with chemoresistance is of interest. For example, the Programmed cell death 1 ligand 1 (PD-L1) inhibitor Durvalumab, in combination with the PARP inhibitor Olaparib, has shown good therapeutic effects in ovarian cancer patients with platinum-resistance51. The HPA dataset showed that TMOD3 was widely distributed in various immune cells (Figure 6A,B), implying TMOD3 plays an important role in the immune cells. Therefore, this study investigated the correlation between TMOD3 and ovarian cancer immune infiltration using TIMER. TMOD3 was negatively correlated with tumor purity (Figure 6C). This suggests that many other cells infiltrate ovarian cancer tissue and that TMOD3 could potentially influence ovarian cancer through these infiltrated cells. Indeed, the results further showed that TMOD3 expression was positively correlated with B lymphocytes, CD8+ T cells, neutrophils, and dendritic cells, but not with CD4+ T cells and macrophages (Figure 6D-I). This study further investigated the relationship between TMOD3 expression and immunomodulators or chemokines in ovarian cancer. It found that TMOD3 expression was significantly correlated with various immunomodulators (Figure 7A), including well-established immune checkpoints such as Programmed Death 1 (PD1), PD-L1 (CD274), and Cytotoxic T-Lymphocyte Antigen 4 (CTLA4) (Figure 7B-D). These results suggest that TMOD3 may play an important role in ovarian cancer immune infiltration.
TMOD3 coexpression networks in ovarian cancer
This study then explored the potential mechanisms of TMOD3 in the involvement of ovarian cancer. First, this study constructed the coexpression network of TMOD3 in ovarian cancer. A total of 4774 genes were significantly associated with TMOD3 in the TCGA ovarian cancer samples revealed by LinkedOmics. The heat map showed the TOP50 genes positively or negatively associated with TMOD3 (Figure 8A,B). Next, this study screened 295 genes interacting with TMOD3 using STRING. After overlapping 4774 genes significantly associated with TMOD3 and 295 genes interacting with TMOD3, 76 genes were screened (Figure 8C). Functional enrichment analysis of these 76 genes showed that actin cytoskeleton and focal adhesion were the most enriched (Figure 8D). KEGG pathway enrichment analysis revealed that proteoglycans in cancer were the most enriched (Figure 8E).
Small molecule therapeutics
Correlations between TMOD3 and potential drugs or small molecules were analyzed using the CTD database. A total of eight drugs were identified to have potential inhibitory effects on TMOD3 (Figure 9A), including acetaminophen, aristolochic acid I, bufalin, doxorubicin, folic acid, haloperidol, T-2 toxin, and Tetrachlorodibenzodioxin (Figure 9B-I). The molecular structures of the identified drugs were determined by the PubChem database. These drugs provide clues to overcoming the process of drug resistance in ovarian cancer mediated by TMOD3 overexpression.
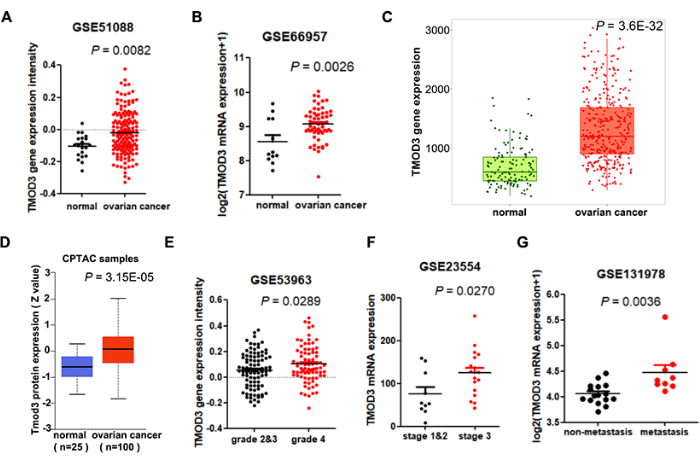
Figure 1: mRNA and protein expression levels of TMOD3 in multiple ovarian cancer datasets. (A) Analysis of mRNA expression of TMOD3 in normal ovarian tissues (n = 20) and ovarian cancer (n = 152) by GSE51088 dataset. (B) Analysis of mRNA expression of TMOD3 in normal ovarian tissues (n = 12) and ovarian cancer (n = 57) by GSE66957 dataset. (C) Analysis of mRNA expression of TMOD3 in normal ovarian tissue (n = 133) and ovarian cancer (n = 374) by TNM plotter tool. (D) Analysis of protein expression of TMOD3 in normal ovarian tissue (n = 25) and ovarian cancer (n = 100) in CPTAC data by UALCAN tool. (E) Analysis of mRNA expression of TMOD3 in ovarian cancer of grade 2 and 3 (n = 94) and ovarian cancer of grade 4 (n = 80) by GSE53963 dataset. (F) Analysis of TMOD3 mRNA expression in ovarian cancer of stage 1 and 2 (n = 10) and ovarian cancer of stage 3 (n = 18) by GSE23554 dataset. Enter text here. (G) Analysis of TMOD3 mRNA expression in ovarian cancer with or without metastasis by the GSE131978 dataset. Data are represented as mean ± SEM. Please click here to view a larger version of this figure.
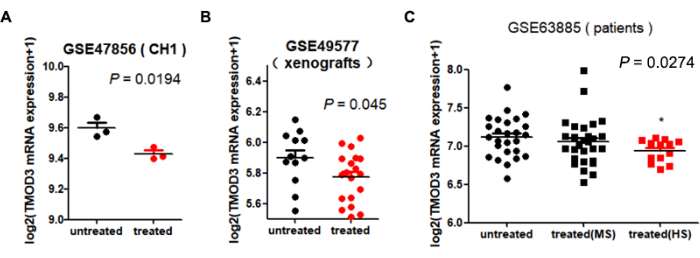
Figure 2: TMOD3 mRNA expression levels in ovarian cancer cell lines, transplanted tumors, and patients after platinum drug treatment. (A) Analysis of TMOD3 mRNA expression in cisplatin-treated (n = 3) and untreated CH1 (n = 3) ovarian cancer cell lines by the GSE47856 dataset. (B) Analysis of TMOD3 mRNA expression in cisplatin-treated (n = 12) and untreated TMOD3 mRNA expression in CH1 (n = 19) ovarian cancer transplants. (C) Analysis of TMOD3 mRNA expression in cisplatin-treated ovarian cancer patients with highly sensitive (HS, n = 13) and moderately sensitive to cisplatin (n = 28), as well as in patients without cisplatin treatment (n = 26). Data are represented as mean ± SEM. *compared with untreated, P < 0.05. Please click here to view a larger version of this figure.
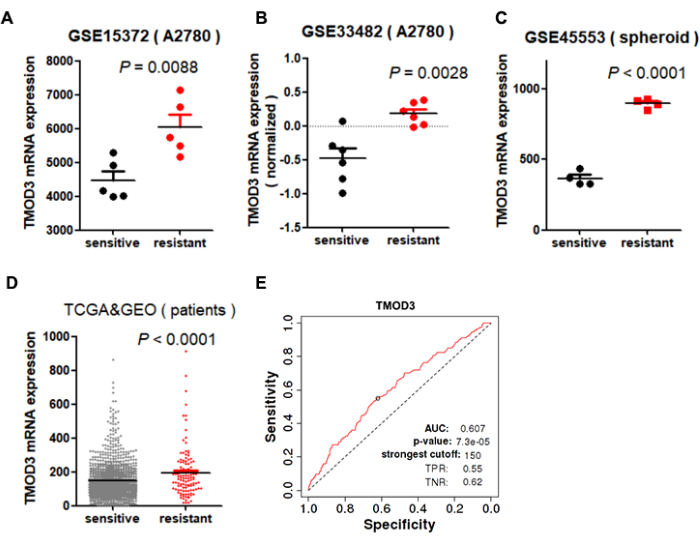
Figure 3: TMOD3 mRNA expression levels in platinum-sensitive and platinum-resistant ovarian cancer cell lines or patients. (A,B) TMOD3 mRNA expression levels in cisplatin-sensitive and cisplatin-resistant A2780 cell lines were analyzed by the GSE15372 dataset (A) and GSE33482 dataset (B). (C) TMOD3 mRNA expression levels in cisplatin-sensitive and cisplatin-resistant ovarian cancer spheroid were analyzed by the GSE45553 dataset. (D,E) TMOD3 mRNA expression levels in platinum-sensitive and platinum-resistant ovarian cancer patients were analyzed by the ROC plotter tool (D), and TMOD3 was identified as a marker for determining platinum resistance by ROC curves (E). Data are represented as mean ± SEM. Please click here to view a larger version of this figure.
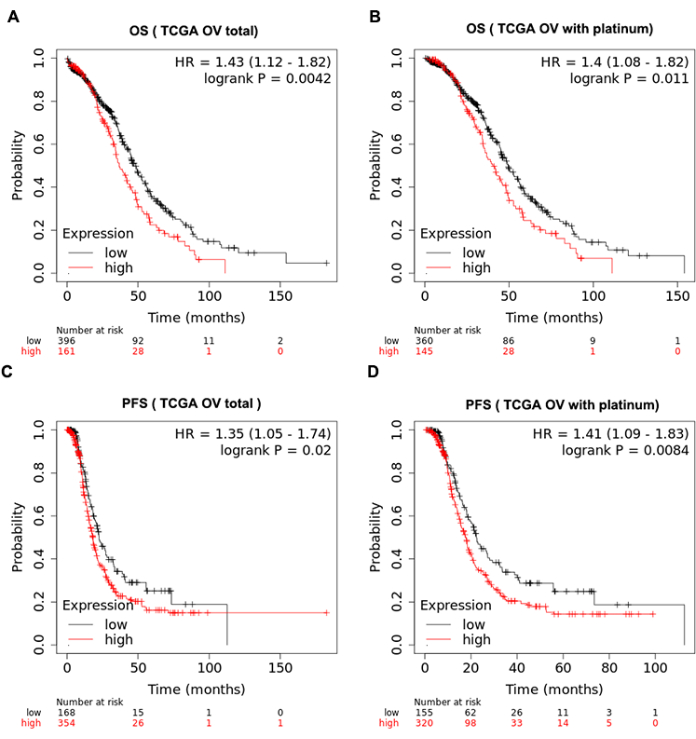
Figure 4: Correlation analysis of TMOD3 mRNA expression levels with OS and PFS of ovarian cancer patients. (A,B) Correlation analysis of TMOD3 mRNA expression levels with OS in all TCGA ovarian cancer patients (A) or patients receiving platinum-based chemotherapy (B). (C,D) Correlation analysis of TMOD3 mRNA expression levels with PFS in all TCGA ovarian cancer patients (C) or patients receiving platinum-based chemotherapy (D). Please click here to view a larger version of this figure.
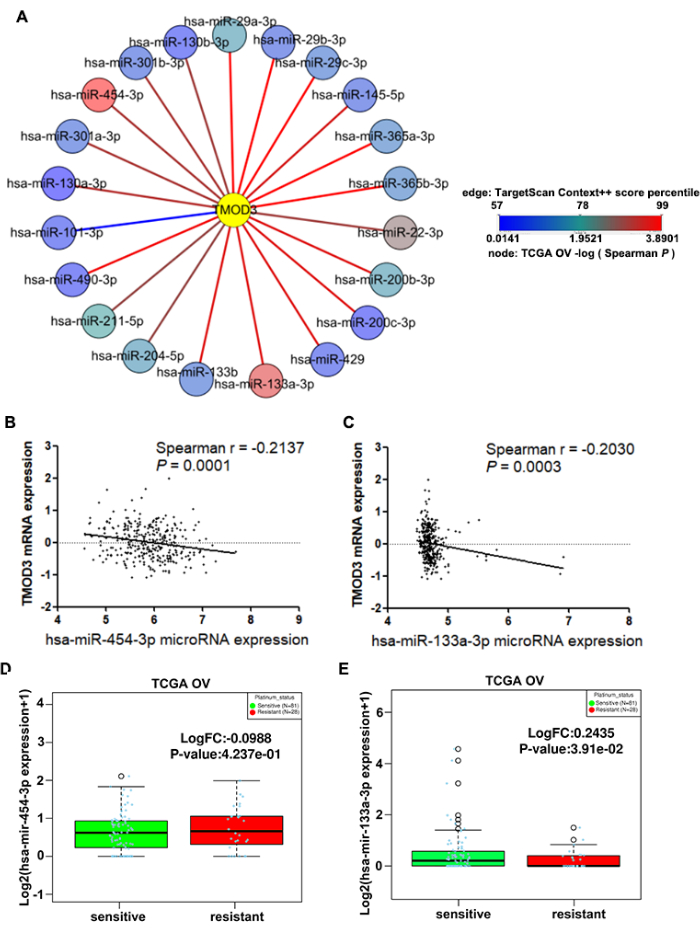
Figure 5: Determination of relationships between TMOD3 and drug resistance by mRNA-microRNA interaction analysis. (A) Prediction of miRNAs targeting TMOD3. Line color represents the TargetScan Context++ score percentile, and node color represents the correlation strength between this miRNA and TMOD3 in the TCGA ovarian cancer dataset. (B,C) Correlation between TMOD3 mRNA expression levels and hsa-miR454-3p (B) and hsa-miR133a-3p (C) in TCGA ovarian cancer samples. (D,E) Expression of hsa-miR454-3p (D) and hsa-miR133a-3p (E) in cisplatin sensitive and resistant ovarian cancer in TCGA ovarian cancer samples. Data are represented as mean ± SEM. Please click here to view a larger version of this figure.
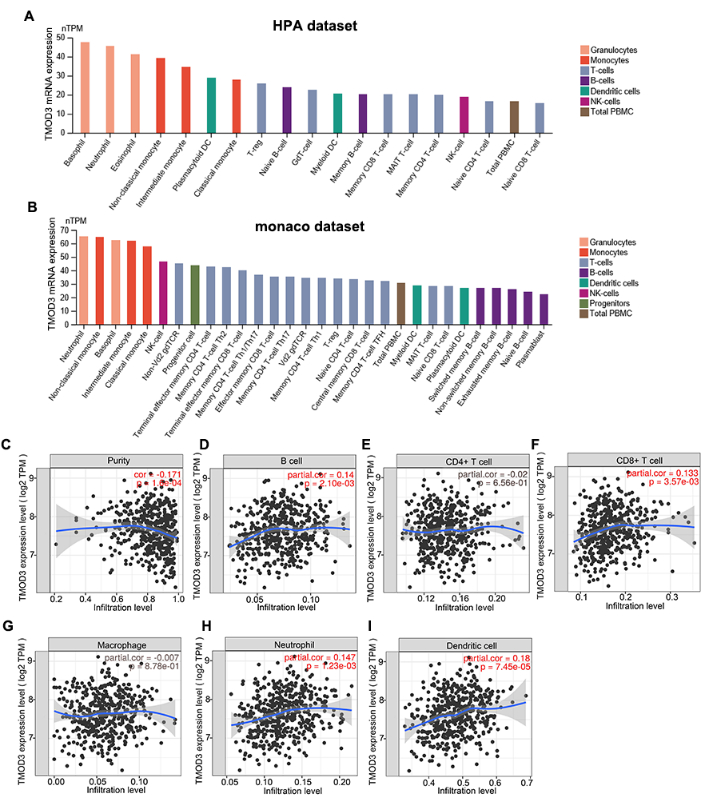
Figure 6: Correlation of TMOD3 mRNA expression levels with immune cell infiltration in ovarian cancer. (A,B) TMOD3 mRNA expression levels of immune cells in HPA dataset (A) and Monaco dataset (B). (C-I) Correlation of TMOD3 mRNA expression levels with tumor purity in TCGA ovarian cancer (C), B lymphocytes (D), CD4+ T cells (E), CD8+ T cells (F), macrophages (G), neutrophils (H), and dendritic cell (I) infiltration. Please click here to view a larger version of this figure.
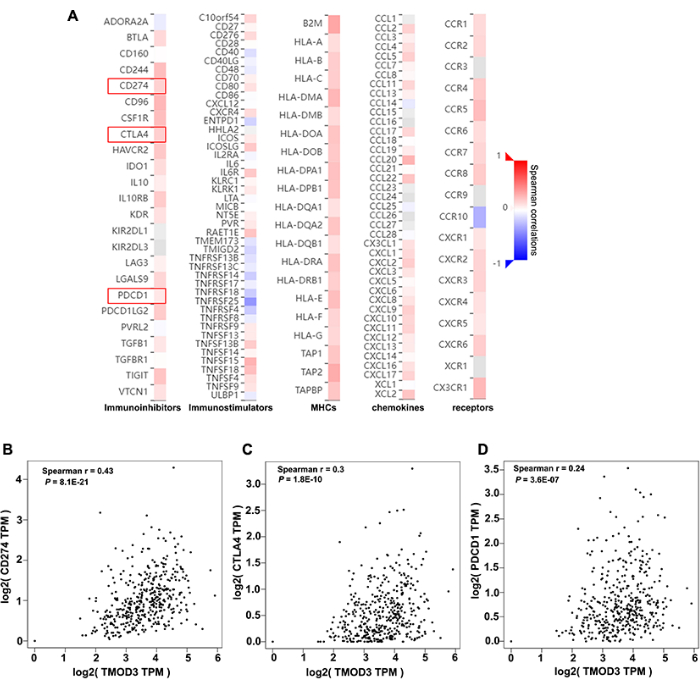
Figure 7: Correlation analysis of TMOD3 mRNA expression levels with immunoregulatory factors in ovarian cancer patients. (A) The heat map of correlation between TMOD3 mRNA expression and immunoregulators in TCGA ovarian cancer, including immune inhibitors, immunostimulators, MHCs, chemokines, and receptors. (B-D) Correlation analysis of TMOD3 mRNA expression levels with immune checkpoints such as PD1 (B), PD-L1 (CD274) (C), and CTLA4 (D) in TCGA ovarian cancer samples. Please click here to view a larger version of this figure.
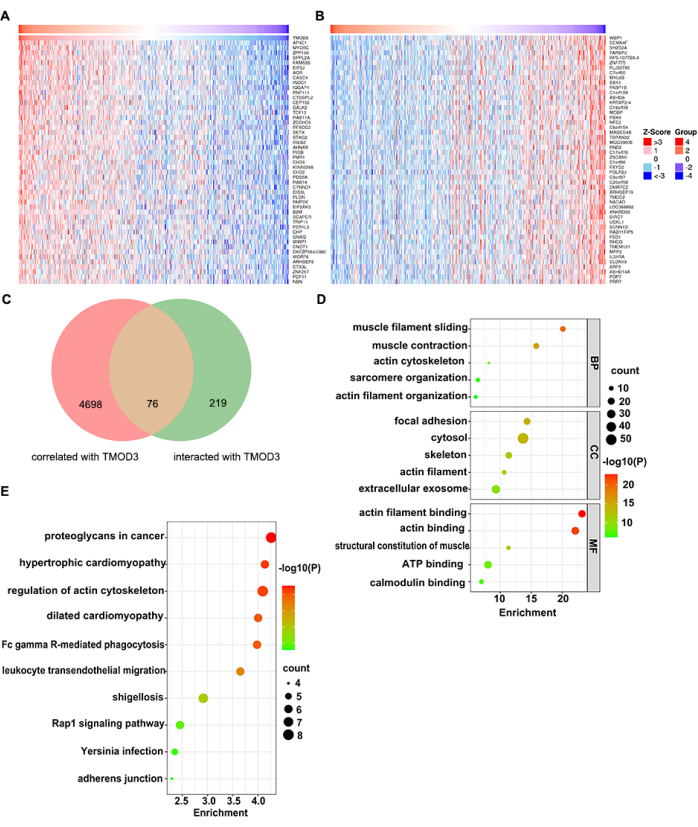
Figure 8: TMOD3 coexpression networks in ovarian cancer. (A,B) Heat maps showing the top 50 genes positively (A) and negatively (B) correlated with TMOD3 in TCGA ovarian cancer datasets using LinkedOmics. Red and blue represent positively and negatively correlated genes, respectively. (C) Venn diagram of 295 genes interacted with TMOD3, and the 4774 genes correlated with TMOD3 in TCGA ovarian cancer. (D) Functional enrichment analysis of 76 overlapping genes. The bubble plot demonstrated the top 5 elements significantly enriched in BP, CC, and MF. (E) The TOP10 pathways of KEGG pathway enrichment analysis. Please click here to view a larger version of this figure.
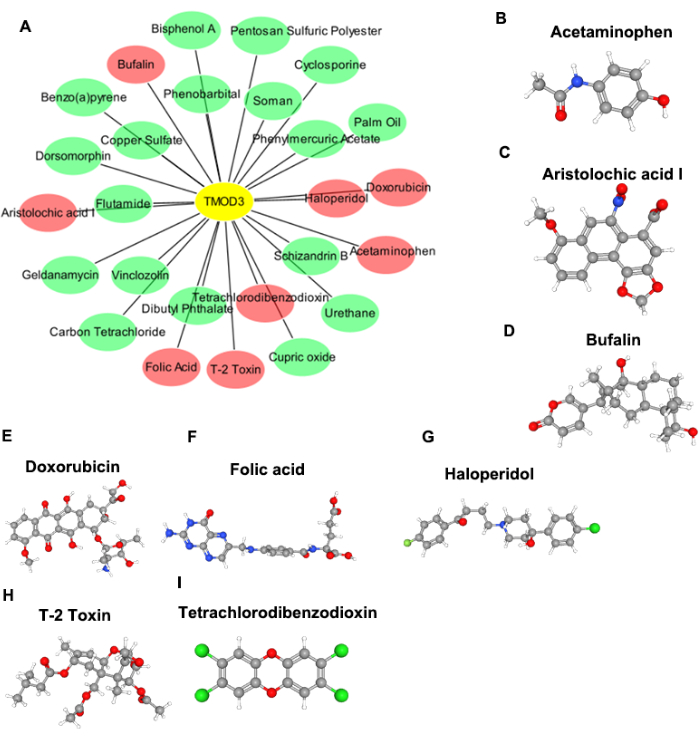
Figure 9: Prediction of potential drugs or small Molecules targeting TMOD3. (A) Prediction of potential drugs that target TMOD3 using CTD database, with red representing drug could inhibit TMOD3. (B-H) PubChem database reveals the molecular structures of eight targeted drugs. (B) Acetaminophen, (C) aristolochic acid I, (D) bufalin, (E) Doxorubicin, (F) Folic Acid, (G) Haloperidol, (H) T-2 Toxin. (I) Tetrachlorodibenzodioxin. Please click here to view a larger version of this figure.
Supplementary Figure 1: Methods for analyzing mRNA and protein expression levels of TMOD3 in multiple ovarian cancer datasets. (A) Analysis of TMOD3 expression using the GEO database. (B) Further analysis of data extracted from the GEO database using statistics and graphing software. (C) Analysis of TMOD3 expression using the TNMplot. (D) Analysis of protein expression using the UALCAN. Please click here to download this File.
Supplementary Figure 2: Prognostic analysis using KM-plotter. Please click here to download this File.
Supplementary Figure 3: ROC curves analysis using ROC plotter. Please click here to download this File.
Supplementary Figure 4: Methods for mRNA-miRNA analysis. (A) Prediction of miRNAs target TMOD3 using TargetScan. (B) Correlation analysis of TMOD3 with miRNAs using cBioportal. (C) Visualization of correlation analysis using Cytoscape. (D) Analysis of miRNAs expression using LinkedOmics. Please click here to download this File.
Supplementary Figure 5: Methods for immuno-infiltration analysis. (A) Analysis of TMOD3 distribution in various immune cells. (B) Correlation analysis of TMOD3 with immune infiltration using cBioportal. (C) Correlation analysis of TMOD3 with immunomodulators using TISIDB. Please click here to download this File.
Supplementary Figure 6: Prediction of genes interacted with TMOD3 using STRING. Please click here to download this File.
Supplementary Figure 7: Functional annotation using DAVID. Please click here to download this File.
Supplementary Figure 8: Prediction of drugs target TMOD3 using CTD database. Please click here to download this File.
Supplementary Figure 9: Analysis of the molecular structure of the drugs using PubChem database. Please click here to download this File.
Discussion
The cytoskeleton has been considered essential in the development and progression, treatment, and prognosis of various tumors52. Compared with TMOD1, which is restricted to erythrocytes and the cardiovascular system53, and TMOD2, which is restricted to the nervous system54, TMOD3 has a ubiquitous distribution, which makes the study of TMOD3 in systemic tumors more popular14,15,16,17,18,19. Nevertheless, there are still no studies on TMOD3 in ovarian cancer. This research uncovered the high expression of TMOD3 in ovarian cancer and further analyzed its role in platinum resistance and tumor immune infiltration in ovarian cancer.
The GEO is the world's leading fully publicly available gene expression database. By integrating the GEO and TCGA databases, this study demonstrated that TMOD3 was overexpressed in ovarian cancer from multiple independent datasets at both mRNA and protein levels. Abnormal gene expression is an important mechanism for tumor development55, and this study did further find that TMOD3 was significantly associated with metastasis, grades, stages, and prognosis of ovarian cancer. Therefore, TMOD3 plays a vital role in ovarian cancer.
Previous studies reported that cytoskeleton-related genes were usually aberrantly expressed in cisplatin-triggered apoptosis, and the actin cytoskeleton was significantly modified7. Indeed, as a protein capping the slow-growing (pointed) ends of actin filaments, TMOD3 was altered after cisplatin and carboplatin treatment, and GO-term analysis and KEGG analysis also demonstrated that actin cytoskeleton might be a potential mechanism for TMOD3 to affect the process in ovarian cancer. However, the cytoskeleton is a complex biological process, and this study only demonstrated that TMOD3 expression was affected by platinum drugs. Whether TMOD3 is a direct target of platinum drugs and whether other chemotherapeutic drugs also alter TMOD3 expression must be further proven by molecular biological experiments. In this study, TMOD3 expression in patients with moderate sensitivity to platinum was not significantly changed after platinum-based chemotherapy, while TMOD3 decreased significantly in highly sensitive patients. Based on the high expression of TMOD3 in ovarian cancer, it is reasonable to speculate that TMOD3 is associated with platinum resistance in ovarian cancer. Using in vitro experimental datasets and patient datasets, this study also found that TMOD3 expression was significantly higher in platinum-resistant ovarian cancer cell lines or patients than in platinum-sensitive ones. Late diagnosis of the disease and disease recurrence due to chemoresistance contributed to a high mortality rate in ovarian cancer1,2. It has been reported that anti-TMOD3b-autoAb in serum was shown to have a sensitivity of ≥80% in the diagnosis of rAFS stage I to II endometriosis and ultrasound-negative endometriosis56. This study showed TMOD3 as a valuable marker for determining platinum resistance. However, further clinical analysis is needed to determine whether TMOD3 is a valuable biomarker in all cases where platinum resistance appears at different times or at different levels.
MicroRNA-mediated post-transcriptional regulation is an important mechanism for the aberrant expression of chemoresistance-associated genes34. In this study, the mRNA-miRNA analysis revealed a possible reason for the high expression of TMOD3 in ovarian cancer and platinum-resistant ovarian cancer. It has been shown that miR-133a increased the sensitivity of breast cancer to doxorubicin by downregulating the expression of UCP-257 and increased the sensitivity of human laryngeal cancer cell line by downregulating the expression of ATP7B58. In this study, miR-133a was also found to target TMOD3 and was significantly negatively correlated with TMOD3 in the TCGA ovarian cancer samples. miR-133a expression in cisplatin-sensitive ovarian cancer patients was also higher than that of cisplatin-resistant ones. This implies that miR-133a could mediate cisplatin resistance in ovarian cancer by influencing TMOD3 expression through post-transcriptional regulation. microRNA is considered to be a valuable factor in tumor diagnosis for several reasons. First, it is feasible to detect miRNAs in body fluids such as blood, urine, colostrum, and pleural fluid. Second, circulating miRNAs are very stable in body fluids and are not affected by endogenous RNases. Third, circulating miRNAs carry pathological signals from various tumor sites or metastatic locations, thus overcoming the issue of tumor heterogeneity59. For example, immunohistochemistry combined with plasma miR-133a can significantly improve the specificity and sensitivity of early diagnosis of colorectal cancer60. Therefore, the diagnostic application of miR133a in platinum resistance of ovarian cancer deserves further study.
Studies on the role of TMOD3 in immune cells are limited. Correlation analysis between TMOD3 expression and immune cell infiltration in ovarian cancer has not been previously conducted. In this study, we found that TMOD3 was positively correlated with the number of infiltrating immune cells, such as CD8+ T cells and dendritic cells, in tumor tissues. Previous reports from our group have demonstrated that TMOD1 promotes the maturation and immune function of dendritic cells61, suggesting that TMOD3 may play a similar role in ovarian cancer. In addition, TMOD3 expression was also positively correlated with PD-L1, PDCD1, and CTLA4 expression in this study. Therefore, although TMOD3 is involved in the recruitment of immune cells into tumor tissue, it may also lead to increased expression of PD-L1, PDCD1, and CTLA4 on the surface of tumor cells, indicating that high expression of this gene still has a suppressive effect on tumor immune responses. It is necessary to investigate its mechanism further and explore the feasibility of implementing immunotherapy in chemoresistant ovarian cancer by interfering with the expression of TMOD3.
To further explore the possibility of TMOD3 as a potential therapeutic target in chemoresistant ovarian cancer, this study analyzed the interaction between TMOD3 and existing drugs and found several drugs could reduce the expression of TMOD3. However, further experimental support, including preclinical and prospective clinical studies, is needed to determine whether patients with TMOD3-overexpressing drug-resistant ovarian cancer can benefit from TMOD3 inhibition or whether TMOD3 is a promising therapeutic target.
The present study has several limitations. First, the expression and prognostic significance of TMOD3 were investigated through online public databases, and subsequent analyses are needed to validate these results further in cellular and animal experiments. Second, in vitro and in vivo experiments must be designed to elucidate the detailed mechanisms by which TMOD3 mediates platinum resistance in ovarian cancer. Third, it may be better to investigate the role of TMOD3 in combination with single-cell sequencing to avoid cancer cell heterogeneity.
In summary, these results found that TMOD3 expression is upregulated in drug-resistant ovarian cancer for the first time. This study also preliminarily explored its potential mechanisms and its potential as a therapeutic target.
Disclosures
The authors report no conflict of interest.
Acknowledgements
This work was supported by grants from the National Natural Science Foundation of China (No. 32171143, 31771280) and grants from the Natural Science Foundation of Jiangsu Provincial Department of Education (No. 18KJD360003, 21KJD320004).
Materials
| Name | Company | Catalog Number | Comments |
|---|---|---|---|
| cBioportal | Memorial Sloan Kettering Cancer Center | Correlation analysis of TMOD3 with targeted miRNAs (https://www.cbioportal.org) | |
| CTD database | North Carolina State University | To analyze the relationships between chemistry, genes, phenotype, disease, and environment (https://ctdbase.org/) | |
| Cytoscape | National Institute of General Medical Sciences of the National Institutes of Health | Network Data Integration, Analysis, and Visualization (www.cytoscape.org/) | |
| DAVID | Frederick National Laboratory for Cancer Research | A comprehensive set of functional annotation tools for investigators to understand the biological meaning behind large lists of genes(https://david.ncifcrf.gov/) | |
| GEO | NCBI | Gene expression analysis (https://www.ncbi.nlm.nih.gov/geo/ ) | |
| HPA | Knut & Alice Wallenberg foundation | The Human Protein Atlas (HPA) database helped analyze the distribution of TMOD3 in various immune cells (https://www.proteinatlas.org/) | |
| KM-plotter | Department of Bioinformatics of the Semmelweis University | Prognostic Analysis (https://kmplot.com/analysis/) | |
| LinkedOmics | Baylor College of Medicine | A platform for biologists and clinicians to access, analyze and compare cancer multi-omics data within and across tumor types (http://www.linkedomics.org/) | |
| PubChem database | U.S. National Library of Medicine | To determine the definitive molecular structure of the drug | |
| ROC Plotter | Department of Bioinformatics of the Semmelweis University | Validation of the interest gene as a predictive marker (http://www.rocplot.org/) | |
| STRING | Swiss Institute of Bioinformatics | Coexpression networks analysis(https://string-db.org) | |
| TargetScan | Whitehead Institute for Biomedical Research | Prediction of miRNA targets (www.targetscan.org/) | |
| TIMER | Harvard University | Systematical analysis of immune infiltrates across diverse cancer types (https://cistrome.shinyapps.io/timer/) | |
| TISIDB | The University of Hong Kong | A web portal for tumor and immune system interaction(http://cis.hku.hk/TISIDB/) | |
| TNMplot | Department of Bioinformatics of the Semmelweis University | Gene expression analysis (https://www.tnmplot.com/ ) | |
| UALCAN | The University of ALabama at Birmingham | Gene expression analysis (http://ualcan.path.uab.edu) |
References
- Gaona-Luviano, P., Medina-Gaona, L. A., Magaña-Pérez, K. Epidemiology of ovarian cancer. Chin Clin Oncol. 9 (4), 47(2020).
- Ahmed, N., et al. Ovarian cancer, cancer stem cells and current treatment strategies: A potential role of magmas in the current treatment methods. Cells. 9 (3), 719(2020).
- Song, M., Cui, M., Liu, K. Therapeutic strategies to overcome cisplatin resistance in ovarian cancer. Eur J Med Chem. 232, 114205(2022).
- Binju, M., et al. Mechanisms underlying acquired platinum resistance in high grade serous ovarian cancer - A mini review. Biochim Biophys Acta Gen Subj. 1863 (2), 371-378 (2019).
- El Bairi, K., Singh, S., Le Page, C. Revisiting platinum-resistant ovarian cancer: Advances in therapy, molecular biomarkers, and clinical outcomes. Semin Cancer Biol. 77, 1-2 (2021).
- Freimund, A. E., Beach, J. A., Christie, E. L., Bowtell, D. D. L. Mechanisms of drug resistance in high-grade serous ovarian cancer. Hematol Oncol Clin North Am. 32 (6), 983-996 (2018).
- Shimizu, T., Fujii, T., Sakai, H. The relationship between actin cytoskeleton and membrane transporters in cisplatin resistance of cancer cells. Front Cell Dev Biol. 8, 597835(2020).
- Sharma, S., et al. Correlative nanomechanical profiling with super-resolution f-actin imaging reveals novel insights into mechanisms of cisplatin resistance in ovarian cancer cells. Nanomedicine. 8 (5), 757-766 (2012).
- Sharma, S., Santiskulvong, C., Rao, J., Gimzewski, J. K., Dorigo, O. The role of rho GTPase in cell stiffness and cisplatin resistance in ovarian cancer cells. Integr Biol (Camb). 6 (6), 611-617 (2014).
- Rabelo-Fernández, R. J., et al. Reduced RBPMS levels promote cell proliferation and decrease cisplatin sensitivity in ovarian cancer cells. Int J Mol Sci. 23 (1), 535(2022).
- Seo, Y. H., Jo, Y. N., Oh, Y. J., Park, S. Nano-mechanical reinforcement in drug-resistant ovarian cancer cells. Biol Pharm Bull. 38 (3), 389-395 (2015).
- Parreno, J., Fowler, V. M. Multifunctional roles of tropomodulin-3 in regulating actin dynamics. Biophys Rev. 10 (6), 1605-1615 (2018).
- Sui, Z., et al. Regulation of actin polymerization by tropomodulin-3 controls megakaryocyte actin organization and platelet biogenesis. Blood. 126 (4), 520-530 (2015).
- Jin, C., Chen, Z., Shi, W., Lian, Q. Tropomodulin 3 promotes liver cancer progression by activating the MAPK/ERK signaling pathway. Oncol Rep. 41 (5), 3060-3068 (2019).
- Zheng, H., et al. Tropomodulin 3 modulates EGFR-PI3K-AKT signaling to drive hepatocellular carcinoma metastasis. Mol Carcinog. 58 (10), 1897-1907 (2019).
- Wang, H., Yang, G., Yu, Y., Gu, P. Microrna-490-3p suppresses the proliferation and invasion of hepatocellular carcinoma cells via targeting tmod3. Oncol Lett. 20 (4), 95(2020).
- Li, H., et al. Mir-145 modulates the radiosensitivity of non-small cell lung cancer cells by suppression of TMOD3. Carcinogenesis. 43 (3), 288-296 (2021).
- Zhan, X. H., et al. Loxl2 upregulates phosphorylation of ezrin to promote cytoskeletal reorganization and tumor cell invasion. Cancer Res. 79 (19), 4951-4964 (2019).
- Paul, D., et al. Global proteomic profiling identifies etoposide chemoresistance markers in non-small cell lung carcinoma. J Proteomics. 138, 95-105 (2016).
- Bartha, Á, Győrffy, B. TNMplot.Com: A web tool for the comparison of gene expression in normal, tumor and metastatic tissues. Int J Mol Sci. 22 (5), 2622(2021).
- Chandrashekar, D. S., et al. UALCAN: A portal for facilitating tumor subgroup gene expression and survival analyses. Neoplasia. 19 (8), 649-658 (2017).
- Gyorffy, B., Lánczky, A., Szállási, Z. Implementing an online tool for genome-wide validation of survival-associated biomarkers in ovarian cancer using microarray data from 1287 patients. Endocr Relat Cancer. 19 (2), 197-208 (2012).
- Fekete, J. T., et al. Predictive biomarkers of platinum and taxane resistance using the transcriptomic data of 1816 ovarian cancer patients. Gynecol Oncol. 156 (3), 654-661 (2020).
- Mcgeary, S. E., et al. The biochemical basis of microRNA targeting efficacy. Science. 366, 6472(2019).
- Gao, J., et al. Integrative analysis of complex cancer genomics and clinical profiles using the cBioPortal. Sci Signal. 6 (269), pl1(2013).
- Shannon, P., et al. Cytoscape: A software environment for integrated models of biomolecular interaction networks. Genome Res. 13 (11), 2498-2504 (2003).
- Vasaikar, S. V., Straub, P., Wang, J., Zhang, B. Linkedomics: Analyzing multi-omics data within and across 32 cancer types. Nucleic Acids Res. 46 (D1), D956-D963 (2018).
- Li, T., et al. Timer: A web server for comprehensive analysis of tumor-infiltrating immune cells. Cancer Res. 77 (21), e108-e110 (2017).
- Ru, B., et al. TISIDB: An integrated repository portal for tumor-immune system interactions. Bioinformatics. 35 (20), 4200-4202 (2019).
- Szklarczyk, D., et al. String v11: Protein-protein association networks with increased coverage, supporting functional discovery in genome-wide experimental datasets. Nucleic Acids Res. 47 (D1), D607-D613 (2019).
- Sherman, B. T., et al. A web server for functional enrichment analysis and functional annotation of gene lists (2021 update). Nucleic Acids Res. 50 (W1), W216-W221 (2022).
- Grondin, C. J., et al. Predicting molecular mechanisms, pathways, and health outcomes induced by Juul e-cigarette aerosol chemicals using the comparative toxicogenomics database. Curr Res Toxicol. 2, 272-281 (2021).
- Wang, X., et al. Hif-1α is a rational target for future ovarian cancer therapies. Front Oncol. 11, 785111(2021).
- Liu, X., et al. Downregulation of nek11 is associated with drug resistance in ovarian cancer. Int J Oncol. 45 (3), 1266-1274 (2014).
- Tang, J., et al. Inhibition of lc3b can increase the chemosensitivity of ovarian cancer cells. Cancer Cell Int. 19, 199(2019).
- Wang, T., et al. Mir-211 facilitates platinum chemosensitivity by blocking the DNA damage response (DDR) in ovarian cancer. Cell Death Dis. 10 (7), 495(2019).
- Tian, J., Xu, Y. Y., Li, L., Hao, Q. Mir-490-3p sensitizes ovarian cancer cells to cisplatin by directly targeting abcc2. Am J Transl Res. 9 (3), 1127-1138 (2017).
- Liu, L., et al. Mir-101 regulates expression of ezh2 and contributes to progression of and cisplatin resistance in epithelial ovarian cancer. Tumour Biol. 35 (12), 12619-12626 (2014).
- Li, Z., et al. Exosomes secreted by chemoresistant ovarian cancer cells promote angiogenesis. J Ovarian Res. 14 (1), 7(2021).
- Xue, B., Li, S., Jin, X., Liu, L. Bioinformatics analysis of mrna and miRNA microarray to identify the key miRNA-mRNA pairs in cisplatin-resistant ovarian cancer. BMC Cancer. 21 (1), 452(2021).
- Zong, C., Wang, J., Shi, T. M. Microrna 130b enhances drug resistance in human ovarian cancer cells. Tumour Biol. 35 (12), 12151-12156 (2014).
- Yu, P. N., et al. Downregulation of mir-29 contributes to cisplatin resistance of ovarian cancer cells. Int J Cancer. 134 (3), 542-551 (2014).
- Sheng, Q., et al. Cisplatin-mediated down-regulation of mir-145 contributes to up-regulation of pd-l1 via the c-myc transcription factor in cisplatin-resistant ovarian carcinoma cells. Clin Exp Immunol. 200 (1), 45-52 (2020).
- Luo, Y., Gui, R. Circulating exosomal circfoxp1 confers cisplatin resistance in epithelial ovarian cancer cells. J Gynecol Oncol. 31 (5), e75(2020).
- Liu, J., et al. Mir-200b and mir-200c co-contribute to the cisplatin sensitivity of ovarian cancer cells by targeting DNA methyltransferases. Oncol Lett. 17 (2), 1453-1460 (2019).
- Li, T., et al. Exosomal transfer of mir-429 confers chemoresistance in epithelial ovarian cancer. Am J Cancer Res. 11 (5), 2124-2141 (2021).
- Chen, S., Jiao, J. W., Sun, K. X., Zong, Z. H., Zhao, Y. Microrna-133b targets glutathione s-transferase π expression to increase ovarian cancer cell sensitivity to chemotherapy drugs. Drug Des Devel Ther. 9, 5225-5235 (2015).
- Zhou, Y., et al. Mir-133a targets yes1 to reduce cisplatin resistance in ovarian cancer by regulating cell autophagy. Cancer Cell Int. 22 (1), 15(2022).
- Marth, C., Wieser, V., Tsibulak, I., Zeimet, A. G. Immunotherapy in ovarian cancer: Fake news or the real deal. Int J Gynecol Cancer. 29 (1), 201-211 (2019).
- Wu, A., et al. Integrated analysis of prognostic and immune-associated integrin family in ovarian cancer. Front Genet. 11, 705(2020).
- Lampert, E. J., et al. Combination of PARP inhibitor Olaparib, and PD-l1 inhibitor Durvalumab, in recurrent ovarian cancer: A proof-of-concept phase II study. Clin Cancer Res. 26 (16), 4268-4279 (2020).
- Fife, C. M., Mccarroll, J. A., Kavallaris, M. Movers and shakers: Cell cytoskeleton in cancer metastasis. Br J Pharmacol. 171 (24), 5507-5523 (2014).
- Yao, W., Chu, X., Sung, L. A. Cell type-restricted expression of erythrocyte tropomodulin isoform41 in exon 1 knockout/lacz knock-in heterozygous mice. Gene Expr Patterns. 17 (1), 45-55 (2015).
- Omotade, O. F., et al. Tropomodulin isoform-specific regulation of dendrite development and synapse formation. J Neurosci. 38 (48), 10271-10285 (2018).
- Zhang, Q., Zhong, C., Duan, S. The tumorigenic function of linc00858 in cancer. Biomed Pharmacother. 143, 112235(2021).
- Greenbaum, H., Galper, B. L., Decter, D. H., Eisenberg, V. H. Endometriosis and autoimmunity: Can autoantibodies be used as a non-invasive early diagnostic tool. Autoimmun Rev. 20 (5), 102795(2021).
- Yuan, Y., Yao, Y. F., Hu, S. N., Gao, J., Zhang, L. L. Mir-133a is functionally involved in doxorubicin-resistance in breast cancer cells mcf-7 via its regulation of the expression of uncoupling protein 2. PLoS One. 10 (6), e0129843(2015).
- Wang, X., Zhu, W., Zhao, X., Wang, P. Mir-133a enhances the sensitivity of hep-2 cells and vincristine-resistant hep-2v cells to cisplatin by downregulating atp7b expression. Int J Mol Med. 37 (6), 1636-1642 (2016).
- Han, Y., Li, H. MiRNAs as biomarkers and for the early detection of non-small cell lung cancer (SCLC). J Thorac Dis. 10 (5), 3119-3131 (2018).
- Luo, X., Wu, Y., Ji, M., Zhang, S. Combined plasma microRNA and fecal occult blood tests in early detection of colorectal cancer. Clin Lab. 65 (5), (2019).
- Liu, X., et al. Tropomodulin1 expression increases upon maturation in dendritic cells and promotes their maturation and immune functions. Front Immunol. 11, 587441(2020).
Reprints and Permissions
Request permission to reuse the text or figures of this JoVE article
Request Permission