Here, we present a protocol to induce H-type hypertension and evaluate the antihypertensive effects of Huotan Jiedu Tongluo decoction (HTJDTLD) administered intragastrically. In rats with H-type hypertension, HTJDTLD had effective antihypertensive effects, possibly associated with inhibition of endoplasmic reticulum (ER) stress-induced apoptosis pathway activation.
Method Article
The Antihypertensive Effects and Mechanisms of Huotan Jiedu Tongluo Decoction in Rats with H-Type Hypertension
In This Article
Summary
Abstract
H-type hypertension, which is a specific form of hypertension characterized by elevated plasma homocysteine (Hcy) levels, has become a major public health challenge worldwide. This study investigated the hypotensive effects and underlying mechanisms of Huotan Jiedu Tongluo decoction (HTJDTLD), a highly effective traditional Chinese medicine formula commonly used to treat vascular stenosis. Methionine was used to induce H-type hypertension in rats, and HTJDTLD was administered intragastrically. Then, the systolic and diastolic blood pressures of the caudal artery of rats were measured by noninvasive rat caudal manometry. Histological assessment of the aorta was performed by hematoxylin-eosin (HE) staining. Enzyme-linked immunosorbent assay (ELISA) was used to measure Hcy levels, and quantitative reverse transcriptase polymerase chain reaction (qRT-PCR) and western blotting were used to determine the mRNA and protein levels of Glucose regulatory protein 78 (GRP78), Tumor necrosis factor (TNF) receptor-associated factor 2 (TRAF2), c-Jun N-terminal kinases (JNK), and caspase-3. The results showed that HTJDTLD significantly lowered blood pressure, alleviated histopathological lesions, and decreased Hcy levels after methionine treatment. Moreover, HTJDTLD significantly inhibited the gene and protein expression of GRP78, JNK, TRAF2, and caspase 3, which are involved mainly in the endoplasmic reticulum (ER) stress-induced apoptosis pathway. Overall, the results indicated that HTJDTLD had effective antihypertensive effects in rats with H-type hypertension and revealed the antihypertensive mechanisms associated with inhibition of ER stress-induced apoptosis pathway activation.
Introduction
Hypertension, a major risk factor for heart attack, stroke, and renal failure, has become a significant public health challenge that affects 1 billion people worldwide1. Homocysteine (Hcy), a thiol group-containing amino acid, is a vital metabolic intermediary of methionine metabolism. Hypertension with elevated plasma Hcy levels is defined as H-type hypertension, which could be a significant risk factor for the occurrence and recurrence of cardiocerebrovascular diseases such as stroke2,3. Recent studies have reported that the co-residency of H-type hypertension could aggravate the side effects of cardiovascular and cerebrovascular diseases4. Notably, 75% of patients in China with H-type hypertension have primary hypertension, which seriously affects the quality of life5. At present, the treatment of H-type hypertension mainly includes Western medicine. However, it may cause certain adverse effects and poor compliance and can no longer meet the needs for the comprehensive management of H-type hypertension.
Traditional Chinese medicine (TCM) is a unique resource with a history of more than 2,000 years in China. Due to the unmet need for hypertension control in Western medicine, clinicians have begun to consider the potential role of TCM in the prevention and treatment of H-type hypertension6. Huotan Jiedu Tongluo Decoction (HTJDTLD) is a traditional Chinese medicine formula formulated by Professor Yue Deng, drawing from his extensive clinical expertise7. Over the course of more than 20 years of clinical application, HTJDTLD has demonstrated remarkable effectiveness in the treatment of cardiovascular and cerebrovascular diseases1. However, whether HTJDTLD has therapeutic effects in H-type hypertension has not been reported. Therefore, we aimed to explore the antihypertensive effects and specific mechanisms of HTJDTLD in rats with H-type hypertension and identify potential therapeutic drugs for the treatment of H-type hypertension.
Protocol
All animal experiments were approved by the Institutional Animal Care and Use Committee (IACUC) of Changchun University of Chinese Medicine. The materials are listed in the Table of Materials.
1. Animals and treatment
- Randomly divide a total of 50 adult spontaneously hypertensive rats (SHRs) (male, 50 days old) into five groups, including control (CON), methionine (MET), MET + HTJDTLD + Enalapril maleate (EM), MET + EM, and MET + HTJDTLD groups.
NOTE: The experimental rats were housed in a controlled environment designed to ensure their comfort and well-being. The facility featured temperature-controlled rooms set at a constant 22 °C, with a relative humidity of 40-60%. The housing cages were made of transparent polycarbonate, providing ample space for each rat to move freely. The lighting schedule followed a 12-h light/dark cycle, simulating natural daylight conditions. The rats were provided with adequate food and water. - Provide the rats with the following diet for 28 days.
- Give the rats in the MET group a 3% methionine diet for 28 days to induce H-type hypertension.
- Administer the rats in the MET + HTJDTLD + EM group intragastrically with HTJDTLD (1.633 g/mL) and EM (0.2 mg/mL) at the dose of 1 mL/kg when the rats in addition to the 3% methionine diet.
- Administer the rats in the MET +EM and MET + HTJDTLD groups with HTJDTLD or EM by gavage, respectively, besides the 3% methionine diet.
NOTE: The HTJDTLD consists of Fructus Trichosanthis (20 g), Radix et Rhizoma Salviae miltiorrhizae (15 g), Lonicerae japonicae flos (30 g), Radix et Rhizoma Nardostachyos (15 g), Radix Angelicae sinensis (15 g), Radix et Rhizoma Glycyrrhizae (10 g), Hirudo (5 g), Radix et Rhizoma Rhodiolae crenulatae (15 g), and Radix Scrophulariae (15 g), and was decocted as previous reported7. EM dissolved in purified water (0.2 mg/mL) served as a positive control.
2. Blood pressure measurement
NOTE: Blood pressure measurements are performed using a noninvasive sphygmomanometer (Table of Materials).
- After treatment for 28 days, fast the rats in each group for 12 h and measure the blood pressure.
- Choose a restraining device that matches the size of the rat. The restraining device used in this study comprises a cylindrical restraint mesh, canvas cover, thermal tube, and stabilizing foam pad. Place the rat in the restraint mesh, put the restraint mesh into the thermal tube, and then put the thermal tube into the canvas cover.
- Place the signal cable in a suitable position under the cover. Place the rat's tail in the gap provided in the cover and secure it on the stabilizing form pad. An unoccupied, quiet, and warm environment is preferred for measurements. Move the rats to the measurement site 20-30 min in advance so that the rats can adapt to the measurement environment.
NOTE: Steps 2.2-2.3 can be performed several times to stabilize the rats. After several training sessions, the rats will get used to it and can stabilize very quickly, which is convenient for the subsequent blood pressure measurement. - Connect the pressurized sensor's air hose connection, signal connection, and holding tube. Place the pressurization sensor at the tip of the tail.
- Measure the blood pressure. A pulse wave appears after the rat tail is inserted into the sensor. Press Start/Stop to start/stop the measurement.
NOTE: The device will automatically determine whether the rat's tail is inserted into the sensor. When the rat's tail is not inserted, the pressurization sensor will not start pressurizing and will not make the measurement. - When the blood pressure test is completed, the Result menu will pop up automatically. Check the average value of the measurement, standard deviation (SD), standard error (SE), and coefficient of variation (CV) in the Results menu.
NOTE: The blood pressure of each rat was measured three times, with an interval of more than 2 min, and the mean value was calculated. - After measuring the blood pressure, euthanize the rat by intraperitoneal injection of excess 2% sodium pentobarbital (100 mg/kg). Then, using surgical scissors and toothed forceps, dissect the rat layer by layer from the perineum to the neck. Turn over the thoracic and abdominal contents, navigate to the abdominal aortic bifurcation between the two kidneys, and collect the aorta up to a section of the aortic arch.
3. Hematoxylin-eosin (HE) staining
- Fix the aortic vascular tissue in 4% paraformaldehyde for at least 24 h.
- Take the vascular specimens, dehydrate them in gradient alcohol, make them transparent in xylene, and embed them in paraffin.
- After embedding, make continuous slices with a 3-5 mm thickness. Dry the slices at 60-70 °C, then store them at room temperature (RT).
- Dewax the sections by immersing the sections in xylene I for 30 min, xylene II for 30 min, 100% alcohol I for 10 min, 100% alcohol II for 10 min, 95% alcohol I for 5 min, 95% alcohol II for 5 min, 80% alcohol for 5 min, and then rinse with distilled water.
- Stain the sections in Harris hematoxylin for 5 min, and rinse in tap water for 5 min. Differentiate in 1% hydrochloric acid alcohol for 10 s, and rinse thoroughly in tap water for 15 min. Wash the section in ammonia water for 5 s, and rinse thoroughly in tap water for 15 min.
- Perform microscopic observation, stain using eosin for 10 min, and rinse thoroughly in tap water for 15 min.
- Dehydrate the sections by immersing them in 80% ethyl alcohol for 10 s, 95% alcohol I for 5 min, 95% alcohol II for 5 min, 100% alcohol I for 10 min, 100% alcohol II for 10 min, xylene I for 10 min, and xylene II for 10 min.
- Seal the sections using neutral gum.
- Observe the histological changes in the aorta tissues under a light microscope (100x objective, 1000x magnification).
4. Masson's trichrome staining
- Perform routine dewaxing similar to HE staining.
- Hematoxylin staining: Immerse the slides into hematoxylin solution for 10 min, then rinse with tap water immediately.
- Immerse the slides into 1% hydrochloric acid solution for a few seconds, then rinse with tap water immediately afterward.
- Immerse the slides into Lichtenstein acidic magenta stain for 5 min and then rinse with water.
- Immerse the slides into 1% phosphomolybdic acid for 5 min.
- Immerse the slides into 2% aniline blue staining for 5 min and 1% glacial acetic acid immersion washing solution for 1 min. Then, drop wash the slides rapidly in 95% alcohol 3 times.
- Perform routine dehydration, transparency, and neutral gum sealing similar to HE staining.
5. Hcy measurement by ELISA
- Anesthetize the rats by intraperitoneal injection of 2% pentobarbital sodium (45 mg/kg) and confirm the depth of anesthesia by a toe pinch. Hold the rat and cut off the whiskers to avoid contact when taking blood. Remove the eyeballs of the rat with curved forceps and collect the blood in the prepared sterile microcentrifuge tubes. And then, euthanize the rat with an intraperitoneal injection of excess 2% sodium pentobarbital (100 mg/kg).
- Allow the blood to naturally coagulate for 10-20 min at RT, and then centrifuge (626-1409 x g) the blood for about 20 min at 2-8 °C.
- Carefully collect the supernatant and store it in the refrigerator at -80 °C.
- Dilute the standard in the test tube according to the kit instructions.
- Set up blank wells (no samples and enzyme reagents are added to the blank control wells; the rest of the steps are the same), standard wells, and sample wells to be tested. Add 50 µL of standards into the plate, 40 µL of sample dilution solution into the sample wells, and then 10 µL of serum (the final dilution of the sample is 5 times).
NOTE: Add the sample to the bottom of the wells of the plate; try not to touch the walls of the wells, and shake gently to mix. - Seal the plate with sealing film and incubate at 37 °C for 30 min.
- Dilute the 30 times concentrated washing solution 30 times with distilled water and prepare for use.
- Remove the sealing film carefully, discard the liquid, and shake it to remove all the liquid. Fill each well with washing solution, leave it for 30 s, and discard it. Repeat this 5 times and tap it dry.
- Add 50 µL of enzyme reagent to each well, except the blank wells.
- Use a sealing film to seal the plate and then incubate at 37 °C for 30 min.
- Repeat step 5.8.
- Add 50 µL of color developer A to each well, then add 50 µL of color developer B, and shake gently to mix well. Incubate at 37 °C for 10 min under low light.
- Add 50 µL of the stop solution to each well to terminate the reaction (the blue color will turn yellow).
- Zero the reaction with blank wells and measure the absorbance (OD value) of each well sequentially at 450 nm.
NOTE: Measurement should be carried out within 15 min after the addition of the stop solution.
6. RNA extraction and quantitative RT-PCR
- Extract total RNA.
- Cut the fresh aortic tissue quickly to the appropriate size (30-50 mg/piece), and grind thoroughly in liquid nitrogen. Add 1 mL of Trizol reagent, mix well, and incubate on ice for 10 min to lyze the tissue.
- Centrifuge at 2250 x g for 10 min at 4 °C. Carefully transfer the supernatant to a new microcentrifuge tube without pellet.
- Add 200 µL of chloroform, shake vigorously for 15 s, and incubate at RT for 5 min.
- Centrifuge at 2250 x g for 15 min at 4 °C. The mixture will be divided into three layers: the bottom phenol-chloroform organic phase, the middle phase, and the upper aqueous phase.
- Carefully transfer the upper aqueous phase to a new microcentrifuge tube (about 60% volume of Trizol). Do not aspirate the intermediate phase; a small amount of upper liquid can be left.
- Add an equal volume of isopropanol, mix gently by inverting about 10 times, and leave for 10 min at RT.
- Centrifuge at 2250 x g for 10 min at 4 °C. Discard the supernatant and wash the RNA precipitate twice with 1 mL of 75% ethanol.
- Centrifuge at 2250 x g for 5 min at 4 °C, discard the supernatant, and air-dry at RT for 5-10 min.
- Dissolve RNA in 15-50 µL of diethylpyrocarbonate (DEPC) water and check the RNA concentration.
- Perform reverse transcription and RT-qPCR (Table 1)
- Detect the gene expression related to endoplasmic reticulum stress (ERS) and apoptosis by qRT-PCR. Use the total RNA extracted in step 6.1 and reverse transcribe it to cDNA using the cDNA synthesis kit according to the manufacturer's instructions.
- Determine the gene expression using a real-time PCR detection system with a SYBR Green PCR master mix in a reaction volume of 20 µL.
- Quantitatively analyze the data by the 2−ΔΔCTmethod and express it as an n-fold difference relative to the expression of β-actin. The primers are shown in Table 2.
7. Western blotting (WB)
- Extract total tissue protein.
- Place a small amount of tissue block in the spherical part of 1-2 mL homogenizer, and cut the tissue block as much as possible with clean scissors.
- Add 400 µL (w:v=1:10) of the RIPA lysis buffer and homogenize. Then, place it on ice. After a few minutes, grind again and place on ice. Repeat the grinding process several times.
- After 30 min of lysis, use a pipette to transfer the lysate to a 1.5 mL centrifuge tube and place the tube in a pre-cooled 4 °C centrifuge. Centrifuge at 2250 x g for 10 min, and transfer the supernatant to a new 1.5 mL centrifuge tube.
- Quantify the protein.
- Dilute the protein standards according to the instructions of the kit. Obtain gradients of standards as follows: 0, 25, 125, 250, 500, 1000, 1500, and 2000 ng/µL.
- Take 2.5 µL of the protein sample and dilute it to 25 µL (10 fold) using the sample diluent.
- Take a 96-well plate and add 20 µL of standard protein sample (according to the concentration gradient) and target protein to the wells, respectively-two wells for each target protein sample.
- Prepare the developing solution (ready to use) by mixing liquid A and liquid B in the ratio of 50:1, and add 200 µL of developing solution to each well.
- Place the 96-well plate with added samples in an incubator at 37 °C for 30 min.
- Detect the absorbance at 562 nm.
- Calculate the concentration of protein to be measured.
- Take the standard protein concentration as the vertical coordinate and the absorbance at 562 nm as the horizontal coordinate to draw the standard curve.
- Calculate the concentration of the target protein based on the formula obtained from the standard curve and the measured absorbance of the target protein.
- Add 180 µL of loading buffer to 20 µL of protein sample in a microcentrifuge tube. Place the centrifuge tube in a metal bath and denature at 100 °C for 10 min. Use the denatured protein WB or store it at -20 °C.
- Perform immunoblotting.
- Configure protein electrophoresis gel.
- Clean and blow-dry the gel casting glass plate (1 mm or 1.5 mm) and fix it on the gel-casting device.
- Prepare 10% separation gel according to Table 3. Add the configured separating gel between the glass plates. Add the gel solution slowly to avoid the production of air bubbles. Then, add an appropriate amount of anhydrous ethanol to flatten the liquid surface of the separator. Leave it at RT for 20-30 min until the gel is solidified.
NOTE: The higher the molecular weight, the lower the concentration of glue, according to the need to formulate other concentrations of separating glue. - Prepare 5% concentrated gel according to Table 3. After the solidification of the separation gel, pour off the upper layer of anhydrous ethanol, fill up the concentrated gel, and slowly insert the gel comb that matches the glass plate (be careful not to have air bubbles). Leave it at RT for 20-30 min for the concentrated gel to solidify.
- Perform electrophoresis.
- Weigh 60.5 g of Tris, 375 g of glycine, and 20 g of sodium dodecyl sulfate (SDS). Add water to 2 L, heat at 60 °C, and stir to dissolve to form a 10x electrophoresis solution. Let the solution be at RT; dilute it to 1x when used.
- Remove the glass plate containing glue from the gel-casting device, pull down the glue comb in the water flow at a uniform speed, and at the same time, drain the air bubbles in the sampling hole.
- Fix the glass plate in the electrophoresis tank, and add the configured 1x electrophoresis solution. Ensure that the inner tank is full and that the outer tank is half the inner tank.
- Add the same mass of protein sample and 5 µL of marker (used to indicate the size of protein) in the sample addition well.
- Run the gel at 60 V for 20 min, then at 100 V for 90 min until the loading buffer runs to the bottom.
- Perform membrane transfer.
- Weigh 60 g of Tris and 288 g of glycine, and add water to 2 L. Stir and dissolve the solution well to make 10x membrane transfer solution, and reserve at RT. Dilute at a ratio of 1:2:7 (10x transmembrane solution: methanol: water) to make 1x working solution.
NOTE: Transmembrane solution should be prepared in advance and cooled to 4 °C in the refrigerator. - Soak the PVDF in methanol for an appropriate period of time (0.5-1 min) to activate the positively charged groups on the membrane and make it easier to bind with negatively charged proteins.
- Take the membrane transfer clip and fix it after placing the components in order (black surface-sponge-filter paper-electrophoresis gel-PVDF membrane-filter paper-sponge-white surface in sequence).
NOTE: Be careful to avoid air bubbles; when there are air bubbles, use the roller to drive out the air bubbles. - Place the splint in the membrane transfer tank, pay attention to following the correct electrode placement, put two ice bags in the tank, and fill up with 1x membrane transfer liquid. Finally, place the whole transmembrane tank in ice.
- Set the membrane transfer conditions to 100 V for 1 h.
NOTE: The membrane transfer time can be adjusted according to the size of the protein; the smaller the molecular weight of the protein, the shorter the membrane transfer time.
- Weigh 60 g of Tris and 288 g of glycine, and add water to 2 L. Stir and dissolve the solution well to make 10x membrane transfer solution, and reserve at RT. Dilute at a ratio of 1:2:7 (10x transmembrane solution: methanol: water) to make 1x working solution.
- Perform blocking.
- For phosphorylated proteins, use 5% BSA (solvent TBST) as the blocking solution. For non-phosphorylated proteins, use 5% skimmed milk (solvent TBST) for blocking.
- Pour the blocking solution into a dish of appropriate size. Put the PVDF membrane into the dish, and ensure that the PVDF membrane is submerged in the blocking solution. Close the dish and incubate at RT for 1 h.
- Remove the membrane. According to the marker display and the size of each target protein, cut the membrane into the appropriate size and label it with serial numbers.
- Incubate the antibody
- Remove the blocking solution and absorb the residual liquid with filter paper. Place the corresponding cut PVDF into the corresponding antibody dilutions (including CPR78 [1:1000], TRAF2 [1:1000], p-JNK [1:1000], caspase [1:1000], and GAPDH [1:1000]) and place it on the rotary shaker at 4 °C overnight.
- Add 1x TBST and rinse at RT three times (10 min each).
- Incubate the PVDF membrane in the secondary antibody dilutions per the manufacturer's instructions and incubate at RT for 1 h.
- Rinse the membrane by adding 1x TBST at RT three times (10 min each).
- Develop the PVDF membrane.
- Mix equal volumes of liquid A and liquid B in the luminescent solution kit, shake well, and prepare for use.
- Place the PVDF membrane on the cling film to spread, and quickly and evenly add the prepared luminescent agent onto the membrane quickly and evenly. Incubate for 3 min at RT, avoiding light.
- Detect the protein bands using enhanced chemiluminescence (ECL) western blotting detection reagents.
- Configure protein electrophoresis gel.
8. Data analysis
- Express all data as the mean ± S.D. Perform statistical analysis by one-way ANOVA using SPSS 20.0 software. Consider the differences statistically significant when p < 0.05.
Results
As shown in Table 4 and Table 5, the systolic blood pressure (SBP) and diastolic blood pressure (DBP) were significantly greater in the MET group than those in the CON group from 1 to 4 weeks. After HTJDTLD treatment, the SBP and DBP of the rats were significantly lower than those in the MET group. Notably, the combined utilization of HTJDTLD and EM had a stronger antihypertensive effect than HTJDTLD treatment alone.
According to HE staining and Masson's trichrome staining, the endometrium of the aortic vessel wall was incomplete and not smooth, and the media was significantly thickened. There was smooth muscle cell proliferation and hypertrophy, the number of layers of arrangement increased, and the fibers were disordered in the MET group compared with those in the CON group. However, the vascular endometrium recovered more completely and smoothly, the media thickening was significantly reduced, and intimal damage in the MET + HTJDTLD + EM, MET + EM, and MET + HTJDTLD groups was significantly relieved (Figure 1 and Figure 2). Furthermore, the Hcy concentration in the methionine group was 2-fold greater than in the control group. However, the Hcy concentrations in the MET + HTJDTLD + EM, MET + EM, and MET + HTJDTLD groups were significantly lower than those in the MET group. Notably, the most significant reduction was found in the MET + HTJDTLD + EM group, which was approximately 1-fold lower than that in the MET group (Figure 3). The mRNA and protein expression results showed that the expression of GPR78, TRAF2, JNK, p-JNK, and caspase-3 was obviously upregulated after methionine treatment. However, HTJDTLD, EM, and the combination of HTJDTLD and EM significantly inhibited the upregulation of GPR78, TRAF2, JNK, and caspase-3. Notably, the combined application of HTJDTLD and EM had the most significant effect (Figure 4 and Figure 5).
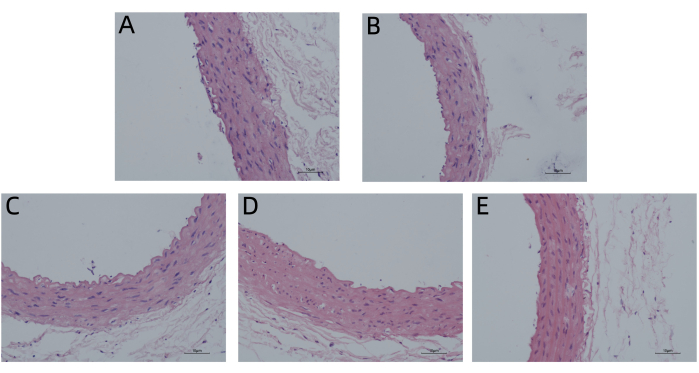
Figure 1: HE staining. Thoracic aorta tissues histological changes from (A) CON group, (B) MET group, (C) MET + HTJDTLD + EM group, (D) MET + EM group, and (E) MET + HTJDTLD group. Nuclei are stained blue, whereas the cytoplasm and extracellular matrix have varying degrees of pink staining (100x). Please click here to view a larger version of this figure.
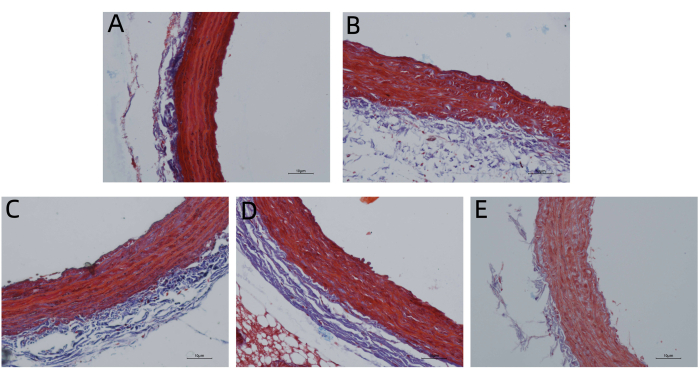
Figure 2: Masson staining. (A) CON group, (B) MET group, (C) MET + HTJDTLD + EM group, (D) MET + EM group and (E) MET + HTJDTLD group. Masson staining of aortic vessels in each group was performed to evaluate the effect of HTJDTLD on deposition and fibrosis (100x). Please click here to view a larger version of this figure.
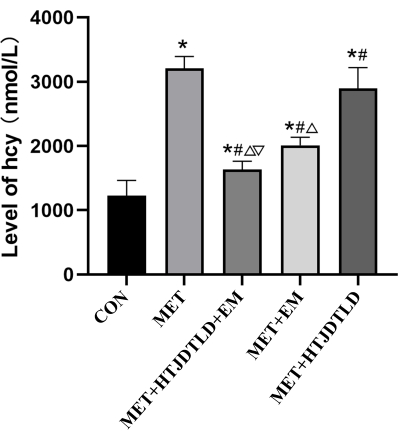
Figure 3: The level of Hcy. The serum Hcy concentration of each group was detected by ELISA. Data were presented as mean ± SD (n = 6, SD are as follows: CON: 236.5 nmol/L, MET: 185 nmol/L, MET + HTJDTLD + EM: 126.8 nmol/L, MET + EM: 124 nmol/L, MET + HTJDTLD: 325 nmol/L). Please click here to view a larger version of this figure.
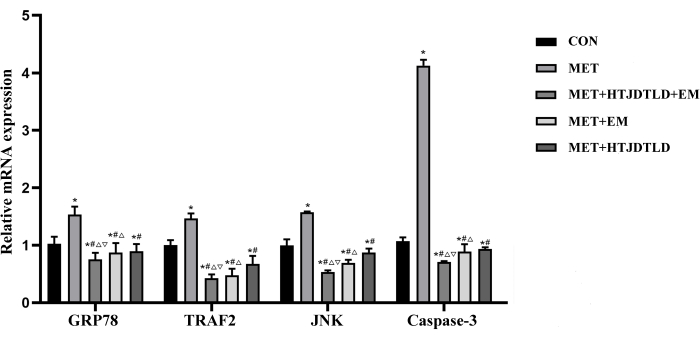
Figure 4: The mRNA expression of GRP78, TRAF2, JNK and caspase-3. After treatment with MET, MET + EM + HTJDTLD, and MET + EM, the expression of ERS-related genes was detected by qRT-PCR. Data were presented as mean ± SD (n = 6, SD as follows: GRP78 [CON: 0.12, MET: 0.13, MET + HTJDTLD + EM: 0.11, MET + EM: 0.17, MET + HTJDTLD: 0.12]; TRAF2 [CON: 0.09, MET: 0.09, MET + HTJDTLD + EM: 0.07, MET + EM: 0.11, MET + HTJDTLD: 0.13]; JNK [CON: 0.99, MET: 0.01, MET + HTJDTLD + EM: 0.03, MET + EM: 0.06, MET + HTJDTLD: 0.07; caspase-8 [CON: 0.06, MET: 0.10, MET + HTJDTLD + EM: 0.01, MET + EM: 0.13, MET + HTJDTLD: 0.03). * represents a significant difference compared with the CON group, # represents a significant difference compared with the MET group, Δ represents a significant difference compared with the MET + HTJDTLD group, and ∇ represents a significant difference compared with the MET + EM group. p < 0.01. Please click here to view a larger version of this figure.
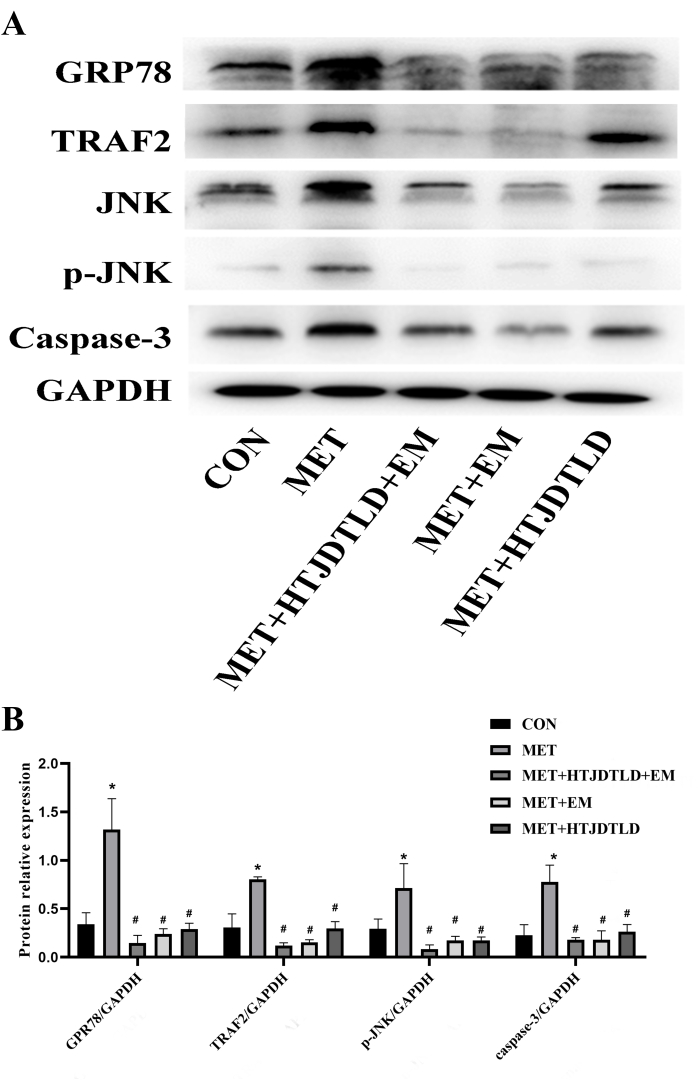
Figure 5: The protein expression of GRP78, TRAF2, JNK, p-JNK and Caspase-3. (A) The protein samples were analyzed by western blotting with GRP78, TRAF2, JNK, p-JNK, and Caspase-3 antibodies. GAPDH was used as a control. (B) Quantification of GRP78, RAF2, JNK, p-JNK, and Caspase-3 proteins was determined by densitometry and has been normalized to GAPDH. Data were presented as mean ± SD (n = 6). * represents a significant difference compared with the CON group, p < 0.01. # represents a significant difference compared with the MET group, Δ represents a significant difference compared with the MET + HTJDTLD group, and ∇ represents a significant difference compared with the MET + EM group. p < 0.01. Please click here to view a larger version of this figure.
| Reverse transcription reaction | |
| Component | Volume (mL) |
| Total RNA | 2 |
| gDNA digester Mix | 3 |
| SuperMix plus | 5 |
| RNase-free Water | 10 |
| The reaction program was as follows: 25 °C, 5 min; 55 °C, 15 min; 85 °C, 5 min. | |
| RT-PCR | |
| Component | Volume (mL) |
| Template | 2 |
| Forward Primer (10μM) | 0.4 |
| Reverse Primer (10μM) | 0.4 |
| Green qPCR Mix | 10 |
| Nuclease-free Water | 7.2 |
| The reaction program was as follows: pre-denaturation 95 °C, 5 min; denaturation 95 °C, 10 s; annealing/extension 60 °C, 45 s, for a total of 40 cycles. | |
Table 1: Reverse transcription reaction volumes.
| Primer name | Sequence (5’ to 3’) |
| GPR78-F | CGTCGTATGTGGCCTTCACT |
| GPR78-R | ATTCCAAGTGCGTCCGATGA |
| TRAF2-F | GAAGGGAGCATTCCTAGACC |
| TRAF2-R | GAAGGGAGCATTCCTAGACC |
| JNK-F | GTCAGAATCCGAACGAGA |
| JNK-R | GTCTACGCAGGCAATCG |
| Caspase-3-F | GCGGTATTGAGACAGACAGTGGAAC |
| Caspase-3-R | GCGGTAGAGTAAGCATACAGGAAGTC |
Table 2: List of primers.
| 10% separation gel, 5 mL system: | |
| Component | Volume (mL) |
| H2O | 1.9 |
| 30% acrylamide | 1.7 |
| 1.5 mol/L Tris-HCL (pH 8.8) | 1.3 |
| 10% SDS | 0.05 |
| 10% ammonium persulfate | 0.05 |
| TEMED | 0.002 |
| 5% concentrated gel, 3 mL system: | |
| Component | Volume (mL) |
| H2O | 2.1 |
| 30% acrylamide | 0.5 |
| 1.0 mol/L Tris-HCL (pH 6.8) | 0.38 |
| 10% SDS | 0.03 |
| 10% ammonium persulfate | 0.03 |
| TEMED | 0.003 |
Table 3: Composition of separation and concentrated gel.
| Group | 1 week | 2 week | 3 week | 4 week |
| CON | 163.4 ± 6 | 150.1 ± 7.0 | 134.2 ± 9.9 | 158.8 ± 10.2 |
| MET | 192.1 ± 9.5## | 166.7 ± 12.8# | 177.3 ± 19.7## | 187 ± 23.6## |
| MET+HTJDTLD+EM | 165.4 ± 9.2## | 148.9 ± 11.1* | 134.5 ± 12.3** | 159.2 ± 19.6** |
| MET+EM | 173 ± 9.1## | 149.9 ± 18.7* | 145 ± 12.5** | 162.4 ± 19.1** |
| MET+HTJDTLD | 176.7 ± 8.4## | 154.9 ± 22.8 | 168.3 ± 10.2 | 172.2 ± 17.4 |
Table 4: The changes in systolic pressure. #p < 0.05 and ##p < 0.01 vs. control group, *p <0.05 and **p < 0.01 vs. MET group.
| Group | 1 week | 2 week | 3 week | 4 week |
| CON | 138.4 ± 13.8 | 121.2 ± 12.5 | 107 ± 19.7 | 131.1 ± 16.3 |
| MET | 147.9 ± 7.7# | 131 ± 11.9 | 143.7 ± 19.6## | 146 ± 21.4## |
| MET+HTJDTLD+EM | 139.4 ± 10 | 123.1 ± 18.5 | 117.1 ± 9.6** | 129.2 ± 18.6** |
| MET+EM | 140.9 ± 13.4 | 119.6 ± 7.8 | 123.6 ± 10.8** | 128 ± 25.2** |
| MET+HTJDTLD | 140.4 ± 11.3 | 129.5 ± 11.1 | 138.3 ± 15.1 | 132.8 ± 16 |
Table 5: The changes in diastolic pressure.#p < 0.05 and ##p < 0.01 vs. control group, **p < 0.01 vs. MET group.
Discussion
Hypertension is one of the most common cardiovascular disorders that affects one-third of the adult population and increases the risk of stroke, coronary heart disease, and heart and renal failure8. H-type hypertension is a special type of hypertension that refers to the co-occurrence of primary hypertension and increased homocysteine levels and has attracted broad attention over the years9. In recent years, the use of oral EM combined with antihypertensive drugs has shown improved efficacy in terms of controlling blood pressure and lowering blood Hcy levels, but there are still many contraindications, side effects, drug resistance, and other shortcomings such as headache, dizziness, fatigue, cough, and hypotension. Traditional Chinese medicine offers advantages in treating H-type hypertension through its personalized approach, addressing underlying causes, and providing complementary effects with fewer side effects, enabling effective long-term management of the condition. In this study, we found that the traditional Chinese medicine formula HTJDTLD had obviously antihypertensive effects on methionine-induced H-type hypertension. More importantly, HTJDTLD significantly enhanced the antihypertensive efficacy of EM, which is the first approved treatment for hypertension associated with elevated Hcy. However, the administration of EM sometimes produces some adverse reactions.
The level of Hcy, a sulfur-containing amino acid formed during the metabolism of methionine, is elevated in cardiovascular and neurodegenerative diseases, including hypertension10, Alzheimer's disease, dementia11, and Parkinson's disease12. A previous study also indicated that the interaction between hypertension and homocysteine affects the risk of mortality among middle-aged and older individuals13. Woo et al.14 reported that increased Hcy levels cause endothelial dysfunction and are associated with arterial stiffness, which is a result of destroying elastin fibers and increasing collagen production. In this study, we found that the Hcy level in plasma was significantly increased in the methionine treatment group, which was also combined with elevated blood pressure and significant arterial pathological changes. However, HTJDTLD treatment significantly lowered the blood pressure, relieved arterial pathological damage, and reduced Hcy levels. EM, a new compound preparation containing both enalapril and folic acid, served as the first approved treatment for hypertension associated with elevated Hcy15. It's worth noting that HTJDTLD enhanced the antihypertensive effects as indicated by the decrease in Hcy levels and alleviation of pathological changes.
The endoplasmic reticulum (ER) is the central organelle for the synthesis, folding, and modification of secreted and transmembrane proteins16. Perturbation of normal ER function may lead to ER stress, which has been associated with many diseases and, more recently, hypertension17,18. Moreover, previous reports have indicated that Hcy can activate ER stress by disrupting disulfide bond formation and reducing endothelial viability and vasorelaxation19. Hcy-induced ER stress can also cause endothelial apoptosis20,21. However, whether HTJDTLD exerts antihypertensive effects by regulating ER stress has not been studied. Therefore, we explored the antihypertensive effects of HTJDTLD via the ER stress-induced apoptosis pathway. GPR78, also known as Bip, is a major chaperone and is activated after ER stress22. Tumor necrosis factor receptor-associated factor 2 (TRAF2) has also been proven to be associated with cellular responses to intrinsic signals, such as ER stress23. TRAF2 initiates signal transduction cascades, leading to the activation of c-Jun N-terminal kinase (JNK) in a cell- and context-dependent manner24. Caspase-3, a crucial executor of apoptosis, plays a pivotal role in the apoptotic process and can be activated through various pathways across various types of mammalian cells25. Caspase-3, a crucial executor of apoptosis, plays a pivotal role in the apoptotic process and can be activated through various pathways across various mammalian cell types26. Caspase-3 is involved in ER stress-mediated apoptosis and serves as the ultimate common member of different apoptotic cascades27. In this study, we detected the gene and protein expression of GPR78, TRAF2, JNK, and caspase 3 by qRT-PCR and western blotting. The results showed that methionine treatment significantly increased the gene and protein expression of GPR78, TRAF2, JNK, and caspase 3, and HTJDTLD significantly inhibited these gene and protein expression. However, there are still some limitations to using only these two methods. It may be ideal to evaluate the mechanism of action of HTJDTLD by using the inhibitor of the ERS-related signal pathway and detecting the cell apoptosis by flow cytometry. We will continue to improve our experimental protocol in future studies.
Our results indicated that HTJDTLD had antihypertensive effects in rats with methionine-induced H-type hypertension. The underlying mechanism may involve inhibiting ER stress activation-induced apoptosis. Given its antihypertensive effects and potential mechanism in rats with methionine-induced hypertension, HTJDTLD holds great promise for future therapeutic applications in the treatment of hypertension.
Disclosures
We declare that the research was conducted in the absence of any commercial or financial relationships that could be construed as a potential conflict of interest.
Acknowledgements
This work was supported by the National Natural Science Foundation of Jilin Province (no. YDZJ202301ZYTS189).
Materials
| Name | Company | Catalog Number | Comments |
|---|---|---|---|
| 1st Strand cDNA Synthesis SuperMix for qPCR | Yeasen,China | 11149ES | cDNA synthesis kit |
| Anti-beta-actin antibody | Bioss, China | bs-0061R | |
| Anti-caspase-3 antibody | Bioss, China | bs-0081R | |
| Anti-GPR78 antibody | Abcam, USA | ab108513 | |
| Anti-JNK antibody | Abcam, USA | ab76572 | |
| Anti-p-JNK antibody | Bioss, China | bsm-52462R | |
| Anti-rabbit IgG antibody | Bioss, China | bs-0295G-HRP | |
| Anti-TRAF2 antibody | Bioss, China | bs-22372R | |
| Bio-Rad CFX96 Touch system | Bio-Rad | CFX96 | real-time PCR detection system |
| ECL Western Blot Substrates | Merck, MA, USA | WBULP-10ML | |
| Enalapril maleate folic acid tablets | Yangzijiang Pharmaceutical Company, China | 20040991 | |
| FastStart SYBR Green Master | Sigma | FSSGMMRO | |
| Fructus Trichosanthis | The First Affiliated Hospital of Changchun University of Traditional Chinese Medicine, China | No catalog number | |
| Hirudo | The First Affiliated Hospital of Changchun University of Traditional Chinese Medicine, China | No catalog number | |
| intelligent noninvasive sphygmomanometer | Beijing Softron Biotechnology company | BP-2010A | |
| Lonicerae Japonicae Flos | The First Affiliated Hospital of Changchun University of Traditional Chinese Medicine, China | No catalog number | |
| Methionine | Sigma, USA | M9500 | |
| Radix Angelicae Sinensis | The First Affiliated Hospital of Changchun University of Traditional Chinese Medicine, China | No catalog number | |
| Radix et Rhizoma Glycyrrhizae | The First Affiliated Hospital of Changchun University of Traditional Chinese Medicine, China | No catalog number | |
| Radix et Rhizoma Nardostachyos | The First Affiliated Hospital of Changchun University of Traditional Chinese Medicine, China | No catalog number | |
| Radix et Rhizoma Rhodiolae Crenulatae | The First Affiliated Hospital of Changchun University of Traditional Chinese Medicine, China | No catalog number | |
| Radix et Rhizoma Salviae Miltiorrhizae | The First Affiliated Hospital of Changchun University of Traditional Chinese Medicine, China | No catalog number | |
| Radix Scrophulariae | The First Affiliated Hospital of Changchun University of Traditional Chinese Medicine, China | No catalog number | |
| Rat Hcy ELISA Kits | Shanghai Meimian Industrial Company, China | MM-0293R2 | |
| RIPA buffer | Shanghai Beyotime Biotechnology company | P0013B |
References
- Noone, C., Dwyer, C. P., Murphy, J., Newell, J., Molloy, G. J. Comparative effectiveness of physical activity interventions and antihypertensive pharmacological interventions in reducing blood pressure in people with hypertension: Protocol for a systematic review and network meta-analysis. Syst Rev. 7 (1), 128(2018).
- Huang, K., Zhang, Z., Huang, S., Jia, Y., Zhang, M., Yun, W. The association between retinal vessel abnormalities and h-type hypertension. BMC Neurol. 21 (1), 6(2021).
- Tan, Y., Nie, F., Wu, G., Guo, F., Wang, Y., Wang, L. Impact of h-type hypertension on intraplaque neovascularization assessed by contrast-enhanced ultrasound. J Atheroscler Thromb. 29 (4), 492-501 (2022).
- Towfighi, A., Markovic, D., Ovbiagele, B. Pronounced association of elevated serum homocysteine with stroke in subgroups of individuals: A nationwide study. J Neurol Sci. 298 (1-2), 153-157 (2010).
- Zhong, C., et al. High homocysteine and blood pressure related to poor outcome of acute ischemia stroke in Chinese population. Plos One. 9 (9), e107498(2014).
- Hao, P., Jiang, F., Cheng, J., Ma, L., Zhang, Y., Zhao, Y. Traditional Chinese medicine for cardiovascular disease: Evidence and potential mechanisms. J Am Coll Cardiol. 69 (24), 2952-2966 (2017).
- Tian, T., et al. Huotan Jiedu Tongluo decoction inhibits balloon-injury-induced carotid artery intimal hyperplasia in the rat through the perk-eif2α-atf4 pathway and autophagy mediation. Evid Based Complement Alternat Med. 2021, 5536237(2021).
- Simko, F., Pechanova, O. Potential roles of melatonin and chronotherapy among the new trends in hypertension treatment. J Pineal Res. 47 (2), 127-133 (2009).
- Li, T., et al. H-type hypertension is a risk factor for cerebral small-vessel disease. BioMed Res Int. 2020, 6498903(2020).
- Rodrigo, R., Passalacqua, W., Araya, J., Orellana, M., Rivera, G. Homocysteine and essential hypertension. J Clin Pharmacol. 43 (12), 1299-1306 (2003).
- Lehmann, M., Gottfries, C. G., Regland, B. Identification of cognitive impairment in the elderly: Homocysteine is an early marker. Dement Geriatr Cogn. 10 (1), 12-20 (1999).
- dos Santos, E. F., et al. Evidence that folic acid deficiency is a major determinant of hyperhomocysteinemia in Parkinson's disease. Metab Brain Dis. 24 (2), 257-269 (2009).
- Zhao, W., Gao, F., Lv, L., Chen, X. The interaction of hypertension and homocysteine increases the risk of mortality among middle-aged and older population in the United States. J Hypertens. 40 (2), 254-263 (2022).
- Woo, K. S., et al. Hyperhomocyst(e)inemia is a risk factor for arterial endothelial dysfunction in humans. Circulation. 96 (8), 2542-2544 (1997).
- Lu, F., et al. The intervention of enalapril maleate and folic acid tablet on the expressions of the grp78 and chop and vascular remodeling in the vascular smooth muscle cells of h-hypertensive rats with homocysteine. Eur Rev Med Pharmaco. 22 (7), 2160-2168 (2018).
- López-García, P., Moreira, D. Selective forces for the origin of the eukaryotic nucleus. BioEssays. 28 (5), 525-533 (2006).
- Minamino, T., Komuro, I., Kitakaze, M. Endoplasmic reticulum stress as a therapeutic target in cardiovascular disease. Circ Res. 107 (9), 1071-1082 (2010).
- Chen, X., Cubillos-Ruiz, J. R. Endoplasmic reticulum stress signals in the tumour and its microenvironment. Nat Rev Cancer. 21 (2), 71-88 (2021).
- Ji, C., Kaplowitz, N. Hyperhomocysteinemia, endoplasmic reticulum stress, and alcoholic liver injury. World J Gastroentero. 10 (12), 1699-1708 (2004).
- Zhang, C., et al. Homocysteine induces programmed cell death in human vascular endothelial cells through activation of the unfolded protein response. J Biol Chem. 276 (38), 35867-35874 (2001).
- Cunard, R. Endoplasmic reticulum stress, a driver or an innocent bystander in endothelial dysfunction associated with hypertension. Cur Hypertens Rep. 19 (8), 64(2017).
- Casas, C. GRP78 at the centre of the stage in cancer and neuroprotection. Front Neurosci. 11, 177(2017).
- Urano, F., et al. Coupling of stress in the ER to activation of JNK protein kinases by transmembrane protein kinase ire1. Science. 287 (5453), 664-666 (2000).
- Borghi, A., Verstrepen, L., Beyaert, R. TRAF2 multitasking in tnf receptor-induced signaling to nf-κb, map kinases and cell death. Biochem Pharmacol. 116, 1-10 (2016).
- Wen, X. -R., et al. Butylphthalide suppresses neuronal cells apoptosis and inhibits JNK-caspase3 signaling pathway after brain ischemia /reperfusion in rats. Cell Mol Neurobiol. 36 (7), 1087-1095 (2016).
- Jin, M., et al. Serine-threonine protein kinase activation may be an effective target for reducing neuronal apoptosis after spinal cord injury. Neural Regen Res. 10 (11), 1830-1835 (2015).
- Xu, F., et al. Estrogen and propofol combination therapy inhibits endoplasmic reticulum stress and remarkably attenuates cerebral ischemia-reperfusion injury and ogd injury in hippocampus. Biomed Pharmacother. 108, 1596-1606 (2018).
Reprints and Permissions
Request permission to reuse the text or figures of this JoVE article
Request Permission