We have developed a tissue-processing technique utilizing a vibratome and agarose-embedded lung tissue to generate lung sections, thereby permitting the acquisition of high-resolution images of lung architecture. We employed immunofluorescence staining to observe spatial protein expression using specific lung structural markers.
Method Article
Automated Vibratome Sectioning of Agarose-Embedded Lung Tissue for Multiplex Fluorescence Imaging
In This Article
Summary
Abstract
Due to its inherent structural fragility, the lung is regarded as one of the more difficult tissues to process for microscopic readouts. To add structural support for sectioning, pieces of lung tissue are commonly embedded in paraffin or OCT compound and cut with a microtome or cryostat, respectively. A more recent technique, known as precision-cut lung slices, adds structural support to fresh lung tissue through agarose infiltration and provides a platform to maintain primary lung tissue in culture. However, due to epitope masking and tissue distortion, none of these techniques adequately lend themselves to the development of reproducible advanced light imaging readouts that would be compatible across multiple antibodies and species.
To this end, we have developed a tissue-processing pipeline, which utilizes agarose embedding of fixed lung tissue, coupled to automated vibratome sectioning. This facilitated the generation of lung sections from 200 µm to 70 µm thick, in mouse, pig, and human lungs, which require no antigen retrieval, and represent the least "processed" version of the native isolated tissue. Using these slices, we reveal a multiplex imaging readout capable of generating high-resolution images whose spatial protein expression can be used to quantify and better understand the mechanisms underlying lung injury and regeneration.
Introduction
Ex vivo lung tissue slices are extensively used in the study of lung disease1. Current gold standards, particularly in clinical and translational large animal studies, employ hematoxylin and eosin staining coupled with brightfield microscopy and observer-based scoring to assess and grade lung dysfunction2,3. While still a valuable technique, it exhibits limitations in terms of spatial resolution and the number of markers that can be imaged simultaneously. Moreover, lung tissue is required to undergo extensive solvent-based washes, which results in dehydration, shrinkage, and rehydration of the tissue before its final imaging4. This process is not only time-consuming but is also environmentally unfriendly, masks protein epitopes, and may invoke structural tissue changes5,6,7,8. However, for lung tissue, embedding in paraffin prior to sectioning has been a necessity owing to the structural fragility of the lung. In contrast, solid organs such as the brain can be cut using a vibrating microtome (vibratome), both in fixed and fresh tissue9,10,11,12.
To enable vibratome sectioning in lung tissue, a method termed precision-cut lung slices (PCLS) was established where low melting point agarose is injected into fresh lung tissue via the airways or blood vessels and left to solidify13,14. The agarose in the airways provides sufficient structural support to then allow vibratome sectioning9,14. In rodents, this is simple to achieve as agarose can be injected via the trachea; however, in pig and human tissue, it can be challenging to locate a suitable airway/vessel within a given biopsy15,16. Moreover, even if such an airway/vessel is located, substantial force is usually required to inject the agarose, which may influence subsequent lung morphology17.
To overcome the challenges experienced in paraffin embedding/sectioning/staining and the PCLS workflow, we have established a new processing pipeline for fixed lung tissue. This workflow allows the use of a vibratome for sectioning, can produce thinner slices than in PCLS, and yields slices that do not require antigen retrieval for multiplex fluorescence imaging. This method offers a means of "least processing" to generate lung sections that can be used in advanced light microscopy. Moreover, imaging readouts can be used to demonstrate the spatial relationships of cells and anatomical structures within the lung tissue by capturing the volumetric architecture of the tissue18,19,20,21. This paper describes the protocol to generate these lung sections and demonstrates multiplex stains applied to each of these tissues and how these advanced imaging data can be used for quantification.
Protocol
Mouse lungs were donated by researchers using other organ systems in an effort to uphold the 3Rs. All procedures in pigs were carried out in accordance with the European directive 2010/63/EU and were approved by Malmö-Lund Ethical Committee on Animal Research (Dnr 5.8.18-05527/2019) and conducted according to the CODEX guidelines of the Swedish Research Council. Approval for the use of human samples was granted by the Swedish National Ethics Committee (Dnr 2020-07115 and Dnr 2020-01864). See the Table of Materials for details related to all materials and instruments used in this protocol.
1. Preparation of solutions and materials
- Fix the lung tissue in 4% paraformaldehyde at room temperature for 48 h. Subsequently, transfer the lung tissue to a 50 mL conical tube filled with Phosphate-buffered saline (PBS) containing 0.01% sodium azide.
- Prepare a 3% (w/v) agarose solution by dissolving 1.5 g of low-melting-point agarose in 50 mL of sterile PBS. Ready a plastic cup, fine forceps, and sterile scissors.
- Heat the agarose in a microwave until it boils, then cool it down to 42 °C in a water bath. Keep the agarose in its liquid form by storing it in the water bath until ready to use.
NOTE: While heating the agarose, watch the microwave until it begins to boil so it does not overflow. This usually takes around 1.5 min.
2. Lung tissue embedded in agarose
- Lift the lung biopsy from the PBS-azide and carefully dissect the lung lobes using fine forceps and sterile scissors. Cut the lung lobe into smaller blocks.
NOTE: While sectioning with pleura is possible, its thick elastin bundles can impede cutting with the vibratome blade. Thus, we recommend its removal if it is not necessary. - Cut a plastic cup through the middle and add a small amount of agarose to its bottom. Place the lid from a 50 mL conical tube (rim removed) on the surface of the agarose and store the cup at 4 °C for 5 min to allow the agarose to solidify for later use.
- Retrieve the plastic cup from the 4 °C refrigerator, add approximately 1 mL of liquid agarose onto the lid, then gently place the lung tissue block onto the lid. Leave the agarose for 2-3 min to semi-solidify at room temperature. Then, slowly pour the liquid agarose onto the lung tissue until it is fully submerged.
- Refrigerate at 4 °C for approximately 15 min until the agarose solidifies. Next, carefully use a sharp blade to remove extra agarose surrounding the lung tissue, leaving a uniform layer of approximately 5 mm thickness around the tissue (Figure 1).
3. Cutting lung tissue sections
- To prepare the lung tissue for sectioning, attach each tissue block onto the specimen disk of the vibratome using super glue. Next, fill the vibratome buffer tray with PBS and place ice in the surrounding ice bath. Finally, carefully install the specimen disk into the buffer tray.
- Slice the lung tissue with the vibratome with the following settings: thickness: 200 µm, frequency: 100 Hz, amplitude of the blade: 1.3 mm, and forward speed of the blade of 0.02-0.03 mm/s, which depends on tissue stiffness.
NOTE: Cutting is possible down to a thickness of 70 µm if the blade speed is reduced to 0.01 mm/s. Certain vibratomes (e.g., Leica V1200s) allow automation of sectioning by setting a cutting window. - To collect sections, gently transfer the tissue slice by scooping it with a brush from the vibratome tray into a 24-well plate filled with 0.01% azide in PBS. Finally, preserve the lung slices at 4 °C.
4. Immunostaining of elastin, CD31, HTII-280, and SMA
- Permeabilize and block (1% bovine serum albumin + 0.5% Triton + 5% normal goat serum) the tissue at 4 °C under gentle shaking for 45 min.
- Dilute the primary antibodies (SMA 1:500; elastin 1:250; CD31 1:250; HTII-280 1:250) in PBS, add 300 µL in per well, and incubate overnight at 4 °C under gentle shaking.
- Without touching the slice and removing the primary antibodies with a pipette tip, wash 3 x 20 min (400 µL) with PBS.
- Dilute the secondary antibodies (1:1000) in PBS, add 300 µL in per well, and incubate at 4 °C under gentle shaking for 90 min.
- Remove the secondary antibodies with a pipette tip, add 4’,6-diamidino-2-phenylindole (DAPI)(1:1000) and tomato lectin-488 (1:500) for a 30 min incubation, and wash for 3 x 10 min with PBS.
- Place three drops of mounting medium on the slide, mount a coverslip, and proceed to imaging.
Results
The process of generating lung tissue slices involves several key steps, including preparation, embedding, and sectioning. The agarose solution (3% (w/v) is made by dissolving 1.5 g of low-melting-point agarose in 50 mL of sterile PBS. Consumables needed include a plastic cup, lid from a 50 mL conical tube (rim removed), forceps, and scissors. The lung tissue is carefully resected into smaller blocks with fine forceps and sterile scissors (Figure 1A,B). Next, to embed the lung tissue blocks, the bottom of the cup is filled with a small amount of the agarose, a lid is placed on the surface of the agarose, and the cup is stored at 4 °C for 5 min (Figure 1C). Approximately 1 mL of liquid agarose is added to the lid, and the lung tissue block is placed onto the lid. The agarose is left for 2-3 min to semi-solidify at room temperature (Figure 1D). Once a lung block is held in place by the semi-solidified agarose, liquid agarose is then poured into the cup until the lung tissue block is fully submerged. This is stored at 4 °C for 15 min (Figure 1E,F). The low-melting-point agarose embedding provides the necessary support and stiffness to the lung tissue, which helps maintain its original architecture during the slicing process. A sharp blade is used to remove excess agarose surrounding the lung tissue. A uniform layer of approximately 5 mm thickness is left around the tissue (Figure 1G). The excised lung tissue block is then carefully glued onto the tissue holder (Figure 1H). The vibratome buffer tray is filled with PBS, ice is placed in the surrounding ice bath, and the specimen disk installed in the buffer tray (Figure 1I). The vibratome cutting parameters set on the panel were: slice thickness: 200 µm; frequency: 100 Hz; amplitude of the blade: 1.3mm; forward speed of the blade: 0.02-0.03 mm/s, which depends on tissue stiffness (Figure 1J). Finally, staining is carried out on free-floating slices (Figure 1K-M).
Immunofluorescence staining was carried out in 200 µm sections from each species for smooth muscle actin (SMA, a smooth muscle cell and myofibroblast marker), elastin (extracellular matrix protein) and Lycopersicon Esculentum lectin (LEA), which binds to bronchoalveolar epithelial cells. The lung is a structurally heterogeneous tissue and as such, differential SMA and elastin distribution is observed across structures, including alveolar ducts, blood vessels, intrapulmonary bronchioles, and alveoli from mice, pigs, and humans (Figure 2A-L). A high-resolution rendering of a 20 µm volume of a bronchiole shows how fine structures within the lung can be examined at a semi-three-dimensional level (Supplemental Video S1). As a quantitative example, utilizing image tracing, we show how the size of the alveoli differs between samples (n = 20 alveoli) (Figure 2L,M).
To show how it is possible to quantitatively utilize these advanced imaging data, we compared type 2 pneumocyte (TII) cell distributions in human lung tissue from an adult and an infant. The human-specific type 2 alveolar cell antibody, HTII-280, has a strong affinity to the surface of human type 2 cells (Figure 3A-F). These cells can further be viewed in the three-dimensional space of a single alveolus using volumetric imaging (Supplemental Video S2). To quantify the TII number between the adult and infant samples, we processed the HTII-280 count across 10 random fields of view (fov). Between these samples, the infant sample yielded a significantly higher TII cell count (Figure 3G). However, the infant sample also exhibited a significantly higher scaffold coverage than the adult, which could explain the higher cell number (Figure 3H). To account for this, we then assessed the number of TIIs based on scaffold coverage, as cells per mm2 of tissue, which still maintained a significantly higher number of TIIs in the infant sample (Figure 3I). Thus, the higher TII count in the infant sample is not due to increased scaffold coverage and highlights the importance of assessing cell distributions in the lung based on the area of the scaffold, not the overall fov.
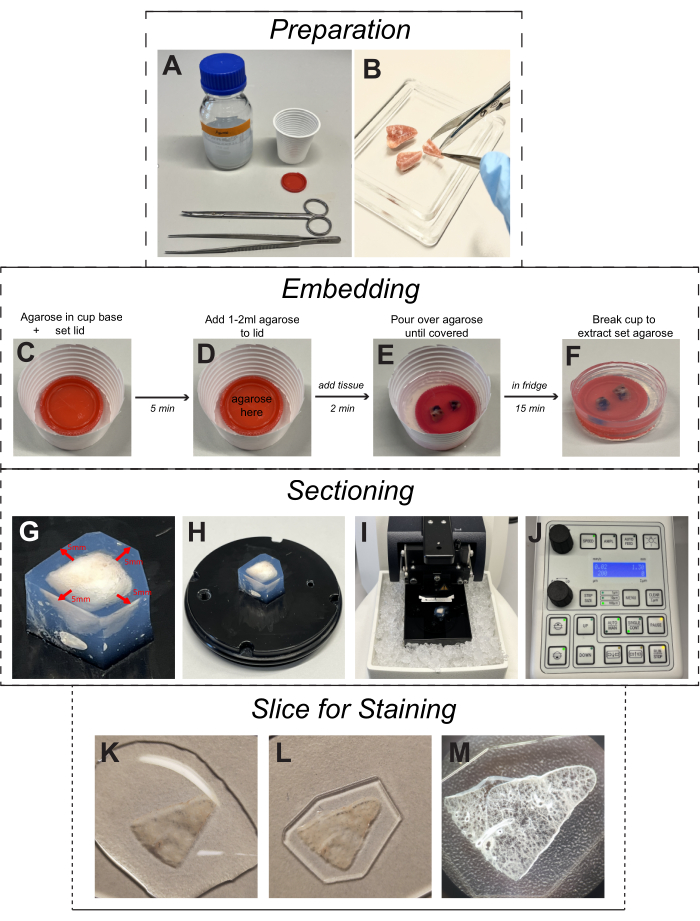
Figure 1: Protocol for cutting lung tissue slices. (A) The solutions and materials: a 3% (w/v) agarose solution obtained by dissolving 1.5 g of low-melting-point agarose in 50 mL of sterile phosphate-buffered saline; a plastic cup; a lid from 50 mL conical tube; forceps, and scissors. (B) The lung tissues were dissected by using fine forceps and sterile scissors. (C) Fill the bottom of the cup with a small amount of agarose and place the lid on the surface of the agarose; then, store it at 4 °C for 5 min. (D) Add 1-2 mL of liquid agarose to the lid slowly, place the lung tissue chunk onto the lid carefully, and store it at 4 °C for 2 min. (E,F) Pour the liquid agarose into the cup until the lung tissue chunk is fully submerged, store it at 4 °C for 15 min, and then break the plastic cup gently. (G) Use a sharp blade to remove excess agarose surrounding the lung tissue, leaving a uniform layer of approximately 5 mm thickness around the tissue. (H) The excised lung tissue block is then carefully glued onto the tissue holder. (I) Fill the vibratome buffer tray with PBS, place ice in the surrounding ice bath, and install the specimen disk into the buffer tray. (J) Set cutting parameters on the panel of the vibratome; slice thickness: 200 μm, frequency: 100 Hz, amplitude of the knife: 1.3 mm, and forward speed of the blade of 0.02-0.04 mm/s. (K-M) Representative images of a free-floating slice still embedded in agarose and ready for immunofluorescence staining. Please click here to view a larger version of this figure.

Figure 2: Immunofluorescence images of lung structure in human, pig, and mouse. (A-L) Representative images of an alveolar duct, blood vessel, bronchiole, and alveoli in lung tissue slices from mouse, pig, and human, respectively. SMA (shown in green) is a marker for smooth muscle cells and is observed in the vascular and bronchial walls of lung tissue. Elastin (shown in red) forms part of the extracellular matrix of the lungs. (M) Quantification of alveolar size by selecting 20 random positions on each lung tissue slice for both human, pig, and mouse samples. Histograms were utilized to illustrate the distribution of alveolar size within each group. Scale bars = 50 µm (A-F, H-L), 100 µm (G). Kruskall-Wallis Test. *p < 0.05, **p < 0.01, ***p < 0.001, ****p < 0.0001. Abbreviations: DAPI = 4′,6-diamidino-2-phenylindole; LEA = Lycopersicon Esculentum lectin; SMA = smooth muscle actin; ms = mouse; hmn = human. Please click here to view a larger version of this figure.
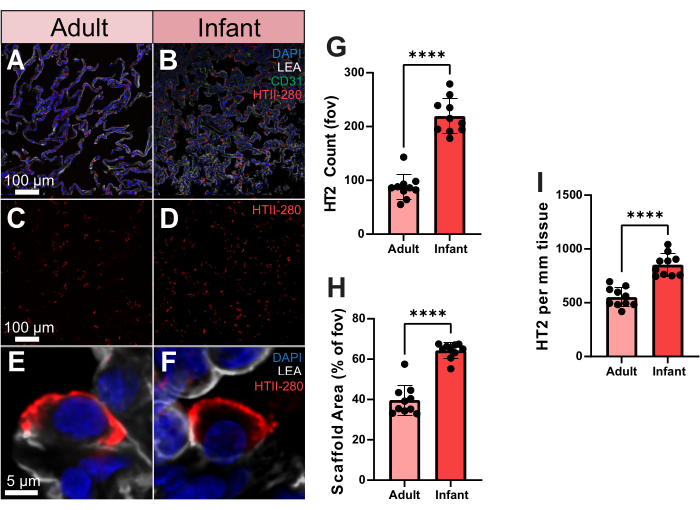
Figure 3. Type 2 pneumocyte distribution in human adult and infant samples. (A,B) Representative images of adult and infant human lung tissue stained for HTII-280 (shown in red), CD31 (shown in green), and LEA (shown in gray). (C,D) Representative images of adult and infant human showing type 2 pneumocyte distribution alone. (E,F) Single-cell resolution representative images of an individual type 2 pneumocyte from adult and infant human lung samples. (G) Quantification of the number of type 2 pneumocytes between adult and infant samples. (H) Quantification of lung tissue scaffold area coverage (% vs air) in adult and infant samples. (I) Quantification of type 2 pneumocyte per mm2 of tissue in adult and infant samples. Scale bars = 5 µm (E,F), 100 µm (A-D). n = 10 fov per sample. Unpaired t-test or Mann-Whitney Test. *p < 0.05, **p < 0.01, ***p < 0.001, ****p < 0.0001. Abbreviations: DAPI = 4', 6-diamidino-2-phenylindole; LEA = Lycopersicon Esculentum lectin; HTII = human type II cells; CD31 = Platelet endothelial cell adhesion molecule-1/cluster of differentiation 31; fov = field of view. Please click here to view a larger version of this figure.
Supplemental Video S1: Video of 20 µm imaging volume of a single porcine airway stained using DAPI, LEA, SMA, and elastin showing a high-resolution view of the structure of airway wall elements. Abbreviations: DAPI = 4′,6-diamidino-2-phenylindole; LEA = Lycopersicon Esculentum lectin; SMA = smooth muscle actin. Please click here to download this File.
Supplemental Video S2: Video of 30 µm imaging volume of a single alveolus stained using DAPI, LEA, and HTII-280 showing type 2 pneumocyte distribution across the structure. Abbreviations: DAPI = 4′,6-diamidino-2-phenylindole; LEA = Lycopersicon Esculentum lectin; SMA = smooth muscle actin. Please click here to download this File.
Discussion
In this protocol, we present an improved vibratome-based method for generating lung sections. Compared to paraffin-based processing techniques, this method is more cost effective, time efficient, and better for the environment22. Moreover, this method helps maintain the structural integrity of pulmonary tissue slices and allows for advanced immunofluorescence imaging without the need for antigen retrieval. However, during our experiments, we also found certain limitations to this workflow. Diseased lungs can interfere with the cutting process due to tissue destruction caused by pathological changes. While using the vibratome for sectioning, airway obstructions and severe fibrotic lung tissue can impede the blade, making the process of slicing these tissues more challenging. However, this can be overcome by reducing blade speed and supporting the tissue with a fine paintbrush. Similar challenges arise from the thickening of the pleura, which is a common outcome in pleurisy, chronic obstructive pulmonary disease (COPD), and idiopathic pulmonary fibrosis (IPF)23,24,25. If the pleura is not of interest for an experiment, we recommend removing it before sectioning or by isolation a lung volume away from the pleura. If the pleura is necessary, then it can be sliced using a similar manipulation as above, involving slower blade speeds and slice support from a fine brush.
While precision-cut lung slices can preserve the three-dimensional architecture and native environment of the lung26, it is important to note that generating PCLS is a complex and time-consuming process. The success of generating lung tissue slices greatly depends on the efficiency of agarose filling, which, in turn, is influenced by the presence of intact pleura and viable injection sites in the obtained tissue. This is simple to achieve in rodents as agarose can easily be introduced through the trachea into intact lungs27,28,29. However, in large animal research, biopsies taken across an experiment are typically from distal lung segments, which lack a large enough airway to cannulate30,31. Thus, instead of injecting agarose into the bronchus or blood vessels, we adopt this method where lung tissue, regardless of species of origin or sample volume, is embedded in low-melting-point agarose to generate lung tissue slices. This approach is technically easier and aims to minimize tissue damage as much as possible. Based on our experience, this method has demonstrated higher efficiency and ease in generating lung tissue sections. It effectively preserves the morphology of alveoli and is particularly suitable for cutting lung tissue, enabling the generation of repeatable high-resolution multiplex fluorescence imaging.
In this study, we further demonstrate two sample-based quantifications for the imaging data generated. The first utilized image tracing to assess differences in alveolar size across species samples. Unsurprisingly, mouse alveoli were the smallest, while pig and human alveoli were similar in size, highlighting pigs as an interesting translational model for lung research.
For the second quantification, we compared HTII distribution between an adult and infant lung sample. Type 2 pneumocytes play a vital role in the structure of the distal lung epithelium. This unique capability of TIIs contributes to the repair and regeneration of the alveolar epithelium32. In the healthy adult human lung, TIIs account for approximately 15% of the total cell population, while their coverage of the alveolar surface area is estimated to be around 5%33. HTII-280 is a widely recognized lung-specific marker for studying the development and response of alveolar epithelial cells to injury, and it is specifically localized to the apical plasma membranes of TIIs. In the experiment, adult tissue was obtained from a donor patient who died due to intracerebral hemorrhage and had concurrent lung injury, while the infant sample came from an asphyxiation-related mortality. Our findings indicate that the expression of HTII-280 was significantly lower in the adult lung sample than in the infant sample. Interestingly, while HTII-280 is expressed in the majority of HTIIs, its expression can also be influenced by tissue quality, and it is significantly reduced in injured human lung tissue34. Aged lung tissues exhibit a significant decrease in the number and secretory activity of TIIs compared to young tissues, and elderly individuals demonstrate considerably lower proliferation, secretion, and anti-apoptotic activity of TIIs in comparison to those young tissues35. In keeping with this, the identification and detection of a cell-surface protein specific to human TIIs could aid in assessing the severity of lung injury and evaluating treatment approaches aimed at enhancing lung repair36,37. Thus, utilizing this pipeline, it would be of great interest to conduct alveolar TII studies in larger human cohorts of health and disease.
In conclusion, this protocol presents a faster and easier approach for cutting lung tissue. This method provides detailed instructions for lung tissue preparation, cutting, and staining, ensuring the preservation of the intact lung tissue structure. It optimizes the model for studying both healthy and diseased lung architecture, leading to improved experimental efficiency. Overall, this study introduces a promising approach to investigate complex spatial biology in lung tissue pathophysiology across species, which can help to better understand the molecular mechanisms at play in disease and repair.
Disclosures
The authors have no conflicts of interest to disclose.
Acknowledgements
The authors gratefully acknowledge funding received from the Wallenberg Molecular Medicine Foundation and Stem Cell Center of Lund University and acknowledge the Lund University Bioimaging Centre (LBIC) for access to the Nikon A1RHD.
Materials
| Name | Company | Catalog Number | Comments |
|---|---|---|---|
| 24 well tissue culture inserts | SARSTEDT | 83.3932.300 | |
| 4% paraformaldehyde | SOLVECO | 6095714 | |
| 4’, 6-diamidino-2-phenylindole (DAPI) | Thermo Fisher scientific | D1306 | |
| 50 mL Falcon tube | SARSTEDT | 2045221 | |
| Cluster of differentiation 31 (CD31) | Abcam | ab28364 | |
| Confocal microscope | Nikon | A1R HD25 | |
| Elastin | Abcam | ab23747 | |
| Epredia X1000 Coverslip | Thermo Fisher scientific | 10318963 | |
| Epredia SuperFrost Plus Adhesion slides | Thermo Fisher scientific | 10149870 | |
| Forceps | AESCULAP | FB395R | |
| Goat anti-mouse 647 | Invitrogen | A21235 | |
| Goat anti-rabbit 568 | Invitrogen | A11011 | |
| Human type II cells | Terrace Biotech | TB-27AHT2-280 | |
| Invitrogen Fluoromount-G Mounting Medium | Thermo Fisher scientific | E41473 | |
| Low gelling temperature Agarose | Sigma-Aldrich | 1003467046 | |
| Lycopersicon Esculentum lectin | Thermo Fisher scientific | 2531965 | |
| Phosphate-buffered saline (PBS) | Thermo Fisher scientific | 50-100-8798 | |
| Plastic cup | kontorsgiganten | 885221 | |
| Scissors | STILLE | 101-8380-18 | |
| Smooth muscle actin | Abcam | ab5694 | |
| Sodium azide | Sigma-Aldrich | K54329188239 | |
| Super glue | LOCTITE | 2721643 | |
| Vibrating microtome | Leica | VT1200S |
References
- Morin, J. P., et al. Precision cut lung slices as an efficient tool for in vitro lung physio-pharmacotoxicology studies. Xenobiotica. 43 (1), 63-72 (2013).
- Kawasaki, H., et al. The NanoSuit method: a novel histological approach for examining paraffin sections in a nondestructive manner by correlative light and electron microscopy. Laboratory Investigation. 100 (1), 161-173 (2020).
- Silva, I., et al. A Semi-quantitative scoring system for green histopathological evaluation of large animal models of acute lung injury. BIO-PROTOCOL. 12 (16), e4493(2022).
- Kim, J. H., et al. Optimizing tissue-clearing conditions based on analysis of the critical factors affecting tissue-clearing procedures. Scientific Reports. 8 (1), 12815(2018).
- Jain, D., et al. Immunocytochemistry for predictive biomarker testing in lung cancer cytology. Cancer Cytopathology. 127 (5), 325-339 (2019).
- Alturkistani, H. A., Tashkandi, F. M., Mohammedsaleh, Z. M. Histological stains: a literature review and case study. Global Journal of Health Science. 8 (3), 72-79 (2015).
- Morrison, L. E., Lefever, M. R., Lewis, H. N., Kapadia, M. J., Bauer, D. R. Conventional histological and cytological staining with simultaneous immunohistochemistry enabled by invisible chromogens. Laboratory Investigation. 102 (5), 545-553 (2022).
- Dineshshankar, J., et al. Kerosene as an alternative to xylene in histopathological tissue processing and staining: An experimental study. Journal of Pharmacy and Bioallied Sciences. 11 (6), 376(2019).
- Abdelaal, H. M., et al. Comparison of vibratome and compresstome sectioning of fresh primate lymphoid and genital tissues for in situ MHC-tetramer and immunofluorescence staining. Biological Procedures Online. 17 (1), 2(2015).
- Siwczak, F., Hiller, C., Pfannkuche, H., Schneider, M. R. Culture of vibrating microtome tissue slices as a 3D model in biomedical research. Journal of Biological Engineering. 17 (1), 36(2023).
- Bèchet, N. B., Shanbhag, N. C., Lundgaard, I. Glymphatic pathways in the gyrencephalic brain. Journal of Cerebral Blood Flow & Metabolism. 41 (9), 2264-2279 (2021).
- Bèchet, N. B., Kylkilahti, T. M., Mattsson, B., Petrasova, M., Shanbhag, N. C., Lundgaard, I. Light sheet fluorescence microscopy of optically cleared brains for studying the glymphatic system. Journal of Cerebral Blood Flow and Metabolism. 40 (10), 1975-1986 (2020).
- Bai, Y., Ai, X. Utilizing the precision-cut lung slice to study the contractile regulation of airway and intrapulmonary arterial smooth muscle. Journal of Visualized Experiments. (183), (2022).
- Gerckens, M., et al. Generation of human 3D lung tissue cultures (3D-LTCs) for disease modeling. Journal of Visualized Experiments. (144), (2019).
- Sanderson, M. J. Exploring lung physiology in health and disease with lung slices. Pulmonary Pharmacology & Therapeutics. 24 (5), 452-465 (2011).
- Lam, M., Lamanna, E., Organ, L., Donovan, C., Bourke, J. E. Perspectives on precision cut lung slices—powerful tools for investigation of mechanisms and therapeutic targets in lung diseases. Frontiers in Pharmacology. 14, 1162889(2023).
- Liu, G., et al. Use of precision cut lung slices as a translational model for the study of lung biology. Respiratory Research. 20 (1), 162(2019).
- Cooper, P. R., et al. Formoterol and salmeterol induce a similar degree of β 2- adrenoceptor tolerance in human small airways but via different mechanisms. British Journal of Pharmacology. 163 (3), 521-532 (2011).
- Ochoa, L. F., et al. Imaging of murine whole lung fibrosis by large scale 3D microscopy aided by tissue optical clearing. Scientific Reports. 8 (1), 13348(2018).
- Tehrani, K. F., Park, J., Chaney, E. J., Tu, H., Boppart, S. A. Nonlinear imaging histopathology: a pipeline to correlate gold-standard hematoxylin and eosin staining with modern nonlinear microscopy. IEEE Journal of Selected Topics in Quantum Electronics. 29 (4), (2023).
- Branchfield, K., et al. A three-dimensional study of alveologenesis in mouse lung. Developmental Biology. 409 (2), 429-441 (2016).
- Li, Y., et al. Precision vibratome for high-speed ultrathin biotissue cutting and organ-wide imaging. iScience. 24 (9), 103016(2021).
- Qian, G., et al. DOCK2 promotes pleural fibrosis by modulating mesothelial to mesenchymal transition. American Journal of Respiratory Cell and Molecular Biology. 66 (2), 171-182 (2022).
- Cagle, P. T., Allen, T. C. Pathology of the pleura: What the pulmonologists need to know. Respirology. 16 (3), 430-438 (2011).
- Jantz, M. A., Antony, V. B. Pleural fibrosis. Clinics in Chest Medicine. 27 (2), 181-191 (2006).
- Viana, F., O’Kane, C. M., Schroeder, G. N. Precision-cut lung slices: A powerful ex vivo model to investigate respiratory infectious diseases. Molecular Microbiology. 117 (3), 578-588 (2022).
- Paddenberg, R., Mermer, P., Goldenberg, A., Kummer, W. Videomorphometric analysis of hypoxic pulmonary vasoconstriction of intra-pulmonary arteries using murine precision cut lung slices. Journal of Visualized Experiments. (83), e50970(2014).
- Lyons-Cohen, M. R., Thomas, S. Y., Cook, D. N., Nakano, H. Precision-cut mouse lung slices to visualize live pulmonary dendritic cells. Journal of Visualized Experiments. (122), e55465(2017).
- Klouda, T., Kim, H., Kim, J., Visner, G., Yuan, K. Precision cut lung slices as an efficient tool for ex vivo pulmonary vessel structure and contractility studies. Journal of Visualized Experiments. (171), e62392(2021).
- Ghaidan, H., et al. Reduction of primary graft dysfunction using cytokine adsorption during organ preservation and after lung transplantation. Nature Communications. 13 (1), 1-15 (2022).
- Guenthart, B. A., et al. Regeneration of severely damaged lungs using an interventional cross-circulation platform. Nature Communications. 10 (1), 1985(1985).
- Ruaro, B., et al. The history and mystery of alveolar epithelial type II cells: focus on their physiologic and pathologic role in lung. International Journal of Molecular Sciences. 22 (5), 2566(2021).
- Crapo, J. D., Barry, B. E., Gehr, P., Bachofen, M., Weibel, E. R. Cell number and cell characteristics of the normal human lung. The American Review of Respiratory Disease. 126 (2), 332-337 (1982).
- Evans, K. V., Lee, J. -H. Alveolar wars: The rise of in vitro models to understand human lung alveolar maintenance, regeneration, and disease. Stem Cells Translational Medicine. 9 (8), 867-881 (2020).
- Chen, J. -X., et al. Sirtuin 3 ameliorates lung senescence and improves type II alveolar epithelial cell function by enhancing the FoxO3a-dependent antioxidant defense mechanism. Stem Cells and Development. 30 (17), 843-855 (2021).
- Zacharias, W. J., et al. Regeneration of the lung alveolus by an evolutionarily conserved epithelial progenitor. Nature. 555 (7695), 251-255 (2018).
- Gonzalez, R. F., Allen, L., Gonzales, L., Ballard, P. L., Dobbs, L. G. HTII-280, a biomarker specific to the apical plasma membrane of human lung alveolar type II cells. Journal of Histochemistry & Cytochemistry. 58 (10), 891-901 (2010).
Reprints and Permissions
