Hyperpolarized 129Xe magnetic resonance imaging (MRI) is a method for studying regionally resolved aspects of pulmonary function. This work presents an end-to-end standardized workflow for hyperpolarized 129Xe MRI of lung ventilation, with specific attention to pulse sequence design, 129Xe dose preparation, scan workflow, and best practices for subject safety monitoring.
Method Article
Acquiring Hyperpolarized 129Xe Magnetic Resonance Images of Lung Ventilation
In This Article
Summary
Abstract
Hyperpolarized 129Xe MRI comprises a unique array of structural and functional lung imaging techniques. Technique standardization across sites is increasingly important given the recent FDA approval of 129Xe as an MR contrast agent and as interest in 129Xe MRI increases among research and clinical institutions. Members of the 129Xe MRI Clinical Trials Consortium (Xe MRI CTC) have agreed upon best practices for each of the key aspects of the 129Xe MRI workflow, and these recommendations are summarized in a recent publication. This work provides practical information to develop an end-to-end workflow for collecting 129Xe MR images of lung ventilation according to the Xe MRI CTC recommendations. Preparation and administration of 129Xe for MR studies will be discussed and demonstrated, with specific topics including choice of appropriate gas volumes for entire studies and for individual MR scans, preparation and delivery of individual 129Xe doses, and best practices for monitoring subject safety and 129Xe tolerability during studies. Key MR technical considerations will also be covered, including pulse sequence types and optimized parameters, calibration of 129Xe flip angle and center frequency, and 129Xe MRI ventilation image analysis.
Introduction
Hyperpolarized 129Xe MRI is an exciting tool for non-invasive, spatially-resolved characterization and quantification of specific aspects of pulmonary function1,2,3. Acquisition and reconstruction approaches similar to those used in anatomical proton MRI yield images of inhaled 129Xe in the lungs, permitting visualization of non-ventilated lung regions and region-resolved quantification of ventilation distribution4,5,6,7,8. More advanced pulse sequence and analysis techniques yield further complementary information, including quantification of gas-exchange efficacy between alveoli and pulmonary capillaries via spectroscopic MRI9,10,11,12,13 and characterization of alveolar microstructure integrity via diffusion-weighted MRI14,15,16.
Inhaled 129Xe has been proven safe and tolerable in adult and pediatric subjects, including those with pulmonary disease17,18. Measurements of lung function derived from 129Xe MRI have shown sensitivity to structural and functional alterations in many pulmonary disease contexts, including chronic obstructive pulmonary disease6,10,19, cystic fibrosis20,21,22, idiopathic pulmonary fibrosis23,24,25, and asthma7,10,26. Given the high safety and tolerability of 129Xe MRI, the lack of ionizing radiation in MRI compared with other common imaging approaches, and the high reproducibility of 129Xe MRI results27,28, 129Xe MRI holds significant promise, in particular for precise serial monitoring of individuals receiving a time course of therapy for chronic pulmonary disease.
The safety and clinical promise of 129Xe MRI have led to its FDA approval in December 2022 for lung ventilation imaging in persons aged 12 years and older29. Given this, it is anticipated that the number of research and clinical sites capable of performing 129Xe MRI (currently ~20 worldwide) will increase significantly over the coming years. As 129Xe MRI spreads to new institutions, it is important that robust methodological resources exist to allow sites to build out clinically relevant 129Xe MRI techniques quickly and to perform scans and generate results that are closely comparable with those of existing sites.
In this work, we will outline the current best practices for human hyperpolarized 129Xe MRI of lung ventilation, as agreed upon by member institutions of the 129Xe MRI Clinical Trials Consortium (Xe MRI CTC) and summarized in a recent position paper30. Topics will include the preparation of tailored pulse sequences ideal for a complete 129Xe MRI workflow, preparation, and administration of hyperpolarized 129Xe gas, an optimized workflow for human 129Xe MRI sessions, and best practices for monitoring subject safety and comfort during MRI sessions.
Protocol
All research involving human subjects must be approved by an institutional review board (IRB). IRB involvement is not necessary for regulatory-approved clinical use of 129Xe MRI. Before participating in a research study, prospective subjects must be provided with an approved informed consent document. The person obtaining consent must explain the contents of the document, including the purpose, procedures, benefits, and risks of the study, must answer any questions, and must obtain consent from the subject to proceed with the study as documented by the subject's signature on the informed consent document. In the case of pediatric subjects or other special circumstances, approved practices for obtaining consent must be followed. The protocol described below follows the guidelines of the IRB of the University of Virginia, and the example case subjects in this manuscript have signed the University of Virginia IRB-approved consent forms (IRB 13647, 16215, 16885, 19569).
1. Preparation of hardware and pulse sequences for 129Xe MRI
NOTE: The protocol steps under step 1 should be performed before scanning any human subjects. They do not need to be repeated for each subject.
- Verify that the MRI scanner is capable of multinuclear operation including 129Xe.
- Verify that the 129Xe radio-frequency (RF) coil can be connected to the MRI scanner, using a purpose-built coil-to-scanner interface box if required.
- Verify that suitable software (often called a coil file) for interfacing the 129Xe RF coil to the MRI scanner is installed if required by the scanner manufacturer.
- Prepare pulse sequences for 129Xe and 1H imaging as described below.
- For 129Xe calibration, prepare a non-localized, spectroscopic sequence comprising a series of free induction decays (FIDs) using the pulse sequence parameters provided in Table 1.
NOTE: The FIDs acquired at ~218 ppm (dissolved-phase frequency) are used primarily to determine parameters for dissolved-phase 129Xe MRI, which is not covered in the present work. However, these parameters are given so that one can develop a single standardized 129Xe calibration that suffices for 129Xe MRI scans of any type. Additionally, note that a separate calibration scan may not be needed for studies involving only 129Xe ventilation imaging once the site acquires sufficient experience. The 129Xe operating frequency can be accurately estimated by scaling the scanner-determined 1H frequency by the ratio of 129Xe to 1H gyromagnetic ratios, and the transmitter calibration can be estimated based on accumulated experience and subject weight. - For 129Xe ventilation MRI, prepare a two-dimensional (2D) RF-spoiled gradient-echo sequence using the pulse sequence parameters provided in Table 2. Ensure that 129Xe is selected as the target nucleus.
- For conventional 1H anatomical MRI, prepare a single-shot turbo/fast spin-echo sequence or an RF-spoiled gradient-echo sequence using the parameters provided in Table 2.
NOTE: For 129Xe ventilation and 1H anatomical sequences, FOV and the number of slices are subject-specific. Choose these parameters at the beginning of the scan session in such a way as to ensure full coverage of the lungs in all three dimensions.- Enable phase oversampling to mitigate potential aliasing of the arms into the imaging FOV.
- MRI scanner vendor limitations may prevent the operation of the single-shot turbo/fast spin-echo sequence at the coarse in-plane resolution suggested (4 mm x 4 mm). If this is the case, use a resolution that is an integer factor of the desired resolution (e.g., 2 mm x 2 mm).
NOTE: The 1H anatomical scan can alternatively be acquired using a 2D RF-spoiled gradient echo sequence. In this case, use the same parameters as the ventilation scan parameters given in Table 2 but enable phase oversampling to avoid aliasing of the arms into the imaging FOV.
- For 129Xe calibration, prepare a non-localized, spectroscopic sequence comprising a series of free induction decays (FIDs) using the pulse sequence parameters provided in Table 1.
- Verify the operation of the RF coil and pulse sequences outlined above by performing scans of a thermally polarized 129Xe phantom31 for 129Xe scans and a 1H phantom for 1H scans.
| Parameter | Calibration | ||
| TR | 15 ms | ||
| TE | 0.45 ms (3 T), 0.8 ms (1.5 T) | ||
| RF pulse | windowed sinc | ||
| RF duration | 0.65-0.69 ms (3 T), 1.15-1.25 ms (1.5 T) | ||
| Flip angle | 20° | ||
| RF frequency | 218 ppm (dissolved-phase), 0 ppm (gas-phase) | ||
| Dwell time | 39 μs | ||
| Bandwidth | 25.6 kHz | ||
| No. of samples | 256 (not including oversampling, if used) | ||
| Readout duration | 10 ms | ||
| Number of FIDs | 1 noise (no RF), 499 at dissolved-phase freq., 20 at gas-phase freq. | ||
| Gradient spoiling | moment of at least 15 mT/m-ms (each axis, after each FID) | ||
| Duration | ~8 s | ||
Table 1: Recommended pulse sequence parameters for 129Xe calibration. Parameters are given for a non-localized, spectroscopic 129Xe calibration pulse sequence.
| Parameter | Ventilation | Anatomical |
| Sequence type | RF-spoiled gradient-echo | Single-shot turbo/fast spin-echo |
| TR | <10 ms | Infinite |
| TE | <5 ms | <50 ms |
| Echo spacing | N/A | 3-5 ms |
| Excitation flip angle | 8-12° | 90° |
| Refocusing flip angle | N/A | ≥90° (highest allowed within SAR limits) |
| Slice thickness | 15 mm | 15 mm |
| Slice gap | None | None |
| Slice orientation | Coronal | Coronal |
| Slice order | Sequential (anterior to posterior) | Sequential (anterior to posterior) |
| Phase-encoding order | Sequential (left to right) | Sequential (left to right) |
| NEX | 1 (up to 7/8 partial Fourier permitted) | Half Fourier |
| Asymmetric echo | Allowed | N/A |
| Voxel size | 4 x 4 x 15 mm3 | 4 x 4 x 15 mm3 |
| Sampling duration per echo | 5-7 ms | 1-1.5 ms |
| Scan duration | 8-12 s | ≤16 s |
Table 2: Recommended pulse sequence parameters for 129Xe ventilation and 1H anatomical imaging. Parameters are given for a 2D RF-spoiled fast gradient-echo sequence for 129Xe ventilation imaging (first column) and a 2D single-shot turbo/fast spin-echo sequence for 1H anatomical imaging (second column). Note that the anatomical scan can alternatively be acquired using a 2D RF-spoiled gradient echo sequence. In this case, use the same parameters as the ventilation scan parameters given here, but add phase oversampling as needed to avoid aliasing of the arms into the imaging FOV. Also, note that the particular method for specifying receiver bandwidth varies across scanner manufacturers but that the correct value can be calculated for any scanner manufacturer from the given sampling duration per echo.
2. Screening and preparation of candidates for 129Xe MRI
- Ensure that there are no contraindications for MRI in the prospective subject by surveying them with an MR safety form. Supplementary File 1 depicts an example form used at the University of Virginia.
- Ensure that the prospective subject does not meet any exclusion criteria particular to 129Xe MRI examinations, which might include, but are not limited to: percent-predicted FEV1 less than 25%, a decompensated respiratory condition within the previous 6 weeks, chest circumference larger than the interior circumference of the 129Xe RF coil, and history of unstable cardiac disease.
NOTE: Additional criteria that do not indicate immediate exclusion but warrant careful individual consideration include: the need for significant supplemental oxygen at baseline (i.e., greater than 3 L/min by nasal cannula) and a history of neurologic disorder with baseline abnormalities. - If performing lung diffusion testing (DLCO) or spirometry during the imaging visit, instruct the subject not to ingest carbonated beverages on the day of the study visit. If a subject uses prescribed respiratory medication, instruct them to delay or refrain from taking it if specified by the study protocol.
3. Preparation of hyperpolarized 129Xe doses
NOTE: Detailed 129Xe polarizer and polarization measurement station instructions are proprietary and specific to each vendor. The instructions below comprise a basic summary for general spin-exchange optical pumping 129Xe polarizer operation.
- Decide on a dose volume for the subject. Commonly, a total dose volume of 1 L is chosen for all subjects, and this total dose volume is specified in the FDA label for 129Xe MRI. However, current Xe MRI CTC recommendations30 suggest that the total dose volume (xenon plus either nitrogen or helium) should target 1/5th of the subject's forced vital capacity (FVC) to ensure a comfortable amount of gas to inhale for each subject and to minimize effects related to lung volume difference between subjects.
- If recent spirometry results are available for the subject, use these to determine 1/5th of FVC. If spirometry results are unavailable, estimate the subject's total lung capacity (TLC) based on height, sex, and race, and estimate the total dose as 1/6th of TLC.
- Decide on a volume of xenon gas to polarize.
NOTE: Target xenon volumes for each dose bag are given as dose equivalent (DE) volumes, which conceptually indicate the equivalent volume of 100% enriched, 100% polarized 129Xe gas. Conceptually, DE volume is directly proportional to the expected signal-to-noise ratio (SNR) of a 129Xe scan, and recommended DE volume will be higher or lower for certain 129Xe scan types based on the SNR required for that scan type.- Calculate the DE volume for a given xenon dose as follows32:

where VXe is the total volume of xenon gas (all isotopes, not just 129Xe) in the dose, f129Xe is the 129Xe isotopic enrichment, and P129Xe is the 129Xe polarization. - Choose the total necessary DE volumes for the set of 129Xe scans that will be performed. The recommended DE volumes for individual calibration and ventilation scans are 75-150 mL.
NOTE: For ventilation imaging, the SNR must be high enough to robustly distinguish between ventilated and non-ventilated image voxels. A DE volume of 50 mL is considered the absolute minimum for ventilation imaging30 to achieve an expected SNR of at least 20. For calibration scans, a DE volume as low as 25 mL may be acceptable if only the gas-phase signal is calibrated; at least 75 mL should be used if calibrating both the gas-phase and dissolved-phase signals.
- Calculate the DE volume for a given xenon dose as follows32:
- Use the total necessary DE volume, known 129Xe isotropic enrichment of the xenon gas, and estimated 129Xe polarization based on previous polarization runs to calculate the total required xenon gas volume for polarization. An example calculation is shown below for one ventilation scan (DE volume = 75 mL), assuming 129Xe isotopic enrichment of 85% and polarization of 20%32:

Perform this calculation for each xenon dose to determine the correct volume of polarized xenon gas to dispense into each dose bag.- Subjects with low BMI (<21) have a higher risk of more profound central nervous system (CNS) effects following 129Xe inhalation than other subjects. Consult a physician before imaging low-BMI subjects and consider minimizing 129Xe dose volumes to avert these potential issues.
- Prepare the 129Xe polarizer according to all instructions supplied by the polarizer vendor.
- Steps may include the following, depending on polarizer vendor: ensure that the Helmholtz coil power supply is ON; evacuate the outlet manifold to clear any impurities; set up the liquid nitrogen dewar around/beneath the cold finger; turn ON power to the lasers and allow them to warm up; turn ON airflow to the oven, set the oven to the appropriate temperature using the oven controller, and allow the oven to warm up.
CAUTION: Liquid nitrogen can cause severe frostbite if it comes in contact with skin, eyes, or clothing, and high-intensity laser light can cause eye injury if impingent upon the eye without protection. Use appropriate caution and wear protective gear as needed.
- Steps may include the following, depending on polarizer vendor: ensure that the Helmholtz coil power supply is ON; evacuate the outlet manifold to clear any impurities; set up the liquid nitrogen dewar around/beneath the cold finger; turn ON power to the lasers and allow them to warm up; turn ON airflow to the oven, set the oven to the appropriate temperature using the oven controller, and allow the oven to warm up.
- Ensure the 129Xe polarization measurement station is powered ON and the software is ready to measure dose polarization.
- Begin collection of hyperpolarized 129Xe by performing the following steps.
- Start nitrogen flow to the cold finger warming jacket.
- Start xenon mixture flow to the cold finger. Refer to polarizer performance curves in polarizer documentation to choose the optimal flow rate.
- Add liquid nitrogen to the dewar surrounding the cold finger.
- Record polarization start time on a data sheet to ensure accurate polarization volume.
- Once collection has started, adjust flow and oven controllers to maintain consistent flow rate and temperature, and add liquid nitrogen as needed to keep the dewar full.
- During xenon accumulation, prepare Tedlar dose bags for dose collection by repeatedly purging and evacuating bags at least 3x using the polarizer outlet manifold to minimize impurities and/or depolarizing gases in the bags.
- Once the appropriate time for collection of desired hyperpolarized 129Xe volume has elapsed, terminate hyperpolarized 129Xe collection as directed in the polarizer documentation.
- Thaw the frozen 129Xe that has precipitated in the cold finger, as described below.
- Attach a 129Xe dose bag to the xenon outlet on the outlet manifold.
- Carefully remove the liquid nitrogen dewar and replace it with a thawing vessel containing room temperature water.
- While thawing, monitor pressure continuously, opening the flow valve from the cold finger to the xenon outlet once the pressure reaches a threshold value given in the polarizer documentation and quickly closing the valve as the pressure drops.
- Continue dispensing sublimated xenon gas into the dose bag in this manner until the desired amount of xenon in the dose bag is reached.
- Add the buffer gas (nitrogen or helium) at this time if it was not added to the bag previously.
- Once all desired xenon and buffer gases are added to the bag, quickly close the pinch clamp on the bag tubing, close the xenon outlet valve, and detach the full-dose bag from the polarizer.
- Move the bag immediately to the magnetic field created by the Helmholtz coil pair of the 129Xe polarization measurement station.
CAUTION: Pressure will rapidly build in the cold finger as the xenon gas warms and sublimates, creating a potential explosion risk if pressure is allowed to build beyond safe limits. Follow the instructions for this step provided in polarizer documentation exactly, and wear eye protection while performing this step.
- Measure and record polarization in each dose bag at the 129Xe polarization measurement station, according to the instructions provided by the polarization measurement station vendor.
- Once polarization is measured, keep 129Xe dose bags in the magnetic field created by the Helmholtz coil pair of the polarization measurement station until ready to administer a dose to the subject.
4. Pre-scan preparation and coaching of subject
NOTE: It is recommended that if the subject receives a full exam that includes a six-minute walk test, the walk should not take place until after 129Xe MRI is completed to avoid fatiguing the subject in a manner that could potentially impact 129Xe MRI results. This is particularly relevant for patients with cardiopulmonary disease.
- Confirm that the subject has correctly carried out all pre-visit instructions as described in step 2, and that no changes to health that would meet any study exclusion criteria or constitute an MRI contraindication have occurred since the subject was screened.
- Perform all necessary physical tests on the subject, including an electrocardiogram (ECG); a collection of vitals including body temperature, heart rate, respiration rate, blood oxygen saturation (SpO2), and blood pressure; spirometry; and a DLCO test.
- Monitor these tests for any potential warning signs, including low SpO2 (<92%), elevated blood pressure, or significant deviation of test results from any existing baselines for the subject.
NOTE: These readouts, particularly baseline SpO2, are checked because of the expectation that mild transient oxygen desaturation will occur during 129Xe inhalation. For subjects with baseline SpO2 <92% or other warning signs, consult a physician to confirm the suitability of the subject for 129Xe MRI testing and whether to use supplemental O2 between 129Xe inhalations. - Coach the subject in the correct 129Xe inhalation procedure, as described below.
- Prepare one or more Tedlar bags containing air for the subject to practice outside the scanner. Use an air volume that matches the total volume of xenon and buffer gas that will be inhaled from the bag during the actual study.
- Prepare nose clips for the subject to wear during breath-hold scanning. Fit the nose clips onto the subject's nose before the start of breath holds (both for practice and actual scanning).
- Coach the subject using one air-filled bag for each attempt, following the instructions below. The subject should begin inhaling the bag from a target volume of functional residual capacity. During the procedure below, monitor the subject's chest to confirm that they are executing the instructions as given.
- Have the bag ready, but do not administer it to the subject yet. Ask the subject to: Take a regular breath in. Breathe it out. Take a regular breath in. Breathe it out.
- Place the tube attached to the Tedlar bag into the subject's mouth. Hold the bag where the subject can inhale from it and open the valve. Ask the subject to: Breathe in. Breathe in. Breathe in.
- Once the subject has inhaled the entire bag contents, ask the subject to: Hold your breath. Immediately instruct the scanner operator to: Go!
NOTE: When scanning the subject, the scanner operator should start the scan upon hearing Go! This instruction is not intended for the subject (that is, they should remain still and continue holding their breath as instructed immediately beforehand) but does alert the subject that scanning is imminent. - Wait for the scan to finish, or when practicing, for a count of 10-15 s, which is the approximate amount of time required for a typical 129Xe scan to elapse.
- Ask the subject to: Breathe. The subject exhales at this point. Coach the subject to take several deep breaths in and out at this point to facilitate quicker clearance of 129Xe from the lungs and a quicker return to normal oxygen saturation levels.
- Verify that the subject is able to carry out these instructions reliably. Consider excluding subjects who are unable to inhale the entire gas volume, unable to maintain breath-hold, or who persistently cough during breath-hold attempts during the test.
NOTE: The outcome of this test is critical to determine likely imaging quality. This check for reliable subject compliance is particularly important in the contexts of pediatric imaging and imaging of severe lung disease, as subjects in either or both of these categories are more likely to struggle to reliably complete the required breath-hold.
5. Preparation of MRI scanner room and positioning of subject on scanner patient table
- Ensure that anyone who enters or might be expected to enter the MRI scanner room (subject and personnel) removes all metallic and/or electronic objects from their pockets and person prior to entering the scanner room.
- Prepare the 129Xe vest coil by plugging it into the scanner and placing it on the MRI scanner patient table.
- Instruct the subject to lie on the patient table in a feet-first supine position (or head-first supine, if better suited for the layout of the scanner room). Place pillows under the subject's head, knees, etc., in consultation with the subject to ensure that the subject can comfortably lie still throughout the examination.
- Secure the 129Xe vest coil around the subject's chest. Aim for the midline of the coil in the head-foot direction to lie as close as possible to the expected midline of the subject's lungs at a comfortable lung inflation level to avoid signal reductions at the periphery of the lungs.
NOTE: It is a common error to position the coil too far in the direction of the subject's feet. Positioning the coil as directed above may put the coil further toward the subject's head than might naively be expected. Additionally, the subject's arms may need to be positioned above their head and outside the coil if the subject's chest diameter necessitates this. The specific chest diameter above which this positioning is required will vary depending on specific scanner and coil hardware. For smaller subjects, arms can be positioned either above the head and outside the coil or at the sides and inside the coil. - Set up an MRI-safe pulse oximeter next to the patient table in the MRI scanner room and connect the pulse oximeter probe to the subject. Verify that the pulse oximeter is reading correctly.
- Place a nasal cannula in the subject's nose (or, for a healthy subject, have one standing by in the scanner room) and connect it to an oxygen source to be used if the subject's SpO2 drops more than 10% for more than 2 min after dose inhalation. Place the oxygen tank and regulator in an MR-safe manner based on local safety policy within reachable distance.
- Advance the patient table into the MRI scanner, aligning the midline of the coil/subject's lungs to the scanner's isocenter.
6. Scanning procedure
- In the user interface on the MRI scanner, enter subject data and open the previously prepared (as described in step 1) 129Xe MRI protocol.
- Ensure that 129Xe doses have been prepared as described in step 3 and that 129Xe dose bags are in the magnetic field generated by the polarization measurement station's Helmholtz coil pair (or in an equivalent device) to minimize 129Xe depolarization rate.
- Perform a 1H localizer scan using a standard vendor-provided protocol (e.g., a three-plane localizer) as described below.
- Instruct the subject to take a comfortable, natural breath in and hold their breath. While the subject holds their breath, execute the localizer scan.
- View results of the localizer scan on the MRI scanner interface. If images show artifacts (e.g., if metal-containing clothing was not removed), resolve any issues and repeat the localizer. If the localizer FOV is poorly centered on the subject, reposition the subject and repeat. Once acceptable localizer images have been obtained, proceed to the next step.
- Perform initial pre-scan adjustments for 129Xe scans as described below.
- Set the initial 129Xe center frequency by dividing the 1H center frequency from the localizer by 3.61529 (the approximate ratio of the respective gyromagnetic ratios of 1H and 129Xe).
- Set the initial 129Xe transmitter setting based on calibration results from previous subjects with similar body habitus, scaling based on 1H reference voltage, or the subject's measured weight. Details of 129Xe transmitter settings are specific to the scanner and 129Xe coil manufacturers.
- Use the scanner's default shim settings for all 129Xe acquisitions.
- After performing the pre-scan adjustments described above, acquire the 129Xe calibration scan to find the 129Xe center frequency and transmitter settings as described below.
- Load the 129Xe calibration sequence from the prepared protocol. Ensure all pulse sequence parameters are as desired and set the scan execution setting such that the scan can be executed with a single click.
- Bring the 129Xe dose bag intended for the 129Xe calibration scan from the polarization measurement station into the scanner room. Hold or place the dose bag at the ready near the subject; avoid regions near the bore opening where the magnetic field strength changes rapidly.
- Assist the subject in inhaling the 129Xe dose from the bag, following the coached inhalation procedure outlined in step 4.
- Execute the scan immediately upon hearing Go! signaled by the individual assisting the subject.
- Monitor the subject while the scan proceeds. If the subject visibly exhales, coughs, moves, etc., repeat the scan if possible.
- As soon as the scan finishes, instruct the subject to exhale and breathe freely.
- Following the scan, monitor the subject's heart rate and SpO2 using the pulse oximeter and monitor for transient central nervous system effects (such as dizziness, light-headedness, euphoria, and paresthesia) via verbal communication with the subject.
NOTE: Almost all subjects will experience very mild CNS effects that require no intervention, with the exception of subjects with low body fat content, as referred to in step 3.2. - Wait for any deviations from baseline to dissipate before administering another 129Xe dose. If no significant deviations from baseline occur, wait at least 2 min before administering another 129Xe dose.
NOTE: A typical time course of oxygen de-saturation and recovery is as follows: de-saturation starts 10-20 heartbeats after completing 129Xe inhalation, nadir occurs 20-30 heartbeats after completing inhalation, and recovery occurs within 45-50 heartbeats after completing inhalation. Most de-saturation resolves within 30 s of 129Xe inhalation and should be typically expected to entirely resolve within 2 min. Consult a physician if persistent de-saturation (greater than 10% of subject baseline) continues beyond 2 min, as it may be advisable to avoid giving any further 129Xe doses and/or end the study.
- Perform the 129Xe calibration analysis as described below (e.g., using a standalone analysis tool).
- Determine 129Xe center frequency using the spectrum from the first gas-phase FIDs.
- Determine 129Xe transmitter adjustment as described below.
- Fit the peak intensities of the 20 gas-phase FIDs to the following function30 and solve for the flip angle, α:

where Si is the magnitude of the signal intensity resulting from the ith excitation, S0 is the magnitude of the signal intensity from the first excitation, and C is a noise offset parameter. - Once α is obtained, scale the initial 129Xe transmitter setting for subsequent scans by 20°/α, assuming that 20° was used as the intended calibration flip angle as recommended in Table 1.
- Fit the peak intensities of the 20 gas-phase FIDs to the following function30 and solve for the flip angle, α:
- Once final 129Xe pre-scan adjustments have been made and the subject is ready for the next 129Xe dose, perform the 129Xe ventilation scan as described below.
- Load the 129Xe ventilation sequence from the prepared protocol. Ensure all pulse sequence parameters are as desired and set the scan execution setting such that the scan will begin immediately following a single click.
- Select FOV size and center location based on the localizer results. Aim for the center of the FOV to coincide with the center of the lungs in all three dimensions and aim for the FOV to be large enough to comfortably contain the entire chest cavity, including the entirety of both lungs.
- Bring the 129Xe dose bag intended for the 129Xe ventilation scan from the polarization measurement station into the scanner room. Hold or place the dose bag at the ready near the subject; avoid regions near the bore opening where the magnetic field strength changes rapidly.
- Assist the subject in inhaling the 129Xe dose from the bag, following the coached inhalation procedure outlined in step 4.
- Execute the scan immediately upon hearing Go! signaled by the individual assisting the subject.
- Monitor the subject while the scan proceeds. If the subject visibly exhales, coughs, moves, etc., repeat the scan if possible.
- As soon as the scan finishes, instruct the subject to exhale and breathe freely.
- Following the scan, monitor the subject's heart rate and SpO2 using the pulse oximeter and monitor for transient central nervous system effects (such as dizziness, light-headedness, euphoria, and paresthesia) via verbal communication with the subject.
- Wait for any deviations from baseline to dissipate before administering another 129Xe dose. If no significant deviations from baseline occur, wait at least 2 min before administering another 129Xe dose.
- Perform 1H anatomical scan as described below.
- Load the 1H anatomical sequence from the prepared protocol. Ensure all pulse sequence parameters are as desired and set the scan execution setting such that the scan can be executed with a single click.
- Bring the dose bag filled with air and matched to the volume of the dose bag used for the 129Xe ventilation scan into the scanner room.
- Assist the subject in inhaling the air dose from the bag, following the coached inhalation procedure outlined in step 4.
- Execute the scan immediately upon hearing Go! signaled by the individual assisting the subject.
- Monitor the subject while the scan proceeds. If the subject visibly exhales, coughs, moves, etc., repeat the scan if possible.
- As soon as the scan finishes, instruct the subject to exhale and breathe freely.
7. Post-scan procedures
- Take measurements of the subject's vitals in the same manner as before the scan procedure. If any vitals become abnormal, instruct the subject to wait 30-60 min and/or until vitals return to near-baseline before departing.
8. Analysis of 129Xe MRI ventilation data
NOTE: The acquired 129Xe ventilation and 1H anatomical images should automatically be reconstructed on the MRI scanner computer using the vendor's default image reconstruction pipeline.
- Export 129Xe ventilation and 1H anatomical scans as DICOM image files using the minimum level of interpolation allowed (ideally none).
- Calculate ventilation defect percentage (VDP) with programming or image-analysis software using the following equation8:

- Determine ventilated volume by segmenting 129Xe ventilation scans, either manually or using one of a number of existing automated approaches33.
NOTE: A simple method for binarized segmentation of 129Xe images uses a threshold defined as follows8:

where "Mean signal" is the mean of the 129Xe signal intensity within a user-defined region-of-interest of strong 129Xe signal within the lungs, and "SD(Noise)" is the standard deviation of the 129Xe signal intensity within a region near the edge of the field-of-view located far from the lungs or trachea. - Determine total lung volume by segmenting 1H anatomical scans, either manually or using existing automated approaches34.
- Once these segmentations are performed, calculate corresponding volumes as the number of segmented voxels times the image voxel volume (accounting for any interpolation performed when converting the images to DICOM files).
- Determine ventilated volume by segmenting 129Xe ventilation scans, either manually or using one of a number of existing automated approaches33.
Results
Figure 1 shows representative ventilation and three-plane localizer images from a healthy individual. High 129Xe signal can be observed throughout the lungs in the ventilation images, and no ventilation impairment is evident in this individual.
Figure 2, Figure 3, and Figure 4 show representative ventilation and anatomical images from diseased individuals. Figure 2 depicts an individual with alpha-1 antitrypsin deficiency, in which severe ventilation impairment can be easily detected by observing the patchy appearance of the 129Xe images. Similarly, severe ventilation impairment can be seen in Figure 3, depicting an individual with severe cystic fibrosis. Figure 4 depicts an individual with chronic obstructive pulmonary disease, in which more subtle ventilation defects can be noted using the 129Xe images.
Figure 5 shows ventilation images from a study that was unknowingly performed using a 129Xe vest coil with a damaged cable. One of the two lungs displays a far lower SNR than the other and an intensity roll, with both of these phenomena particularly prominent in the posterior slices. Figure 6 shows ventilation images from a study that was performed with the 129Xe vest coil placed too far toward the subject's feet. Artificially low 129Xe signal is observed in both lung apices due to the lack of receiver sensitivity there.
Figure 7 shows representative ventilation and anatomical images from an individual with diagnosed COPD, along with binarized ventilation maps calculated using the simple method described in step 8 of the protocol. Widespread ventilation defects are apparent in this individual, including nearly complete loss of ventilation in the upper lobe of the left lung, and the calculated VDP for this individual is 52%. While the analysis procedure appropriately categorizes regions of clearly high or low 129Xe signal, partially ventilated image regions (or regions of partial volume effect, in which a given slice spans both ventilated and nonventilated regions along the slice-select direction) are more difficult to characterize. In this instance, the analysis procedure tends toward characterizing these regions as non-ventilated. This example underscores the utility of analysis procedures that categorize ventilation into more than two categories. Development, testing, and comparison of such analysis procedures is an important ongoing effort in the field of 129Xe MRI30,33.
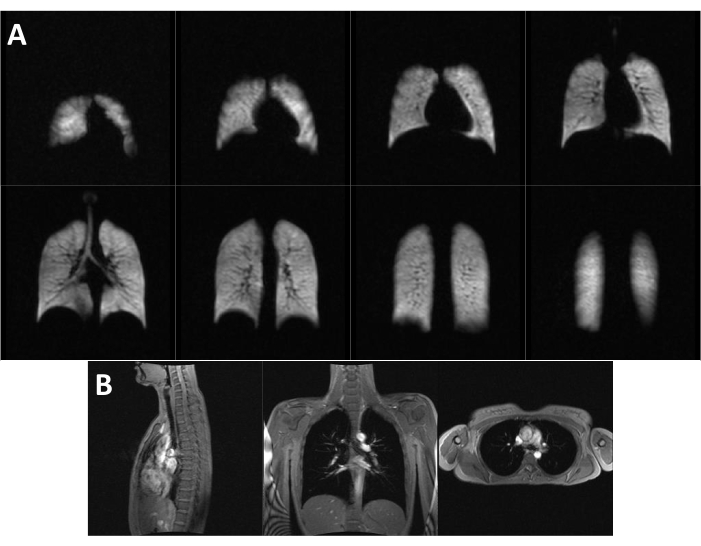
Figure 1: Representative images from a healthy individual. (A) Ventilation and (B) three-plane localizer images from a 22-year-old 117 lb healthy female. No ventilation impairments can be readily detected in this individual. Please click here to view a larger version of this figure.
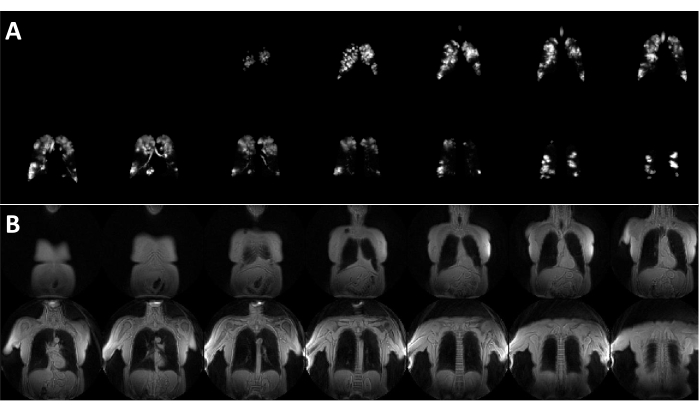
Figure 2: Representative images from an individual with alpha-1 antitrypsin deficiency. (A) Ventilation and (B) anatomical images from a 60-year-old 144 lb female with diagnosed alpha-1 antitrypsin deficiency. Severe ventilation impairments are evident in this individual. Please click here to view a larger version of this figure.
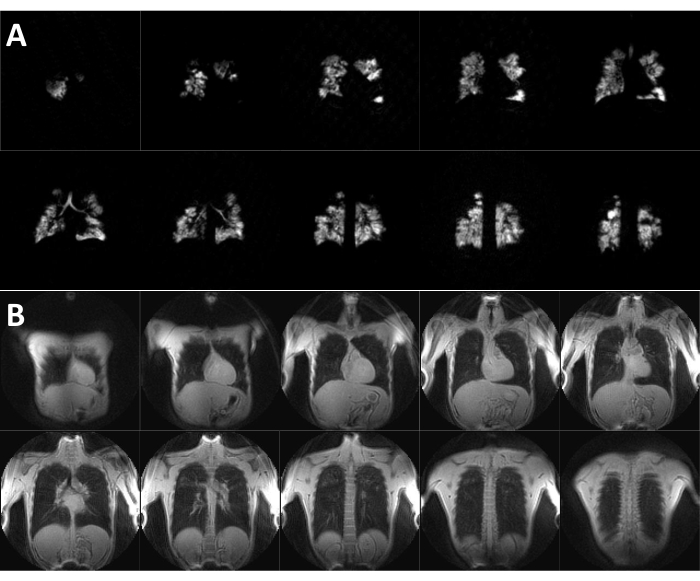
Figure 3: Representative images from an individual with severe cystic fibrosis. (A) Ventilation and (B) anatomical images from an 18-year-old 132 lb male with diagnosed severe cystic fibrosis. Severe ventilation impairments are evident in this individual. Please click here to view a larger version of this figure.

Figure 4: Representative images from an individual with chronic obstructive pulmonary disease. (A) Ventilation and (B) anatomical images from a 56-year-old 110 lb female with diagnosed chronic obstructive pulmonary disease. Mild ventilation defects can be detected in this individual. Please click here to view a larger version of this figure.
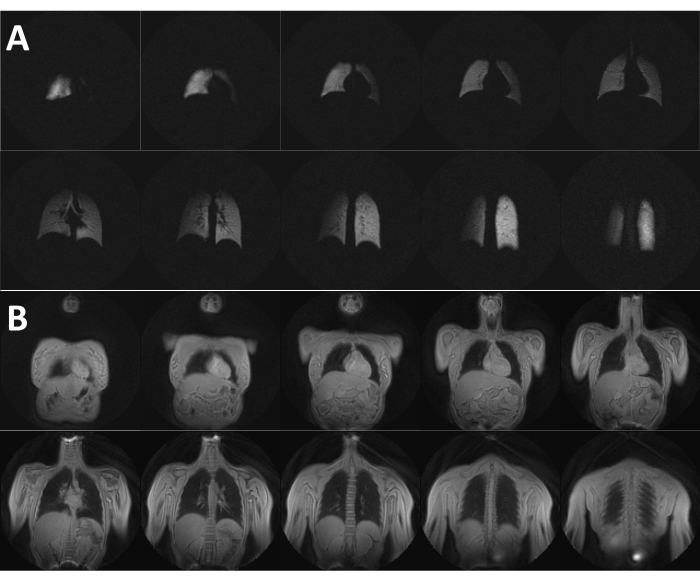
Figure 5: Representative images performed using a defective 129Xe vest coil. (A) Ventilation and (B) anatomical images from a 20-year-old 136 lb female with diagnosed cystic fibrosis from a scan that was unknowingly performed using a 129Xe vest coil with a damaged cable. The right lung (left as the images appear on the page) displays a lower signal-to-noise ratio (SNR) than the left lung (right as the images appear on the page), and the right lung also displays a notable intensity roll, with higher SNR in the anterior slices than in the posterior slices, and higher SNR toward the medial edge of the lung than toward the lateral edge. Please click here to view a larger version of this figure.
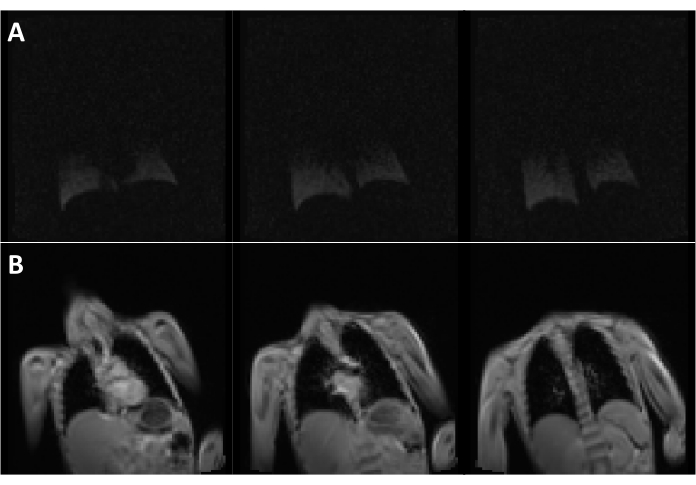
Figure 6: Representative images in which the coil was placed too far in the inferior direction. (A) Ventilation and (B) anatomical images from a 6-year-old 46 lb male with diagnosed mild cystic fibrosis, scanned with the 129Xe vest coil placed too far in the inferior direction. The measured signal in the lung apices is artificially low due to the resulting lack of receiver sensitivity in the lung apices. Please click here to view a larger version of this figure.

Figure 7: Representative ventilation analysis using 129Xe MR images. (A) Anatomical and (B) ventilation images from an 84-year-old 188 lb male with diagnosed chronic obstructive pulmonary disease, with (C) ventilation maps calculated using the simple binarized analysis procedure described in step 8 of the protocol. Ventilated areas of the lung are shown in cyan, while unventilated areas of the lung are shown in magenta. Severe ventilation defects can be detected in this individual, including nearly complete loss of ventilation in the upper lobe of the left lung. Please click here to view a larger version of this figure.
Supplementary File 1: Example MR safety form. This form is used at the University of Virginia to assess subject MR safety. Please click here to download this File.
Discussion
The ventilation and anatomical MRI approaches outlined above are designed to maximize image quality and SNR while maintaining simplicity of implementation - these sequence protocols can in general be adapted from vendor product pulse sequences, provided multinuclear operation is enabled, and images will automatically reconstruct on the scanner computer. One disadvantage of the 2D approaches described here is the use of slice-selective excitation RF pulses, which introduces signal differences between slices collected earlier in the 129Xe ventilation acquisition than later due to T1 relaxation of the inhaled hyperpolarized 129Xe during the scan. Another disadvantage of the procedure described here is that the 129Xe ventilation scan and its corresponding 1H anatomical scan are acquired in different breath holds, possibly introducing variations in lung inflation level or position between ventilation and anatomical scans.
Approaches for 3D ventilation imaging and for single-breath-hold imaging of both 129Xe and 1H have become increasingly common. 3D imaging approaches allow reconstruction of isotropic voxels (as opposed to the non-isotropic voxels with coarser resolution along the slice direction necessitated by slice-selective 2D imaging) and avoid potential T1-driven 129Xe signal variation from one slice to the next35,36. When using Cartesian k-space trajectories, 3D imaging with isotropic resolution requires longer scan times than 2D imaging of the same volume. Therefore, more time-efficient non-Cartesian k-space sampling is often used for 3D imaging. The much greater time efficiency afforded by non-Cartesian sampling can also permit the acquisition of the 129Xe and 1H images in the same breath hold37. These advanced approaches remain more difficult to implement and standardize across sites due to the required pulse sequence programming and advanced reconstruction techniques. However, as vendor support for pulse sequences with non-Cartesian readout becomes available, these more advanced approaches may become commonplace and standardized across sites.
The ventilation analysis procedure presented in step 8 of the protocol is a simple method that can be easily implemented and interpreted, as it returns a binary defect/no-defect answer for each segmented lung voxel and compiles these results into a single VDP number for the scanned individual. While this approach is a reasonable starting point for ventilation analysis, voxel-wise binarization cannot fully characterize ventilation heterogeneity. More complex approaches to ventilation categorization have been developed and tested and are currently in use at some research institutions33. In general, these approaches seek to characterize voxel-wise ventilation beyond simply ventilated and non-ventilated by including other categories, such as hyperventilated and partially ventilated, with an eye toward producing more descriptive and meaningful readouts than binary VDP. Specific categorization methods include linear binning of normalized voxel intensities using histograms4; voxel intensity classification using k-means38, fuzzy c-means39,40, and Gaussian mixture modeling41; and deep convolutional neural networks training on existing hyperpolarized-gas ventilation images33,34. Ventilation quantification using 129Xe MRI remains an area of active development and discussion, with no consensus best-practice method identified as of this writing.
The scope of this protocol is confined to 129Xe ventilation MRI, and to date, this remains the only 129Xe MRI technique approved for clinical use by the FDA. However, an interesting advantage of the 129Xe MRI suite of techniques is its potential for regional characterization of numerous different aspects of pulmonary function. In particular, the recent position paper30 from the Xe MRI CTC provides current recommended practices for imaging of pulmonary gas exchange using dissolved-phase 129Xe MRI and quantification of alveolar-airspace size using 129Xe diffusion MRI. These protocols generally cannot be adapted from vendor-supplied protocols and, therefore, require significant pulse sequence programming. Once pulse sequences are developed, the associated protocols can be readily integrated into the workflow for 129Xe ventilation MRI described here, as best practices for xenon polarization, xenon dosing, and subject safety monitoring are common across the various 129Xe MRI methods. When numerous 129Xe MRI scan types are expected to be performed in a single subject, it is advisable to perform 129Xe scans that represent the primary study endpoint first after performing 129Xe calibration, in case the resulting images are not acceptable, and the primary endpoint scan must be repeated using a 129Xe dose that was originally intended for a subsequent secondary-endpoint scan.
The protocol described here is intended for imaging of adults and older adolescents, and 129Xe ventilation MRI is currently only approved for clinical use by the FDA in individuals aged at least 12 years. However, 129Xe MRI is of increasing interest as a tool for pediatric pulmonary disease research17,22,42,43, and FDA approval for 129Xe MRI in pediatric populations will be sought in short order. Difficulty maintaining breath-hold and/or executing breathing instructions is more likely in pediatric subjects, and thus, pre-scan coaching is especially important. The test bag practice procedure described in step 4 of the protocol also assumes a more crucial role, as it can help decide whether to proceed to 129Xe imaging. Additionally, protocols for pediatric 129Xe MRI should strive to shorten scan times (and thus breath-hold times) where possible. Smaller lungs in pediatric subjects may necessitate different 129Xe dosing considerations and resolution and/or FOV settings than those used for older individuals.
Disclosures
Authors J.F.M., J.P.M., and Y.M.S. participate in clinical trials supported by Polarean, Inc. Authors J.F.M., and Y.M.S. provide consulting services to Polarean, Inc. (less than $5000). Author J.P.M. receives research support from Polarean, Inc.
Acknowledgements
This work was funded by the National Institutes of Health (grant numbers R01-CA172595-01, R01-HL132177, R01-HL167202, S10-OD018079, and UL1-TR003015) and by Siemens Medical Solutions.
Materials
| Name | Company | Catalog Number | Comments |
|---|---|---|---|
| 1.5T or 3T human MRI scanner | Siemens | MAGNETOM Symphony (1.5T) or Vida (3T); older models fine, as long as multinuclear option is/can be installed; scanners also available from GE and Philips | |
| 129Xe hyperpolarizer | Polarean | 9820 | |
| 129Xe MRI phantom | |||
| 129Xe MRI vest coil | Clinical MR Solutions | Also available from other vendors | |
| 129Xe polarization measurement station | Polarean | 2881 | |
| 1H MRI phantom | |||
| Coil file for 129Xe MRI vest coil | Also available from other vendors for their respective coils | ||
| ECG machine | |||
| Helium buffer gas | |||
| Interface box from coil to scanner | May be built into coil, but needs to be included separately if not | ||
| Liquid nitrogen | |||
| MRI-safe pulse oximeter | Philips | Expression MR200 | |
| Nitrogen buffer gas | |||
| PFT machine | |||
| Programming/image analysis software | MATLAB | R2023a | Various other options available |
| Pulse sequence design software | Siemens | IDEA software package; also available from GE and Philips for their respective scanners | |
| Scanner multinuclear option | Siemens | Scanner integrated hardware/software package; also available from GE and Philips for their respective scanners | |
| Tedlar gas sampling bags (500, 750, 1000, 1250, 1500 mL) | |||
| Xenon gas (129Xe isotopically enriched) |
References
- Roos, J. E., McAdams, H. P., Kaushik, S. S., Driehuys, B. Hyperpolarized gas MRI: Technique and applications. Magn Reson Imaging Clin N Am. 23 (2), 217-229 (2015).
- Mugler, J. P., Altes, T. A. Hyperpolarized 129Xe MRI of the human lung. J Magn Reson Imaging. 37 (2), 313-331 (2013).
- Ebner, L., et al. The role of hyperpolarized 129xenon in MR imaging of pulmonary function. Eur J Radiol. 86, 343-352 (2017).
- He, M., Driehuys, B., Que, L. G., Huang, Y. C. T. Using hyperpolarized 129Xe MRI to quantify the pulmonary ventilation distribution. Acad Radiol. 23 (12), 1521-1531 (2016).
- Walkup, L. L., et al. Xenon-129 MRI detects ventilation deficits in paediatric stem cell transplant patients unable to perform spirometry. Eur Respir J. 53 (5), 1801779(2019).
- Virgincar, R. S., et al. Quantitative analysis of hyperpolarized 129Xe ventilation imaging in healthy volunteers and subjects with chronic obstructive pulmonary disease. NMR Biomed. 26 (4), 424-435 (2013).
- Ebner, L., et al. Hyperpolarized 129Xenon magnetic resonance imaging to quantify regional ventilation differences in mild to moderate Asthma: A prospective comparison between semiautomated ventilation defect percentage calculation and pulmonary function tests. Invest Radiol. 52 (2), 120-127 (2017).
- Woodhouse, N., et al. Combined helium-3/proton magnetic resonance imaging measurement of ventilated lung volumes in smokers compared to never-smokers. J Magn Reson Imaging. 21 (4), 365-369 (2005).
- Mugler, J. P., et al. Simultaneous magnetic resonance imaging of ventilation distribution and gas uptake in the human lung using hyperpolarized xenon-129. Proc Natl Acad Sci U S A. 107 (50), 21707-21712 (2010).
- Qing, K., et al. Assessment of lung function in asthma and COPD using hyperpolarized 129Xe chemical shift saturation recovery spectroscopy and dissolved-phase MRI. NMR Biomed. 27 (12), 1490-1501 (2014).
- Cleveland, Z. I., et al. Hyperpolarized 129Xe MR imaging of alveolar gas uptake in humans. PLoS One. 5 (8), 12192(2010).
- Wang, Z., et al. Using hyperpolarized 129Xe gas-exchange MRI to model the regional airspace, membrane, and capillary contributions to diffusing capacity. J Appl Physiol. 130 (5), 1398-1409 (2021).
- Guan, S., et al. 3D single-breath chemical shift imaging hyperpolarized Xe-129 MRI of healthy, CF, IPF, and COPD subjects. Tomography. 8 (5), 2574-2587 (2022).
- Ouriadov, A., et al. Lung morphometry using hyperpolarized (129) Xe apparent diffusion coefficient anisotropy in chronic obstructive pulmonary disease. Magn Reson Med. 70 (129), 1699-1706 (2013).
- Yablonskiy, D. A., Sukstanskii, A. L., Quirk, J. D., Woods, J. C., Conradi, M. S. Probing lung microstructure with hyperpolarized noble gas diffusion MRI: theoretical models and experimental results. Magn Reson Med. 71 (2), 486-505 (2014).
- Chan, H. F., Stewart, N. J., Norquay, G., Collier, G. J., Wild, J. M. 3D diffusion-weighted 129 Xe MRI for whole lung morphometry. Magn Reson Med. 79 (6), 2986-2995 (2018).
- Walkup, L. L., et al. tolerability and safety of pediatric hyperpolarized 129Xe magnetic resonance imaging in healthy volunteers and children with cystic fibrosis. Pediatr Radiol. 46 (12), 1651-1662 (2016).
- Driehuys, B., et al. Chronic obstructive pulmonary disease: safety and tolerability of hyperpolarized 129Xe MR imaging in healthy volunteers and patients. Radiology. 262 (1), 279-289 (2012).
- Myc, L., et al. Characterisation of gas exchange in COPD with dissolved-phase hyperpolarised xenon-129 MRI. Thorax. 76 (2), 178-181 (2021).
- Kaushik, S. S., et al. Measuring diffusion limitation with a perfusion-limited gas-Hyperpolarized 129Xe gas-transfer spectroscopy in patients with idiopathic pulmonary fibrosis. J Appl Physiol. 117 (6), 577-585 (2014).
- Dournes, G., et al. The clinical use of lung MRI in cystic fibrosis: What, now, how. Chest. 159 (6), 2205-2217 (2021).
- Thomen, R. P., et al. Hyperpolarized 129Xe for investigation of mild cystic fibrosis lung disease in pediatric patients. J Cyst Fibros. 16 (2), 275-282 (2017).
- Mammarappallil, J. G., Rankine, L., Wild, J. M., Driehuys, B. New developments in imaging idiopathic pulmonary fibrosis with hyperpolarized xenon magnetic resonance imaging. J Thorac Imaging. 34 (2), 136-150 (2019).
- Rankine, L. J., et al. 129Xenon gas exchange magnetic resonance imaging as a potential prognostic marker for progression of idiopathic pulmonary fibrosis. Ann Am Thorac. 17 (1), 121-125 (2020).
- Mata, J., et al. Evaluation of regional lung function in pulmonary fibrosis with xenon-129 MRI. Tomography. 7 (3), 452-465 (2021).
- Svenningsen, S., et al. Hyperpolarized (3) He and (129) Xe MRI: Differences in asthma before bronchodilation. J Magn Reson Imaging. 38 (3), 1521-1530 (2013).
- Stewart, N. J., et al. Comparison of 3He and 129Xe MRI for evaluation of lung microstructure and ventilation at 1.5T. J Magn Reson Imaging. 48 (3), 632-642 (2018).
- Hughes, P. J. C., et al. Assessment of the influence of lung inflation state on the quantitative parameters derived from hyperpolarized gas lung ventilation MRI in healthy volunteers. J Appl Physiol. 126 (1), 183-192 (2019).
- Polarean. FDA Approves Polarean's XENOVIEWTM (xenon Xe 129 hyperpolarized) for use with MRI for the evaluation of lung ventilation. , Polarean. (2022).
- Niedbalski, P. J., et al. Protocols for multi-site trials using hyperpolarized 129Xe MRI for imaging of ventilation, alveolar-airspace size, and gas exchange: A position paper from the 129Xe MRI clinical trials consortium. Magn Reson Med. 86 (6), 2966-2986 (2021).
- Bier, E. A., et al. A thermally polarized 129 Xe phantom for quality assurance in multi-center hyperpolarized gas MRI studies. Magn Reson Med. 82 (5), 1961-1968 (2019).
- He, M., et al. Dose and pulse sequence considerations for hyperpolarized 129Xe ventilation MRI. Magn Reson Imaging. 33 (7), 877-885 (2015).
- Tustison, N. J., et al. Image- versus histogram-based considerations in semantic segmentation of pulmonary hyperpolarized gas images. Magn Reson Med. 86 (5), 2822-2836 (2021).
- Tustison, N. J., et al. Convolutional neural networks with template-based data augmentation for functional lung image quantification. Acad Radiol. 26 (3), 412-423 (2019).
- Wild, J. M., et al. Comparison between 2D and 3D gradient-echo sequences for MRI of human lung ventilation with hyperpolarized 3He. Magn Reson Med. 52 (3), 673-678 (2004).
- Willmering, M. M., et al. Improved pulmonary 129 Xe ventilation imaging via 3D-spiral UTE MRI. Magn Reson Med. 84 (1), 312-320 (2020).
- Collier, G. J., et al. Single breath-held acquisition of coregistered 3D 129 Xe lung ventilation and anatomical proton images of the human lung with compressed sensing. Magn Reson Med. 82 (1), 342-347 (2019).
- Zha, W., et al. Semiautomated ventilation defect quantification in exercise-induced bronchoconstriction using hyperpolarized helium-3 magnetic resonance imaging: a repeatability study. Acad Radiol. 23 (9), 1104-1114 (2016).
- Ray, N., Acton, S. T., Altes, T. A., de Lange, E. E., Brookeman, J. R. Merging parametric active contours within homogeneous image regions for MRI-based lung segmentation. IEEE Trans Med Imaging. 22 (2), 189-199 (2003).
- Hughes, P. J. C., et al. Spatial fuzzy c-means thresholding for semiautomated calculation of percentage lung ventilated volume from hyperpolarized gas and 1 H MRI. J Magn Reson Imaging. 47 (3), 640-646 (2018).
- Tustison, N. J., et al. Ventilation-based segmentation of the lungs using hyperpolarized (3)He MRI. J Magn Reson Imaging. 34 (3), 831-841 (2011).
- Kanhere, N., et al. Correlation of lung clearance index with hyperpolarized 129Xe magnetic resonance imaging in pediatric subjects with cystic fibrosis. Am J Respir Crit Care Med. 196 (8), 1073-1075 (2017).
- Rayment, J. H., et al. Hyperpolarised 129Xe magnetic resonance imaging to monitor treatment response in children with cystic fibrosis. Eur Respir J. 53 (5), 1802188(2019).
Reprints and Permissions
