Here, we present an assembloid model system to mimic tendon cellular crosstalk between the load-bearing tendon core tissue and an extrinsic compartment containing cell populations activated by disease and injury. As an important use case, we demonstrate how the system can be deployed to probe disease-relevant activation of extrinsic endothelial cells.
Method Article
Engineering Tendon Assembloids to Probe Cellular Crosstalk in Disease and Repair
In This Article
Summary
Abstract
Tendons enable locomotion by transferring muscle forces to bones. They rely on a tough tendon core comprising collagen fibers and stromal cell populations. This load-bearing core is encompassed, nourished, and repaired by a synovial-like tissue layer comprising the extrinsic tendon compartment. Despite this sophisticated design, tendon injuries are common, and clinical treatment still relies on physiotherapy and surgery. The limitations of available experimental model systems have slowed the development of novel disease-modifying treatments and relapse-preventing clinical regimes.
In vivo human studies are limited to comparing healthy tendons to end-stage diseased or ruptured tissues sampled during repair surgery and do not allow the longitudinal study of the underlying tendon disease. In vivo animal models also present important limits regarding opaque physiological complexity, the ethical burden on the animals, and large economic costs associated with their use. Further, in vivo animal models are poorly suited to systematic probing of drugs and multicellular, multi-tissue interaction pathways. Simpler in vitro model systems have also fallen short. One major reason is a failure to adequately replicate the three-dimensional mechanical loading necessary to meaningfully study tendon cells and their function.
The new 3D model system presented here alleviates some of these issues by exploiting murine tail tendon core explants. Importantly, these explants are easily accessible in large numbers from a single mouse, retain 3D in situ loading patterns at the cellular level, and feature an in vivo-like extracellular matrix. In this protocol, step-by-step instructions are given on how to augment tendon core explants with collagen hydrogels laden with muscle-derived endothelial cells, tendon-derived fibroblasts, and bone marrow-derived macrophages to substitute disease- and injury-activated cell populations within the extrinsic tendon compartment. It is demonstrated how the resulting tendon assembloids can be challenged mechanically or through defined microenvironmental stimuli to investigate emerging multicellular crosstalk during disease and injury.
Introduction
In their function of transferring muscle forces to the bones to enable movement, tendons face some of the most extreme mechanical stresses occurring in the human body1,2,3. Due to aging societies, increasing obesity prevalence, and the growing popularity of mechanically demanding sports activities, the prevalence of tendon diseases and injuries is projected to climb in developed countries4,5,6. The development of novel evidence-based and disease-modifying treatment regimens to combat this increase has been hindered by limitations of currently available model systems1,7,8.
Ideally, disease and injury repair models would allow studying how the target organ processes a defined set of input parameters (imitating disease triggers, Table 1) into measurable output parameters (representing disease hallmarks, Table 2) while controlling for confounding factors. Studies using such model systems would then be able to identify the (patho-) physiological processes underlying disease and injury repair and gain knowledge that could be exploited to prevent or reduce disease and injury hallmarks in the clinics. Applying this principle to tendons, a useful model system should recapitulate central parts of the in vivo tendon response to disease and injury, which encompass the following hallmarks: microdamage, inflammation, neovascularization, hypercellularity, accelerated matrix turnover, and decompartmentalization9,10,11,12,13,14,15. Using these hallmarks as a base, the following requirements for a successful tendon disease and injury repair model system can be inferred.
Mechanical overloading is hypothesized to be a central factor in tendon injury and disease pathogenesis and is thus a commonly used experimental approach to create microdamage16. Controllable mechanical loadability is, therefore, a prime prerequisite for tendon disease and injury repair models. Ideally, the model system enables three main modes: single stretch-to-damage loading, fatigue loading, and unloading8,17,18. Upon mechanical deformation, tissue-resident cells experience a complex combination of tensional forces, shear forces (due to the sliding of collagen fibers surrounding the cells), and compression forces occurring during unloading or near the enthesis19,20. Model systems should recreate these complex loading patterns as closely as possible.
An alternative way to introduce matrix microdamage is to leverage biochemical stressors that mimic systemic predispositions for tendon disease and injury, such as (pro-)inflammatory cytokines, oxidative stress, or high glucose concentrations21,22,23. Consequently, a controllable niche microenvironment is advantageous for a tendon disease and injury repair model system.
A common prerequisite for model systems to be able to recapitulate inflammation, neovascularization, and hypercellularity is the selective presence of cell populations that drive these processes24. For inflammatory processes, these populations include neutrophils, T-cells, and macrophages, while endothelial cells and pericytes would be needed to study neovascularization25,26,27,28,29. Tendon fibroblasts are not only vital for tendon repair but, as proliferative and migrating cells, also partially responsible for the local hypercellularity observed in tendon disease30,31,32,33,34,35,36.
Besides changes in resident cell populations, the tendon matrix composition is altered in tendon disease and injury as well7,37,38,39,40. To present the right disease-relevant microenvironmental cues, model systems should be able to integrate an extracellular matrix composition matched to the targeted disease or injury stage, for example, by enabling relevant proportional combinations of collagen-1, collagen-3, and cellular fibronectin41.
The compartmentalization of healthy tendons into the tendon core and the extrinsic compartments (i.e., endotenon, epitenon, and paratenon) is central to their function and often disturbed in diseased or injured tendons1,42,43,44,45,46,47. Incorporating 3D tendon compartmentalization into tendon model systems is therefore not only required to simulate the processes underlying de- and re-compartmentalization more closely but also helps to establish the correct spatiotemporal gradients of cytokines and nutrients48,49.
Finally, modularity is another central asset of model systems, allowing researchers to combine the correct relative contribution of and interplay between the previously described stressors during the investigated processes8,17.
Besides selecting the optimal input modalities, an important step is being able to measure, observe, and track changes in the resulting output. The mechanical properties of the model system (i.e., toe region length, linear elastic modulus, maximum tensile strain, maximum tensile stress, fatigue strength, and stress relaxation) are central here, as they characterize the tendon's main function50,51,52. To link these functional changes to tissue-level changes, it is important to enable methods detecting (collagen) structural matrix damage and tracking proliferation and recruitment of disease- and repair-relevant cell populations30,53,54,55,56,57,58,59,60.
To study emerging cell-cell and cell-matrix crosstalk, one should be able to isolate or mark proteins in adequate amounts for quantification (i.e., ELISA, proteomics, immunohistochemistry, flow cytometry)14,21,61,62. Population- or at least compartment-specific gene expression analysis should be possible as well (i.e., fluorescence-activated cell sorting [FACS], single-cell/bulk RNA- sequencing, and real-time quantitative polymerase chain reaction (RT-qPCR))21,24,27,63. The model system should allow measuring as many of the aforementioned output parameters on the same specimen and on multiple specimens in a manner fast enough to unlock high-throughput studies.
Among model systems currently available to study human tendon disease and injury repair, the human body itself is, of course, the most representative one. It is also the least compatible with experimental intervention. While patients with acute tendon injuries are abundantly available for clinical studies, patients with early tendinopathy (the most common tendon disease) are largely symptom-free and often go clinically undetected until more severe changes manifest14,64,65. This makes it hard to pinpoint the critical moment when tendon homeostasis derails and the mechanisms behind this derailment16,66,67,68,69. In addition, extracting biopsies from healthy tendons is ethically challenging, as it may result in persisting damage. Hamstring tendon remnants from anterior cruciate ligament reconstruction surgery are often used as healthy controls but arguably differ in function, mechanical properties, cell populations, and matrix composition compared to the rotator cuff, Achilles, and patellar tendons commonly affected by tendon disease and injury70,71,72,73.
In vivo animal models are more accessible and tractable, but their usage imposes a significant ethical burden on the animals and economic cost on the researchers. In addition, most of the popular model animals either do not develop tendinopathic lesions spontaneously (i.e., rats, mice, rabbits) or lack the primers and genetically modified strains necessary to track the multicellular communication pathways involved in it (i.e., horses, rabbits).
Simple 2D in vitro model systems are on the other side of the complexity/tractability spectrum and better allow controlled, time-efficient study of specific intercellular communication pathways in response to a more controllable set of triggers8,74. However, these simplified systems commonly fail to recapitulate the multi-dimensional mechanical loading (i.e., tension, compression, and shear) that is central to tendon functionality. In addition, the (too) high stiffnesses of tissue culture plastic tend to override any matrix cues provided by coatings intended to mimic the disease state of interest75,76.
To overcome this drawback, increasingly sophisticated tissue-engineered 3D model systems have been developed to provide a loadable matrix whose composition can at least be partially matched to the desired disease state77,78,79. Still, these systems not only struggle to accurately replicate the complex in vivo extracellular matrix compositions and cellular loading patterns but generally lack long-term loadability and the compartmental interfaces required to study the cross-compartmental communication pathways that coordinate tendon disease and injury repair48,49,80.
Ex vivo tendon explant model systems have the distinct advantage of a built-in in vivo-like matrix composition that comprises pericellular niches, cross-compartmental barriers, as well as spatiotemporal cytokine/nutrient gradients and recapitulates complex loading patterns when stretched8. As a result of size-dependent nutrient diffusion limits, explants from larger animal models (i.e., horses) are difficult to keep alive for the long-term study of tendon disease and injury repair81,82,83. Meanwhile, smaller explants from murine species (i.e., Achilles tendon, patellar tendon) are challenging to reproducibly clamp and mechanically load. Their size also constrains the amount of material that can be gathered for cell-, protein-, and gene-level readouts without pooling samples and decreasing throughput. In this sense, murine tail tendon fascicles offer the potential to unlock high-throughput study of tendon disease and injury repair as they are readily available in large quantities from a single mouse, preserve the complex in vivo pericellular matrix composition, and recapitulate cellular loading patterns. During the extraction process, however, they lose most of their extrinsic compartment and the therein contained vascular, immune, and fibroblast populations that are now considered to drive tendon disease and repair8,18.
To bridge this gap, a model system combining the advantages of murine tail tendon-derived core explants with the advantages of 3D hydrogel-based model systems has been developed. This model system consists of a cell-laden (collagen-1) hydrogel cast around tail tendon explants84,85. In this paper, the necessary manufacturing steps are provided in detail alongside useful readouts that can be obtained by co-culturing core explants (intrinsic compartment) within an endothelial cell-laden type-1 collagen hydrogel (extrinsic compartment).
Protocol
All methods described here were approved by the responsible authorities (Canton Zurich license numbers ZH104-18 and ZH058-21). An overview is presented in Figure 1.
1. Isolation of tendon assembloid components from 12-15 week-old mice (i.e., B6/J-Rj)
- Euthanize the mice through CO2 gas-induced asphyxiation. To maximize the yield, do not process more than 3 mice at a time and proceed with the cell isolation immediately after euthanasia.
- Ensure death by bilateral induction of pneumothorax.
- Sterilize the mouse skin with 80% ethanol and move the mouse to a sterile biosafety hood.
- Isolate tail tendon core explants.
- Use a scalpel (No. 21) to separate the tail from the mouse by cutting it at its base.
- Starting at the tip of the tail, grip it with the tweezers and wiggle it to break the skin. Then, gently pull the tweezers away from the tail to expose the tendon core explants.
- Place the tendon core explants into the standard culture medium (DMEM/F12 + 10% FBS + 1% penicillin/streptomycin + 1% amphotericin + 1% non-essential amino acids) and separate them from the pulled-away tail part using a fresh scalpel blade (No. 21).
- Repeat steps 1.4.2. and 1.4.3. until the whole tail is processed and the tendon explants become shorter than 25 mm.
- Cut the isolated core explants into 25 mm long pieces using a fresh scalpel blade (No. 21).
- Measure the mean diameter of the core explants with a light microscope connected to an image analysis software via an attachable digital C-mount camera.
- Use point and click to select the line measurement tool on the right side.
- Measure the explant diameter at three different locations and calculate their mean diameter.
- To facilitate clamping and mechanical testing later, proceed only with core explants having a mean diameter greater than 100 µm.
- The unloading combined with the exposition to standard culture conditions (37 °C, 20% O2, serum supplementation) changes gene expression within 6 h after isolation and results in degradation within 7 days21. To begin with a quasi-homeostatic state, produce the tendon assembloids and start the experiments immediately after the tendon core isolation.
- Depending on the experimental setup, devitalized tendon core explants are required as a control group. To devitalize tendon core explants, freeze them in a small container filled with liquid nitrogen for 5 s using tweezers and then thaw them for 5 s at room temperature (RT). Repeat this freeze-thaw cycle 3 times and proceed with step 4 ("Clamping the core explants").
CAUTION: Liquid nitrogen can cause cold burns, asphyxiation, and embrittles many ordinary materials. Only use containers designed for low-temperature liquids and wear protective clothing (i.e., face shield, appropriate gloves, closed-top shoes).
- Isolate tendon fibroblasts.
- Use a scalpel (No. 21) to make a transversal incision in the middle of the mouse's foot. Make two cuts perpendicular to the foot along the sides of the hindlegs and up to the hips from each end of this incision.
- Use the tweezers to fixate the cut-out skin flap at the foot and peel away the skin covering the calf muscles. When isolating endothelial cells from the same mouse, remove all the skin instead.
- Separate the Achilles tendon from the calcaneus bone with a fresh scalpel blade (No. 21). Fixate the loose end of the Achilles tendon with the tweezers and separate the other end from the gastrocnemius muscle.
- Wash the Achilles tendon once in PBS and use the scalpel (No. 21) to remove all remaining muscle tissue until only the white tendon tissue remains. If endothelial cells are isolated from the same mouse, leave the Achilles tendon in PBS and continue with step 1.6. first.
- Pool the Achilles tendons from one animal into a 15 mL plastic tube containing 10 mL of tendon digestion medium (DMEM/F12 + 1% penicillin/streptomycin + 1% amphotericin + 2 mg/mL collagenase 1) and digest for 6-8 h at 37 °C under slow, constant agitation using a low-speed orbital shaker at 15 rpm.
- Centrifuge the digested tendon solution at 500 x g for 5 min at RT, aspirate the supernatant, and resuspend in 8 mL of standard culture medium (DMEM/F12 + 10% FBS + 1% penicillin/streptomycin + 1% amphotericin + 1% non-essential amino acids), and culture in a T25 culture flask under standard culture conditions (37 °C, 20 % O2) for 7 days without media change. After that, change the media once per week.
- Split the cells at 80% confluency into a T150 culture flask (1:6). Freeze the cells at passage 2 in 2 mL of sterile filtered freezing medium (70% DMEM/F12 + 20% FBS + 10% DMSO) distributed to two 1.5 mL cryotubes and keep them at -80 °C until further usage. Use trypsin to remove the cells from the tissue culture plastic.
- Isolate muscle-derived endothelial cells.
- If tendon fibroblasts are not isolated from the same mouse, start with steps 1.5.1 and 1.5.2.
- Use scissors to separate the hindlegs from the body by cutting at the hip joint.
- Wash the hindlegs once in cold PBS (~ 4 °C), remove the muscles (quadriceps femoris, extensor digitorum longus, soleus, and gastrocnemius) with a scalpel (No. 21), and place the muscles into a Petri dish on ice.
- Use a fresh scalpel blade (No. 21) to mince the muscle tissue into pieces smaller than 1 mm3 while keeping the Petri dish on ice.
- Pool the minced muscle tissue from both hindlegs into a 50 mL plastic tube containing 12.5 mL of muscle digestion medium (PBS + 2 mg/mL collagenase IV + 2 mg/mL dispase II + 2 mM CaCl2).
- Place the plastic tube into a 37 °C water bath for 10 min. Vigorously shake the solution and place it back for another 10 min. Repeat until the solution appears to be homogenous and only (white) pieces of tendon and fascia remain (ca. 4 x 10 min). Meanwhile, continue with the tendon fibroblast isolation or the macrophage isolation.
- Add 12.5 mL of cold PBS + 10% FBS to the plastic tube to stop the digestion.
- Use a battery-driven pipette holder equipped with a 50 mL pipette to aspirate the suspension from the plastic tube. Equip the plastic tube with a 400 µm cell strainer and filter the suspension to remove debris. Repeat the process with a 100 µm cell strainer.
- Centrifuge the filtered suspension at 400 x g for 5 min at RT. Resuspend in 10 mL of cold PBS + 10% FBS and centrifuge again.
- Resuspend in 8 mL of endothelial culture medium (1:1 mixture of DMEM/F12 and the endopan 3 kit + 10 U/mL heparin + 20% FBS + 1% penicillin/streptomycin + 1% amphotericin + 30 mg/mL endothelial growth supplement) supplemented with puromycin (4 mg/mL) for population selection.
- Seed the cells from one mouse into one T25 culture flask that was previously coated with 2 mL of a sterile 0.2% gelatin solution for 2 h at 37 °C and then dried overnight at RT after removing the excess solution. Prepare the flasks the day before the isolation.
- After 24 h in standard culture conditions (37 °C, 20% O2), remove the puromycin-supplement medium, wash the attached cells once with PBS, and culture them in 8 mL of endothelial culture medium.
- Passage the cells 1:5 at 80% confluency into gelatin-coated flasks and use them in experiments until P2. Use a cell detachment solution other than trypsin (Table of Materials) to remove the cells from the tissue culture plastic and do not freeze them.
- Isolate bone marrow-derived macrophages.
- If tendon fibroblasts or endothelial cells are not isolated from the same mouse, perform steps 1.5.1, 1.5.2, 1.6.2, and 1.6.3 first.
- After removing the skin, the tendon, and the muscle tissues, wash the leftover bones (femur and tibia) once in cold PBS (~4 °C).
- Place the bones in fresh cold PBS (~4 °C) and use a scalpel (No. 21) to gradually cut away the epiphyses until the bone marrow is exposed. It appears as a red dot on both sides of the bone.
- Equip a syringe with a 0.4 mm x 25 mm (G27) injection needle and fill it with 10 mL of macrophage culture medium (DMEM/F12 + 10% FBS + 1% penicillin/streptomycin + 1% amphotericin + 1% non-essential amino acids).
- Hold one bone after another over a 50 mL plastic tube, insert the injection needle about 1 mm deep into the exposed bone marrow on the top, and flush out the bone marrow by emptying the syringe. The flushed-out bone marrow appears as a reddish tube-like structure when suspended in the medium.
- Dissolve the bone marrow by gently pipetting it up and down repeatedly using a 1 mL pipette tip. Use a battery-driven pipette holder equipped with a 50 mL pipette to filter the cell suspension through a 100 µm cell strainer back into the 50 mL plastic tube and centrifuge it at 350 x g for 5 min at RT.
- Remove the supernatant, resuspend the pellet in 10 mL red blood cell (RBC) lysis buffer, and centrifuge again at 350 x g for 10 min at room temperature.
- Resuspend the pellet in 5 mL of macrophage culture medium (DMEM/F12 + 10% FBS + 1% penicillin/streptomycin + 1% amphotericin + 1% non-essential amino acids) and seed it into untreated Petri dishes with a 100 mm diameter (5-8 x 10⁶ cells per dish).
- After 4 h, add 5 mL of macrophage culture medium supplemented with 40 ng/mL macrophage colony-stimulating factor (m-CSF) to the cell culture medium without m-CSF (1:1 mixture) to get to a final concentration of 20 ng/mL m-CSF.
- After 6 days, use the cells in experiments or freeze them until further usage. Use a cell detachment solution other than trypsin (Table of Materials) to remove the cells from the tissue culture plastic.
NOTE: Once isolated, the cells no longer expand. The cell isolation methods described here also work with mice and rats outside the indicated age range.
- To verify the phenotype of the isolated cell populations with flow cytometry, continue with step 6.3.4.
2. Collagen isolation from Wistar or Sprague-Dawley rats
- Follow the isolation protocol described in detail elsewhere86. It also works with mice, albeit with a much lower yield.
- Determine the concentration of the resulting solution with a hydroxyproline assay, assess the purity with SDS-page, and store the solution at 4 °C until usage in the experiments.
3. Production of the culture system components
- 3D-print the clamp holders, the mounting station, and the chamber molds.
- Load the attached .stl file (Supplementary File 1) for the clamp holders, the mounting station, and the chamber molds into the slicing software. To adapt the object numbers as required, use point and click to select objects and copy-and-paste to multiply them.
- Press Export G-code (Ctrl-R) to generate the G-code and then export it (Ctrl-G).
- Load the G-code into a 3D printer.
- Use uncolored, biocompatible filaments for the printing process (i.e., polylactic acid).
- Cut 3 mm threads into the holes of the clamp holder that will carry the screws using a thread cutter (Supplementary File 2 and Supplementary File 3, holes 1 and 3).
- Put stainless steel dowel pins into the hole at the back of the clamp holder (Supplementary File 2 and Supplementary File 3, hole 4).
- Sterilize the clamp holders and the mounting station with UV light for at least 1 h prior to usage. Do not reuse 3D-printed clamp holders.
- Alternatively, produce the clamps holders and the mounting station with polyetherimide using the attached plans (Supplementary File 2, Supplementary File 3, and Supplementary File 4), which is more expensive but enables better sterilization methods (i.e., autoclaving) and repeated usage.
- Cast the chambers using the 3D-printed molds.
- Fill the chamber molds with silicone.
- Degas the silicone in a vacuum chamber (90 mbar) for 30 min.
- Let the solution polymerize at RT overnight or on a hotplate at 70 °C for 1 h, depending on the heat resistance of the filaments used for the molds.
- Carefully remove the polymerized chambers from the molds and cut away superfluous silicone with a scalpel (No. 21).
- OPTIONAL: If the assembloids and, thus, the surrounding chambers are to be mechanically loaded, reinforce the holes in the silicone chambers with hollow tubes made from stainless steel.
- Machine the metal clamps from stainless steel using the attached plan (Supplementary File 5).
- Before each usage, wash the stainless-steel clamps, the polyetherimide clamp holders, the screws, and the silicone chamber.
- Sonicate for 10 min in 80% ethanol (EtOH) and 20% reverse osmosis water (ROW).
- Sonicate for 10 min in 50% EtOH and 50% Isopropanol.
- Rinse 3x with ROW.
- Sonicate for 10 min in 0.5% alkaline cleaning concentrate (i.e., 3 mL in 600 mL of ROW).
- Sonicate for 10 min in 0.5% alkaline cleaning concentrate.
- Leave in 0.5% alkaline cleaning concentrate while shaking for 1 h 50 min.
- Rinse 3x with ROW.
- Sonicate for 10 min in ROW.
- Airdry the components and autoclave them.
4. Clamping the core explants
- Place matching clamp holders together with one metal clamp each into the mounting station.
- Place wet autoclaved paper pieces (4 mm x 25 mm) on top of the metal clamps and then cut the paper along the inner borders of the clamps with a scalpel (No. 21). Cut away 2 additional, smaller paper pieces (4 mm x 1.5 mm) from another paper piece and keep them wet.
- Using pointed tweezers, place 8 core explants on the paper between the metal clamps with their endpoints on the metal clamps.
- Cover the endpoints of the core explants with the readied smaller paper pieces (4 mm x 1.5 mm) and then put metal clamps on top of them. Use a screwdriver and the small screws (M3 x 6 mm) to fixate the core explants between the metal clamps and the clamp holder.
- Carefully transfer the clamped core explants into the silicone culture chambers and fill these chambers with 2 mL of standard cell culture medium (DMEM/F12 + 10% FBS + 1% penicillin/streptomycin + 1% amphotericin + 1% non-essential amino acids).
- OPTIONAL: If the assembloids/the surrounding chambers are to be mechanically loaded, fixate them with additional screws (M3 x 16 mm) in hole 3 (Supplementary File 2 and Supplementary File 3, hole 3).
5. Collagen hydrogel preparation and casting
- Remove the target cells from the tissue culture plastic with cell detachment solution, centrifuge them at 400 x g for 5 min at RT, and resuspend them in 1 mL of standard culture medium.
- For one assembloid, 10 µL PBS (20x), 1.28 µL of 1 M NaOH (125x), 8.72 µL of double-distilled water (ddH2O, 23x), 80 µL of collagen-1 (2.5x or 1.6 mg/mL final), and 100 µL (2x) of standard culture media (for core // cell-free assembloids) or cell suspension are required. Prepare these components in two separate solutions and mix them only immediately before the casting.
- Crosslinking solution: Pool the PBS, the NaOH, the ddH20, and the cell suspension of up to 12 assembloids (+10% safety margin) into a crosslinking solution and keep it in a 15 mL plastic tube on ice. Adjust the concentration of the cell suspension to achieve the following final concentrations after mixing the two solutions: 250,000 cells/mL tendon fibroblasts, 500,000 cells/mL muscle-derived endothelial cells, or 370,000 cells/mL bone marrow-derived macrophages.
- Collagen-1 solution: Pool the collagen-1 solution required for up to 12 assembloids (+10% safety margin) in another 15 mL plastic tube and keep it on ice.
- Once the crosslinking solution and the collagen-1 solution are ready on ice, aspirate the cell culture medium from the culture chambers containing the clamped core explants.
- Add the collagen-1 solution to the crosslinking solution with a 1000 µL pipette and mix the two solutions by pipetting up and down quickly without creating bubbles. Cover the individual tendon core explants with 200 µL of the mixed solution by pipetting it into the groves provided by the silicone chambers.
- Let the hydrogels polymerize for 50 min at 37 °C.
- Carefully fill the silicone culture chambers with 1.5 mL of the respective co-culture medium by pipetting it in the corners of the chambers.
- For core // fibroblast co-culture, fill DMEM/F12, 10% FBS, 1% non-essential amino acids, 1% penicillin/streptomycin, 1% amphotericin, 200 µM L-Ascorbic Acid, 20 ng/mL macrophage-colony stimulating factor.
- For core // macrophage co-culture, fill DMEM/F12, 10% FBS, 1% non-essential amino acids, 1% penicillin/streptomycin, 1% amphotericin, 200 µM L-Ascorbic Acid, 20 ng/mL macrophage-colony stimulating factor.
- For core // endothelial cell co-culture, fill 1:1 mixture of DMEM/F12 and the endopan 3 kit + 10 U/mL heparin + 20% FBS + 1% penicillin/streptomycin + 1% amphotericin + 30 mg/mL endothelial growth supplement.
- Culture the assembloids in the culture conditions appropriate for the hypothesis. To mimic a lesion-like niche environment, for example, culture them at 37 °C and 20% O2. Change the culture medium twice in 1 week. To prevent infections, place the chambers into a large Petri dish or a sterile box before putting them into an incubator.
NOTE: The culture time depends on the hypothesis and the co-culture setup. For example, core // fibroblast assembloids in a lesion-like niche environment become mechanically unstable after around 3 weeks.
6. Available readout methods
- Perform fluorescence microscopy, including viability and morphology assays.
- In general, the assembloids can be imaged as full mounts. To do so, remove the assembloids from the clamps by cutting them with scissors close to the clamps and transferring them to a 12-well plate.
- Wash the assembloids once with PBS.
- If viability analysis is performed, stain each assembloid with 100 µL of 4 x 10⁻⁶ M ethidium homodimer in PBS (EthD-1) for 20 min at 37 °C in the dark.
- Wash the assembloids 3x with PBS, then fixate them with 500 µL of 4% formaldehyde each for 20 min at RT.
CAUTION: 4% formaldehyde has allergenic, carcinogenic, and mutagenic effects, is toxic to reproduction, and can cause developmental toxicity (reprotoxic) or damage to organs. Wear protective clothing and gloves, eye protection, and mask or other breathing protection. - Wash the assembloids 3x with PBS and continue with the staining protocol of choice. A selection of stainings has been described previously84,85.
NOTE: Avoid stainings that use fluorophores with an emission wavelength close to that of collagen autofluorescence (around 480 nm).
- Per the manufacturer's instructions, perform compartment-specific RNA isolation for RT-qPCR or genome-wide RNA sequencing.
- Remove the assembloids from the clamps with scissors.
- OPTIONAL: Use tweezers to separate the core explants from the extrinsic hydrogel compartment.
- Pool 20-24 20 mm core explants or 2 cell-laden collagen hydrogels to isolate sufficient amounts of RNA.
- Use 1 mL of cold trizol and mechanical disruption (i.e., metal beads or cryogenic grinding) to destroy the extracellular matrix of the pooled core explants or the pooled collagen hydrogels.
CAUTION: Oral, dermal, and inhalation toxicity. Causes skin and eye irritation. Only handle with gloves and in a chemical safety cabinet. - Continue with RNA isolation from the cell lysate using standard RNA extraction kits as described previously or as described in the manufacturer's instructions84,85.
- Compartment-specific flow cytometry.
- Remove the assembloids from the clamps with scissors.
- OPTIONAL: Use the tweezers to separate the core explants from the extrinsic hydrogel compartment.
- Digest compartments in 1 mL of PBS with collagenase I (3 mg/mL) and dispase II (4 mg/mL) for 4 h at 37 °C under constant agitation.
- Centrifuge the digested solution at 500 x g for 5 min at RT and aspirate the supernatant.
- Resuspend the pellet in 100 µL of FACS buffer (1% FBS in PBS) containing the fluorophore-conjugated antibodies of choice. A selection of working fluorophore-conjugated antibodies has been described previously84,85.
- Incubate the staining solution for 30 min at RT.
- Dilute the staining solution with 1.4 mL of FACS buffer and centrifuge it for 5 min at 500 x g at RT.
- Resuspend the pellet in 350 µL of FACS buffer and filter the solution through a 100 µm nylon mesh strainer cap before analyzing it with the flow cytometer of choice according to the manufacturer's instructions.
- Analyze the supernatant.
- Replace the co-culture medium with serum-free co-culture medium 3 days before the supernatant collection.
- Perform immediate and delayed analysis of the enriched, undiluted supernatant with enzyme-linked immunosorbent assay (ELISA) and meso scale discovery (MSD) assay kits. For the delayed analysis, store the supernatant in 1.5 mL plastic tubes at -80 °C.
- Assess the assembloid mechanical properties.
- Use a custom-made stretching device to apply mechanical forces and measure mechanical properties22. The stainless-steel dowel pins and the stainless-steel screws make the clamps attachable to other stretching devices as well.
- As the mechanical properties of the assembloid are largely determined by that of the embedded core explant 18, measure the mechanical properties of the core explant prior to embedding it in a hydrogel to lessen the risk of destroying the freshly cast hydrogel in the measuring process.
Results
Component isolation (Figure 1 and Figure 2)
Before utilizing the core explants and cell populations in assembloid co-culture, these components are to be checked under the microscope (Figure 1). Core explants should have a uniform diameter (100-200 µm) and no visible kinks or wrinkles. Endothelial cells should present an elongated shape in contact with other cells, which they do not when seeded at a too-low density because of a low initial yield from the isolation. In this case, the endothelial cells assume a more roundish shape with cytoskeletal extensions and proliferate markedly slower. Split them 1:5 after 7-10 days. Tendon fibroblasts isolated from the Achilles tendons assume a more roundish morphology compared to their human counterparts within 1-2 passages (10-14 days each) when they were split 1:6. Macrophages are much smaller than fibroblasts or endothelial cells and do not proliferate after the isolation. Depending on the batch, their shape can vary from pyramidal to round.
The phenotypes of the cellular components were verified with flow cytometry. A conjugated CD31 antibody was used as a marker for endothelial cells (Figure 2A). Setting the fluorescence threshold based on an unstained control sample (grey), 90.1% of passage 1 (P1) and 48.7% of passage 2 (P2) endothelial cells were identified as CD31-positive. A genetically modified mouse line co-expressing the tendon fibroblast marker Scleraxis alongside a green fluorescent protein (ScxGFP) and a conjugated CD146 antibody was used to characterize the tendon fibroblasts (Figure 2B)35,60. After one passage (P1), 37.3% of the fibroblasts were ScxGFP+CD146-, 0.2% were ScxGFP+CD146+, 4.3% were ScxGFP-CD146+, and 58% were ScxGFP-CD146-. After two passages (P2), the percentage of ScxGFP+CD146- cells decreased to 27.6%, the percentage of ScxGFP+CD146+ cells increased to 6.9%, the percentage of ScxGFP-CD146+ cells increased to 10.6%, and the percentage of ScxGFP-CD146- cells decreased to 54.9%. To identify and characterize the macrophages, a F4/80 antibody was used in combination with a CD86 and a CD206 antibody (Figure 2C). After isolation and culture, 96.4% of the bone marrow-derived cells were F4/80-positive. Among these F4/80-positive cells, 8.6% were CD206+CD86-, 23.6% were CD206+CD86+, 28.3% were CD206-CD86+, and 39.4% were CD206-CD86-. Collagen crosslinking speed may vary from batch to batch and is to be tested before starting experiments.
Assembloid appearance (Figure 3)
In lesion-like culture conditions (36 °C, 20% O2), the core explant remained mechanically stretchable, did not change in appearance, and continued to be visually distinguishable and physically separatable from the surrounding hydrogel over at least 21 days (Figure 3A,B). The surrounding hydrogel was compacted over time, with the compaction speed depending on the cell population seeded into it. Achilles tendon-derived fibroblasts contracted their surrounding hydrogel the fastest and did so radially when in a hydrogel cast around a core explant and in all directions when not (Figure 3B,C). Initially, cell-free hydrogels placed around a core explant compacted, as well. This contraction was likely caused by migrating cells from the core explant, indicating a dynamic cross-compartmental interface. As cell-free hydrogels without an embedded core explant did not compact detectably, the contribution of water loss-induced shrinkage appears to be negligible (Figure 3B and Supplementary File 6).
A lack of hydrogel compaction can, therefore, be used to detect mistakes in the assembloid assembly (i.e., low cell concentrations) and should be checked before continuing with more expensive readout methods. While establishing this method, common mistakes reducing the cell concentration included dying cells in the extrinsic hydrogel because they were left for too long in the relatively harsh crosslinking solution (high pH, low temperature) and drying core explants because the time between medium aspiration and hydrogel injection was too long, or because the core explant was clamped too high to be embedded in the collagen.
Confocal fluorescence microscopy: Viability and morphology analysis (Figure 3)
Once removed from the clamps with scissors (Figure 3B), assembloids can be fixed, stained, and imaged with a confocal microscope as a whole without sectioning. Here, core // endothelial cell, core // macrophage, and core // fibroblast assembloids were stained with DAPI (NucBlue) and Ethidium Homodimer (EthD-1) to analyze the viability and DAPI and F-actin to analyze morphology and cell spreading in the 3D collagen hydrogel (Figure 3D). The viability of core // endothelial cell assembloids (Figure 3E) was quantified and found to be generally lower after assembloid assembly than previously reported for core // macrophage and core // fibroblast assembloids84. However, the viability remained stable during assembloid culture until at least day 7.
Mechanically induced microdamage and measurement of mechanical properties (Figure 4)
The screws and pins attached to the clamp holders allow the fixation of clamped assembloids to uniaxial stretching devices. The custom-made stretching device used here is equipped with a 10 N load cell and has been described in previous publications (Figure 4A)22. All samples were pre-conditioned with five stretch cycles to 1% strain prior to the measurements.
Recording the full stress-strain curve of core explants or assembloids (Figure 4B) would allow quantification of the linear elastic modulus (α), the maximum stress (β), and the maximum strain (у). However, it also irreversibly damages the core explant or the assembloid, which makes it impossible to assess the longitudinal development of the maximum stress (β) and the maximum strain (у) for the same samples (Figure 4B). Here, the linear elastic modulus was used as a measure for the sample's ability to withstand forces, as this measurement requires stretching the sample to only 2% strain, which has been shown previously to not cause permanent reductions in the linear elastic modulus18. In particular, core // endothelial cell assembloids were exposed to the clamping procedure to 2% strain (approximately the end of the linear elastic region) or 6% strain (approximately the maximum strain). The resulting microdamage was assessed by measuring the linear elastic modulus before and after the procedure (Figure 4C).
In line with previously conducted experiments exploiting mono-cultured core explants, core // endothelial cell assembloids retained their linear elastic modulus for at least 14 days when cultured in quasi-homeostatic niche conditions (29 °C, 3% O2) and exposed to strains no higher than 2%18,21. Regarding mechanical baseline stimulation, the static stretch applied through the clamps seemed to sufficiently mimic native strain levels experienced by tendon core units in vivo to prevent catabolic processes generally associated with matrix unloading87. Indeed, the progressive and statistically significant decline of the linear elastic modulus observed in core // endothelial cell assembloids exposed to 6% strain could be attributed to the matrix unloading stemming from mechanically-induced matrix microdamage.
When performing these experiments, it is important to prevent the drying of the assembloid. Here, they were encased in autoclaved and wetted paper, but other methods could also be viable depending on their compatibility with the stretching device used. As the friction between the metal clamps and the core explant is limited, add small pieces of paper between the metal and the core explant during clamping to prevent slippage and closely monitor the stretching process to detect and exclude slipped core explants and assembloids.
Compartment-specific transcriptome and assembloid-specific secretome analysis (Figure 5 and Figure 6)
In the first set of core mono-culture experiments presented here, the stability of core gene expression after explant isolation was assessed to decouple isolation from experimental effects (Figure 5A). Although higher replicate numbers are necessary for precise conclusions, the expression of Vegfa and Mmps increased strongly in freshly isolated core explants within hours after the explant isolation when cultured in lesion-like niche conditions (37 °C, 20% O2).
Neovascularization is a central hallmark of tendon disease and repair that could, in part, be driven by endothelial cells activated by pro-angiogenic factors (i.e., vascular endothelial growth factor, Vegfa) secreted by the tendon core under hypoxia88. Examining the first step of this potential crosstalk (Figure 5B), the expression of both Vegfa and the hypoxia marker carbonic anhydrase 9 (Ca9) was found to be increased statistically significant in explants mono-cultured under low oxygen tension (3% O2) in contrast to those mono-cultured under high oxygen tension (20% O2). Meanwhile, the lower oxygen tension did not seem to cause changes in the expression of tendon fibroblast markers such as Scleraxis (Scx) and collagen-1 (Col1a1). Together, these results identify core-resident cells as plausible contributors to pro-angiogenic signaling in a hypoxic niche.
Next, the activation of endothelial cells by pro-angiogenic core signaling was assessed in core // endothelial cell assembloid co-culture under high (20% O2) and low (3% O2) oxygen tension. Fortunately, the modular composition of assembloids allows compartment-specific transcriptome analysis after culture by physically separating the core explant from the extrinsic collagen hydrogel (Figure 6A). In the core explant (Figure 6D), Vegfa expression was again confirmed to increase under low oxygen tension, although the effect on other hypoxic markers such as Fgf2 was less clear and requires higher replicate numbers for precise conclusions. In addition, the expression of pro-inflammatory markers such as Tnf-α and markers for extracellular matrix degradation such as Mmp3 were decreased in the core under low oxygen tension. In the extrinsic hydrogel initially seeded with endothelial cells (Figure 6E), the presence of an alive core explant (aC) decreased Vegfa expression under low oxygen tension, but not under high oxygen tension. In addition, the presence of a devitalized (dC) core explant under low oxygen tension did not decrease Vegfa expression either. Under low oxygen tension, Tnf-α expression in the extrinsic hydrogel was comparable around aC/dC but increased under high oxygen tension around alive core explants. Fgf2 expression was decreased in all conditions compared to the extrinsic endothelial cell-laden hydrogel cultured around a devitalized core explant under high oxygen tension but most under low oxygen tension. Mmp3 expression was highest around alive core explants under high oxygen tension and lowest around devitalized core explants under low oxygen tension. Overall, the co-cultured endothelial cells seem responsive to both the active core explant, which is capable of initiating crosstalk and variations in oxygen levels. A more comprehensive transcriptome analysis would facilitate the elucidation of their respective contributions.
The modularity of the assembloid system allows the integration of genetically modified cells containing fluorescent reporter genes. Here, endothelial cells isolated from Pdgfb-iCreER mG mice89 were seeded into the hydrogel compartment. These cells co-express the endothelial cell marker platelet-derived growth factor subunit b (Pdgfb) alongside the enhanced green fluorescent protein (EGFP), which makes Pdgfb-expressing endothelial cells appear green under the microscopy (Figure 6C). Using this method, the presence of Pdgfb-expressing endothelial cells was confirmed to be maintained over 7 days in culture (37 °C) and appeared to be independent of oxygen tension (20% O2 compared to 3% O2).
To analyze the secretome of assembloids, the culture medium used respectively for core // cell-free and core // fibroblast, core // macrophage, or core // endothelial cell co-culture was replaced with its serum-free counterpart three days before aspirating and freezing the supernatant now enriched with the secretome (Figure 6A). This enrichment time was sufficient to detect cytokines such as vascular endothelial growth factor (VEGF) with an MSD assay, as shown here for core explants and core // fibroblast assembloids cultured in lesion-like niche conditions (Figure 6B).
Important considerations when analyzing the secretomes and transcriptomes of core explants and assembloids concern the usage of proper controls. Freshly isolated core explants have limited value, as especially their expression of Vegfa and Mmps increases strongly within hours after the isolation (Figure 5A). Time-matched explants surrounded by an initially cell-free hydrogel are more suitable as controls for the core compartment gene expression. For the extrinsic hydrogel, cell-laden hydrogels cultured without a core explant are inferior controls compared to cell-laden hydrogels cultured around devitalized core explants (Supplementary File 7), mainly because they compact into roundish shapes instead of elongated hydrogels which greatly changes cell morphology (Figure 3A).

Figure 1: Assembloid component isolation and assembly to model in vivo crosstalk. Tendon core explants were extracted from mouse tails, cut, and clamped. Mouse leg muscles (i.e., quadriceps femoris (QF), gastrocnemius (G), and tibialis anterior (TA)) were digested to isolate endothelial cells that were then cultured on tissue culture plastic. The Achilles tendons (AT) were digested as well to isolate tendon fibroblasts, which were then cultured on tissue culture plastic. The bone marrow from the tibia and the femur was flushed out of the bones. Then, the isolated monocytes were cultured on tissue culture plastic and differentiated into naïve macrophages. The light microscopy images (10x) depict the appearance of core explants, endothelial cells, tendon fibroblasts, and macrophages immediately before their integration into assembloids. During the assembly, the cells cultured on plastic were put in suspension and then seeded into a collagen-1 solution (1.6 mg/mL). Then, the cell-hydrogel mixture was cast around the clamped core explant and polymerized for 50 min at 37 °C before adding culture medium. Culture conditions were controlled via the clamps (mechanical tension) and the incubator settings (oxygen concentration, temperature). Please click here to view a larger version of this figure.

Figure 2: Characterization of cellular assembloid components. (A) Representative flow cytometric analysis of muscle-derived endothelial cells after one passage (P1, top row) and two passages (P2, bottom row). The counts for unstained (grey) and CD31-stained (green) cells were normalized to modal. The percentages are given for the CD31-stained group. (B) Representative flow cytometric analysis of Achilles tendon-derived fibroblasts after one passage (P1, top row) and two passages (P2, bottom row). The axes report fluorescence intensities of unstained cells (grey) and cells both expressing ScxGFP and stained with CD146 antibodies (rainbow colors). (C) Representative flow cytometric analysis of bone marrow-derived macrophages after culture. In the top row, the counts for unstained (grey) and F4/80-stained (green) cells were normalized to modal. The percentages are given for the F4/80-stained group. The graph in the bottom row reports fluorescence intensities of unstained cells (grey) and the F4/80+ subset of cells stained with CD206 antibodies and CD86 antibodies (rainbow colors). Please click here to view a larger version of this figure.

Figure 3: Assembloid imaging and appearance. (A) Representative photographs taken at day 0 (d0) and day 21 (d21) of culture (37 °C, 20% O2) show a multi-dimensional contraction of a hydrogel containing extrinsic fibroblasts without an embedded core explant and strong radial compaction of a hydrogel containing extrinsic fibroblasts around a core explant. (B) Representative photographs taken at day 21 (d21) of culture (37 °C, 20% O2) show differences in compaction speed between cell-free hydrogels, cell-free hydrogels cast around a core explant, and tendon fibroblast-laden hydrogels cast around a core explant. (C) The representative light microscopy images (10x) taken at day 0 (d0) and day 21 (d21) of culture (37 °C, 20% O2) indicate longitudinal changes in the presence of cell populations and the compaction speed of the collagen hydrogel (HG) around the core explant (E) in core // cell-free and core // fibroblast assembloid co-culture. The schematic representation depicts the differences in hydrogel compaction between core // cell-free assembloid and core // fibroblast assembloid co-culture. (D) Representative confocal microscopy images taken at day 7 (d7) of core // endothelial cell, core // macrophage, and core // fibroblast assembloid co-culture (37 °C, 20 % O2). Images in the left row depict assembloids with cell nuclei stained in blue (DAPI) and dead cells stained in pink (Ethidium homodimer-1). The other two rows depict assembloids with cell nuclei stained in blue (DAPI) and actin filaments in green (F-actin). (E) Boxplots depicting the quantified viability of core // endothelial cell assembloids at day 1 (d1) and day 7 (d7) of co-culture. N = 5. The upper and lower hinges correspond to the first and third quartiles (25th and 75th percentiles) and the middle one to the median. Whiskers extend from the upper/lower hinge to the largest/smallest value no further than 1.5 times the interquartile range. P-values: n.s.p > 0.05. Please click here to view a larger version of this figure.
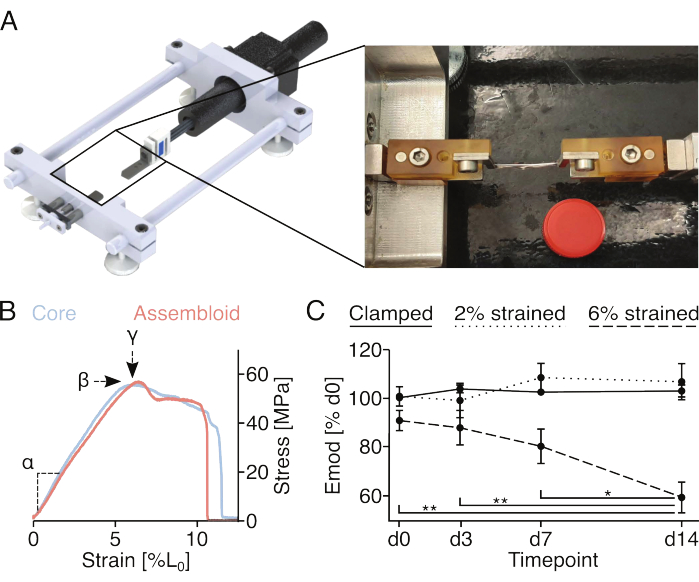
Figure 4: Mechanical stimulation of assembloids and measurement of assembloid mechanical properties. (A) Graphical depiction of the custom-made stretching device comprising the clamp holder platforms, a force sensor, and a stepper motor. The photographic image shows an assembloid mounted to the stretching device with clamps. The lid of a 15 mL plastic tube (Ø: 17 mm) used for scale. (B) Graph depicting representative stress/strain curves for core explants (light blue) and assembloids (light red). The linear elastic modulus (α), maximum stress (β), and maximum strain (у) can be extracted from the data to mechanically characterize the core explant or assembloid. (C) Graph showing the linear elastic modulus (Emod) of core // endothelial cell assembloids co-cultured (29 °C, 3% O2) over a 14-day time course after being clamped (solid line), clamped and stretched to 2% L0 strain (dotted line), or clamped and stretched to 6% L0 strain (dashed line) at the start of the experiment. N = 5. The data points were normalized to the initial modulus linear elastic modulus before the stretching and are all displayed as mean (±sem). P-values: *p < 0.05, **p < 0.01. Please click here to view a larger version of this figure.
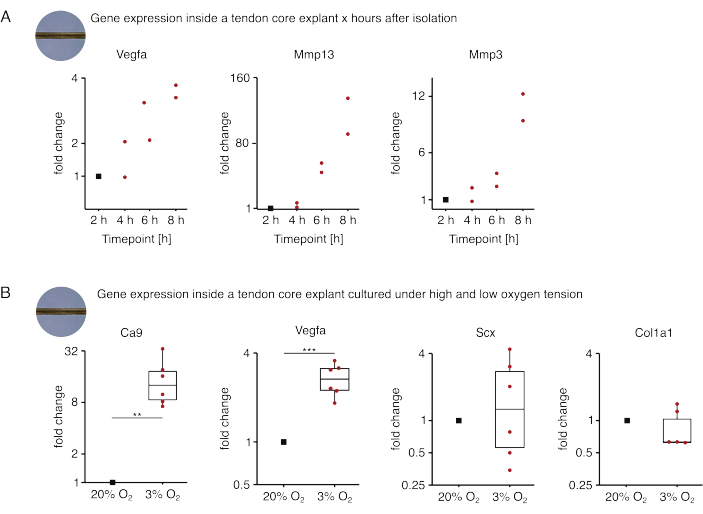
Figure 5: Changes in the core transcriptome after isolation and culture under different niche conditions. (A) Scatterplot depicting the fold changes in Vegfa, Mmp13, and Mmp3 gene expression in mono-cultured (37 °C, 20% O2) murine core explants 2 h, 4 h, 6 h, and 8 h after isolating them from the tail. The fold changes at the respective time points were normalized to the gene expression 2 hours after the isolation. N = 2. (B) Boxplots depicting the fold changes in Ca9, Vegfa, Scx, and Col1a1 gene expression in core explants mono-cultured under low oxygen tension (3% O2) normalized and compared to those mono-cultured under high oxygen tension (20% O2). N = 5-6. The upper and lower hinges of the boxplots correspond to the first and third quartiles (25th and 75th percentiles) and the middle one to the median. Whiskers extend from the upper/lower hinge to the largest/smallest value no further than 1.5 times the interquartile range. Datapoints used for normalization are depicted as black dots and individual datapoints as red dots. P-values: **p < 0.01, ***p < 0.001. Please click here to view a larger version of this figure.

Figure 6: Assembloid-specific secretome and compartment-specific transcriptome analysis. (A) Representative photograph showing the assembloid at day 7 (d7), when secretome and transcriptome samples were taken, and depiction of the underlying workflow. (B) VEGF concentration (pg/mL) in the supernatant of core // cell-free and core // fibroblast assembloids after 7 days of co-culture (37 °C, 20% O2) depicted as boxplots. N = 6. (C) Representative confocal microscopy images of core // endothelial cell assembloids after 7 days of co-culture (37 °C) under high oxygen tension (20% O2) and low oxygen tension (3% O2). Cell nuclei are stained in blue (DAPI), and the embedded endothelial cells co-express enhanced green fluorescent protein (EGFP) alongside the endothelial cell marker platelet-derived growth factor subunit b (Pdgfb). The dotted line indicates the compartmental interface between the core explant (E) and the endothelial cell-laden hydrogel (HG). (D) Scatterplot depicting the fold changes in Vegfa, Tnf-α, Fgf2, and Mmp3 gene expression in the core compartment from core // endothelial cell assembloids co-cultured under low oxygen tension (3% O2) normalized and compared to those cultured under high oxygen tension (20% O2). N = 2. (E) Scatterplot depicting the fold changes in Vegfa, Tnf-α, Fgf2, and Mmp3 gene expression in the extrinsic compartment of core // endothelial cell assembloids with an alive core (aC) or a devitalized core (dC) co-cultured under high oxygen tension (20% O2) and low oxygen tension (3% O2). The fold changes in the respective conditions were normalized to the extrinsic compartment of a core // endothelial cell assembloid with a devitalized core (dC) co-cultured under high oxygen tension (20% O2). N = 3-4. In B, the upper and lower hinges of the boxplots correspond to the first and third quartiles (25th and 75th percentiles) and the middle one to the median. Whiskers extend from the upper / lower hinge to the largest / smallest value no further than 1.5 times the interquartile range. Outliers are depicted as black dots. P-values: *p < 0.05. In D and E, the datapoints used for normalization are depicted as black dots, and individual datapoints are depicted as red dots. Please click here to view a larger version of this figure.
Table 1: Input requirements for tendon disease and injury model systems. A list of primary tendon disease triggers and secondary drivers matched to a selection of input parameters whose tractability is central for modeling tendon disease and injury. Please click here to download this Table.
Table 2: Output requirements for tendon disease and injury model systems. A selection of tendon disease hallmarks matched to a selection of output parameters whose quantifiability is central for the interpretation of tendon disease and injury model behavior. Please click here to download this Table.
Supplementary File 1: .stl file for the clamp holders, the mounting station, and the chamber molds. Please click here to download this File.
Supplementary File 2: Plan of right clamp holder. Please click here to download this File.
Supplementary File 3: Plan of left clamp holder. Please click here to download this File.
Supplementary File 4: Plan of the mounting platform Please click here to download this File.
Supplementary File 5: Plan of metal clamps. Please click here to download this File.
Supplementary File 6: Image showing cell-free hydrogel shrinkage. Please click here to download this File.
Supplementary File 7: Image showing a devitalized core explant. Please click here to download this File.
Discussion
Overall, the assembloid model system presented here has several critical steps to highlight. First, the model system is only as good as the quality of its components. It is vital to check the core explant and the to-be-seeded cell populations under the microscope prior to initiating the assembly process. It is similarly important to verify the phenotype of the isolated cell populations at least once with flow cytometry. Especially when a new batch of collagen-1 is used for the first time, it is advantageous to check the crosslinking speed in a trial run before embedding cells into it. The assembloid assembly requires a lot of manual handling, which increases the risk of infections. To minimize the risk of infections, work in a sterile biosafety hood with laminar air flow, exchange gloves often, and decontaminate the gloves as well as the working space with 80% ethanol. For similar reasons, do not use the 3D-printed clamp holders more than once. Before the embedding process itself, it is important to keep all the hydrogel components (crosslinking solution, collagen-1 solution) on ice to prevent premature crosslinking. Consequently, one must work quickly once the cells are added to the crosslinking solution to limit cell death due to the high pH and low temperature of the crosslinking solution. To prevent drying-related cell death in the core explant, aspirate the medium covering the clamped core explants immediately before mixing the crosslinking solution with the collagen-1 solution. To guarantee the central placement of the core explant within the hydrogel, it is ideal to cast the hydrogel around a clamped core explant that is slightly tensioned. To do so, use the dowel pin and the M3 x 16 mm bolt screw to fixate the clamp holders to a (3D-printed) plate set with holes at the appropriate lengths. After the 50 min polymerization time, the embedded core explant can be detensioned again depending on the desired culture conditions. The amount of tension the assembloid experiences during culture has a profound impact on experimental outcomes and is to be kept uniform across samples and conditions21.
Nevertheless, the large impact of mechanical (un-)loading on experimental outcomes is a main advantage of the assembloid model over most tissue-engineered alternatives, especially since the maintained matrix composition of the core explant should also recreate the complex in vivo loading patterns on the cellular level90. While in practice, only the measurement of the linear elastic modulus, the maximum tensile strain, and the maximum tensile stress of assembloids have been demonstrated so far, protocols for fatigue strength and stress relaxation measurements have been described for tendon core explants elsewhere and should be applicable to the assembloids91,92. In addition to the in vivo-like loading patterns, the assembloid's multi-level modularity is likely its biggest advantage. Thanks to the individual culture chambers, a controllable set of niche conditions can be set for each sample separately (i.e., temperature, oxygen tension, glucose concentration, supplementation, stimulators, inhibitors, and static stretch with a plate). Next, matrix stiffness and matrix composition of the extrinsic compartment are customizable through the hydrogel composition and would, for example, allow for studying the impact of an increasingly diseased tissue microenvironment by incorporating more collagen-3 and cellular fibronectin93,94,95. The assessed cell populations in the extrinsic compartment are easily adaptable by selecting which cells to seed but can also be modified in the tendon core explant by leveraging established genetically modified cell lines and mouse lines (i.e., ScxLin cell depletion)96. The differing matrix and cell composition of the two compartments further provides a unique compartmentalized 3D structure that is another central tendon hallmark1,30,46.
When using this system, it is important to consider the consequences of the system's modularity for the granularity of the outcome parameters. While cell proliferation and recruitment can be assessed for each compartment separately, the mechanical properties, secretome components, and degradation products are currently only measurable for the complete assembloid. Regarding throughput, one properly trained person can prepare up to 50 assembloids in a regular workday, with the main bottleneck being the clamping procedure. While some of the readout methods are mutually exclusive, it is possible to assess mechanical properties and secretome components repetitively on the same sample as well as either cell population composition (flow cytometry), cell transcriptome (RT-qPCR, RNA-sequencing), or matrix and cell distribution (immunocytochemistry/fluorescence microscopy) at endpoints. In previous publications, these methods have been deployed to extensively characterize intercellular, cross-compartmental interactions in core // fibroblast and core // macrophage assembloids exposed to a lesion-like niche84,85. In this work, the capability of the assembloid model system to probe the cross-compartmental interplay between the core and extrinsic endothelial cells under different microenvironmental stimuli has been explored.
The modularity of the model system allows for future refinement of the method, which is necessary to overcome the following limitations of the current design iteration. The flow cytometric analysis presented in this work and single-cell RNA-sequencing data published recently revealed that the tendon core-resident tenocytes and Achilles tendon-derived populations are more heterogeneous than previously assumed24,34,59,84,97. In addition, the migratory behavior of initially core- or hydrogel-resident cell populations blur assembloid compartmentalization during culture. Both factors together make it challenging to attribute transcriptomic differences to specific cell types and to separate proliferation- from migration-based processes. This limitation could be overcome by refining the input population with fluorescence-activated cell sorting (FACS) based on the cellular composition of healthy or diseased tendons characterized in recent in vivo studies, improving the readout by implementing single-cell RNA-sequencing, and integrating proliferation markers such as an EdU (5-ethynyl-2'-deoxyuridine) staining during microscopy.
The assembloids presented here also share a weakness with most of the currently available in vitro systems that simulate diseased organs disconnected from the rest of the body98,99. However, the culture chamber-based platform used here positions the model system well for integration into a multi-organ platform where assembloids mimicking different organs are connected and interorgan interactions can be studied.
At its core, the model system is based on positional rodent tendons, which results in its own unique set of drawbacks. First, the translatability of results is hampered by wild-type mice not developing or suffering from tendon diseases8,100,101. Integrating tissues and cells from humans or newly developed mouse strains that exhibit aspects of tendon disease could alleviate this issue102. The switch towards a human-based assembloid is particularly interesting, as it would enable studies with patient-derived tissues from differently diseased tendons (i.e., tendinitis, tendinosis, or peritendinitis) and even treatment-resistant donors that could unlock more personalized treatment programs. Second, murine tail tendon explants do not handle overload-induced microdamage particularly well, which limits the applicability of the model system for the study of acute tendon damage.
For all these reasons, explant // hydrogel assembloids are in a prime position to study tendon core biology, matrix structure-function interactions, and cross-compartmental interactions between specific cell populations in response to niche-induced microdamage. Insights gathered from these rather high-throughput studies could give direction to in vivo research and treatment development.
Disclosures
The authors have nothing to disclose.
Acknowledgements
This work was funded by the ETH Grant 1-005733
Materials
| Name | Company | Catalog Number | Comments |
|---|---|---|---|
| 0.4 mm x 25 mm injection needle (G27) | Sterican | 9186174 | |
| 3D printing filament: Clear polylactic acid prusament | Prusa | NA | |
| 4% formaldehyde | Roti-Histofix | P087.4 | |
| Accutase cell detachment solution | Sigma-Aldrich | A6964-100ML | |
| Amphotericin | VWR | L0009-100 | |
| Attachable digital C-mount camera: Moticam 2 | Motic | NA | |
| Bolt screw M3 x 16 mm, stainless steel | RS PRO | 1871235 | |
| Bolt screw M3 x 6 mm, stainless steel | RS PRO | 1871207 | |
| CaCl2 | Sigma-Aldrich | C5670 | |
| CD146 antibody: PE anti-mouse | BioLegend | 134703 | |
| CD206 antibody: Alexa Fluor 488 anti-mouse | BioLegend | 141709 | |
| CD31 antibody: Alexa Fluor 488 anti-mouse | BioLegend | 102413 | |
| CD86 antibody: PE anti-mouse | BioLegend | 105007 | |
| Collagenase I | Thermo Fisher Scientific | 17100017 | |
| Collagenase IV | Gibco | 17104-019 | |
| Dialyzed Fetal Bovine Serum (FBS) | Sigma-Aldrich | F0392-100ML | |
| Dimethyl sulfoxide (DMSO) | Sigma-Aldrich | 7000183 | |
| Dispase II | Sigma-Aldrich | D4693-1G | |
| DMEM/F12 | Sigma | 7002211 | |
| Dowel Pin, 3 mm x 16 mm, stainless steel | Accu | HDP-3-16-A1 | |
| Dragon Skin 10 Slow/1 silicone | KauPO | 09301-004-000001 | |
| Endopan 3 Kit | Pan-Biotech | P04-0010K | |
| Endothelial cell growth supplement | Lonza | CC-3162 | |
| Eppendorf safe-lock plastic tubes (1.5 mL) | Eppendorf | 30121023 | |
| Ethidium homodimer, EthD-1, 2 mM stock in DMSO | Sigma-Aldrich | 46043-1MG-F | |
| F4/80 antibody: Apc/fire 750 anti-mouse | BioLegend | 123151 | |
| Falcon plastic tube (15 mL) | Corning | 352096 | |
| Falcon plastic tube (50 mL) | Corning | 352070 | |
| Flow cytometer: LSR II Fortessa | BD Bioscience | 23-11617-02 | |
| Gelatin | Invitrogen | D12054 | |
| Hellmanex III alkaline cleaning concentrate | Sigma | Z805939-1EA | |
| Heparin | Sigma-Aldrich | H3149-10KU | |
| Hydroxyproline assay | Sigma-Aldrich | MAK008 | |
| Image analysis software: Motic Images Plus 3.0 ML | Motic | NA | |
| L-Ascorbic Acid Phosphate Magnesium Salt n-Hydrate | Wako Chemicals | 013-19641 | |
| LSE Low Speed Orbital Shaker | Corning | 6780-FP | |
| MEM non-essential amino acids | Sigma | 7002231 | |
| Mouse macrophage-stimulating factor (m-CSF) | PeproTech | 315-02-50ug | |
| MSD assay | Mesoscale Discovery | various | |
| NucBlue | Thermo Fisher Scientific | R37605 | |
| Nylon mesh strainer cap, 100 µm | Corning | 734-2761 | |
| Original Prusa i3 MK3S 3D printer | Prusa | i3 MK3S | |
| Penicillin-Streptomycin | Sigma-Aldrich | P4333 | |
| Phosphate-buffered saline (PBS), ph 7.4, sterile, 10 L | Gibco | 10010001 | |
| Puromycin | Gibco | A1113803 | |
| RBC lysis buffer | VWR | 786-650 | |
| recombinant m-CSF | PeproTech | 315-02 | |
| RNA extraction kit: Rneasy plus Micro | Qiagen | 74034 | |
| Slicing software: PrusaSlicer | Prusa | NA | Version 2.6.0 or higher |
| Sterile Cell Strainer 100 µm | Fisherbrand | 22363549 | |
| Surgical scalpel blade No. 21 | Swann-Morton | 307 | |
| Trizol reagent | Thermo Fisher Scientific | 15596018 | |
| Trypsin-EDTA (0.5 %) | Gibco | 15400054 |
References
- Snedeker, J. G., Foolen, J. Tendon injury and repair - A perspective on the basic mechanisms of tendon disease and future clinical therapy. Acta Biomaterialia. 63, 18-36 (2017).
- Wang, J. H. C. Mechanobiology of tendon. Journal of Biomechanics. 39 (9), 1563-1582 (2006).
- Kirkendall, D. T., Garrett, W. E. Function and biomechanics of tendons. Scandinavian Journal of Medicine and Science in Sports. 7 (2), 62-66 (1997).
- Götmark, F., Cafaro, P., O'Sullivan, J. Aging human populations: Good for us, good for the earth. Trends in Ecology and Evolution. 33 (11), 851-862 (2018).
- Maffulli, N., Wong, J., Almekinders, L. C. Types and epidemiology of tendinopathy. Clinics in Sports Medicine. 22 (4), 675-692 (2003).
- Renström, P. A. F. H., Woo, S. L. -Y. Tendinopathy: A major medical problem in sport. Tendinopathy in Athletes. , (2007).
- Screen, H. R. C., Birk, D. E., Kadler, K. E., Ramirez, F., Young, M. Tendon functional extracellular matrix. Journal of Orthopaedic Research. 33 (6), 793-799 (2016).
- Wunderli, S. L., Blache, U., Snedeker, J. G., Wunderli, S. L., Blache, U., Tendon, J. G. S. Tendon explant models for physiologically relevant in vitro study of tissue biology - a perspective. Connective Tissue Research. 61 (3-4), 262-277 (2020).
- Magnusson, S. P., Langberg, H., Kjaer, M. The pathogenesis of tendinopathy: balancing the response to loading. Nature Reviews Rheumatology. 6 (5), 262-268 (2010).
- Heinemeier, K. M., Schjerling, P., Øhlenschlæger, T. F., Eismark, C., Olsen, J., Kjær, M. Carbon-14 bomb pulse dating shows that tendinopathy is preceded by years of abnormally high collagen turnover. FASEB Journal. 32 (9), 4763-4775 (2018).
- Andersson, G., Backman, L. J., Scott, A., Lorentzon, R., Forsgren, S., Danielson, P. Substance P accelerates hypercellularity and angiogenesis in tendon tissue and enhances paratendinitis in response to Achilles tendon overuse in a tendinopathy model. British Journal of Sports Medicine. 45 (13), 1017-1022 (2011).
- Rolf, C. G., Fu, B. S. C., Pau, A., Wang, W., Chan, B. Increased cell proliferation and associated expression of PDGFRβ causing hypercellularity in patellar tendinosis. Rheumatology. 40 (3), 256-261 (2001).
- Riley, G. The pathogenesis of tendinopathy. A molecular perspective. Rheumatology. 43 (2), 131-142 (2004).
- Jarvinen, M., Jozsa, L., Kannus, P., Järvinen, T. L., Kvist, M., Leadbetter, W. Histopathological findings in chronic tendon disorders. Scandinavian Journal of Medicine & Science in Sports. 7 (2), 86-95 (1997).
- Soslowsky, L. J., et al. Overuse activity injures the supraspinatus tendon in an animal model: A histologic and biomechanical study. Journal of Shoulder and Elbow Surgery. 9 (2), 79-84 (2000).
- Tran, P. H. T., et al. Early development of tendinopathy in humans: Sequence of pathological changes in structure and tissue turnover signaling. FASEB Journal. 34 (1), 776-788 (2020).
- Theodossiou, S. K., Schiele, N. R. Models of tendon development and injury. BMC Biomedical Engineering. 1 (1), 1-24 (2019).
- Stauber, T., Blache, U., Snedeker, J. G. Tendon tissue microdamage and the limits of intrinsic repair. Matrix Biology. 85-86, 68-79 (2020).
- Wang, T., et al. In vitro loading models for tendon mechanobiology. Journal of Orthopaedic Research. 36 (2), 566-575 (2018).
- Fang, F., Sawhney, A. S., Lake, S. P. Different regions of bovine deep digital flexor tendon exhibit distinct elastic, but not viscous, mechanical properties under both compression and shear loading. Journal of Biomechanics. 47 (12), 2869-2877 (2014).
- Wunderli, S. L., et al. Tendon response to matrix unloading is determined by the patho-physiological niche. Matrix Biology. 89, 11-26 (2020).
- Wunderli, S. L., et al. Minimal mechanical load and tissue culture conditions preserve native cell phenotype and morphology in tendon - A novel ex vivo mouse explant model. Journal of Orthopaedic Research. 36 (5), 1383-1390 (2017).
- Arnoczky, S. P., Lavagnino, M., Egerbacher, M., Caballero, O., Gardner, K. Matrix metalloproteinase inhibitors prevent a decrease in the mechanical properties of stress-deprived tendons. The American Journal of Sports Medicine. 35 (5), 763-769 (2007).
- de Micheli, A. J., et al. Single-cell transcriptomic analysis identifies extensive heterogeneity in the cellular composition of mouse Achilles tendons. American Journal of Physiology - Cell Physiology. 319 (5), C885-C894 (2020).
- Arvind, V., Huang, A. H. Reparative and maladaptive inflammation in tendon healing. Frontiers in Bioengineering and Biotechnology. 9 (July), 1-16 (2021).
- Marsolais, D., Côté, C. H., Frenette, J. Neutrophils and macrophages accumulate sequentially following Achilles tendon injury. Journal of Orthopaedic Research. 19 (6), 1203-1209 (2001).
- Garcia-Melchor, E., et al. Novel self-amplificatory loop between T cells and tenocytes as a driver of chronicity in tendon disease. Annals of the Rheumatic Diseases. 80 (8), 1075-1085 (2021).
- Stolk, M., Klatte-Schulz, F., Schmock, A., Minkwitz, S., Wildemann, B., Seifert, M. New insights into tenocyte-immune cell interplay in an in vitro model of inflammation. Scientific Reports. 7 (1), 9801(2017).
- Tempfer, H., Traweger, A. Tendon vasculature in health and disease. Frontiers in Physiology. 6, 330(2015).
- Mienaltowski, M. J., Adams, S. M., Birk, D. E. Regional differences in stem cell/progenitor cell populations from the mouse achilles tendon. Tissue Engineering - Part A. 19 (1-2), 199-210 (2013).
- Sakabe, T., et al. Transcription factor scleraxis vitally contributes to progenitor lineage direction in wound healing of adult tendon in mice. Journal of Biological Chemistry. 293, (2018).
- Dyment, N. A., Hagiwara, Y., Matthews, B. G., Li, Y., Kalajzic, I., Rowe, D. W. Lineage tracing of resident tendon progenitor cells during growth and natural healing. PLoS One. 9 (4), e96113(2014).
- Harvey, T., Flamenco, S., Fan, C. M. A Tppp3 + Pdgfra + tendon stem cell population contributes to regeneration and reveals a shared role for PDGF signalling in regeneration and fibrosis. Nature Cell Biology. 21 (12), 1490-1503 (2019).
- Zhang, J., et al. Characterization of the structure, vascularity, and stem/progenitor cell populations in porcine Achilles tendon (PAT). Cell and Tissue Research. 384 (2), 367-387 (2021).
- Tarafder, S., et al. Tendon stem/progenitor cells regulate inflammation in tendon healing via JNK and STAT3 signaling. FASEB Journal. 31 (9), 3991-3998 (2017).
- Lee, C. H., et al. Harnessing endogenous stem/progenitor cells for tendon regeneration Find the latest version Harnessing endogenous stem/progenitor cells for tendon regeneration. J Clin Invest. 125 (7), 2690-2701 (2015).
- Lui, P. P. Y., Chan, L. S., Cheuk, Y. C., Lee, Y. W., Chan, K. M. Expression of bone morphogenetic protein-2 in the chondrogenic and ossifying sites of calcific tendinopathy and traumatic tendon injury rat models. Journal of Orthopaedic Surgery and Research. 4, 27(2009).
- Takeuchi, E., et al. Localization and expression of osteopontin in the rotator cuff tendons in patients with calcifying tendinitis. Virchows Archiv. 438 (6), 612-617 (2001).
- Kadler, K. E., Hill, A., Canty-Laird, E. G. Collagen fibrillogenesis: fibronectin, integrins, and minor collagens as organizers and nucleators. Current Opinion in Cell Biology. 20 (5), 495-501 (2008).
- Millar, N. L., et al. MicroRNA29a regulates IL-33-mediated tissue remodelling in tendon disease. Nature Communications. 6, 6774(2015).
- Riley, G. P., Harrall, R. L., Constant, C. R., Chard, M. D., Cawston, T. E., Hazleman, B. L. Tendon degeneration and chronic shoulder pain: changes in the collagen composition of the human rotator cuff tendons in rotator cuff tendinitis. Annals of the Rheumatic Diseases. 53 (6), 359-366 (1994).
- Thorpe, C. T., Peffers, M. J., Simpson, D., Halliwell, E., Screen, H. R. C., Clegg, P. D. Anatomical heterogeneity of tendon: Fascicular and interfascicular tendon compartments have distinct proteomic composition. Scientific Reports. 6, 20455(2016).
- Thorpe, C. T., et al. Distribution of proteins within different compartments of tendon varies according to tendon type. Journal of Anatomy. 229 (3), 450-458 (2016).
- Choi, H., et al. Heterogeneity of proteome dynamics between connective tissue phases of adult Tendon. eLife. 9, e55262(2020).
- Spiesz, E. M., et al. Tendon extracellular matrix damage, degradation and inflammation in response to in vitro overload exercise. Journal of Orthopaedic Research. 33 (6), 889-897 (2015).
- Dyment, N. A., et al. The paratenon contributes to scleraxis-expressing cells during patellar tendon healing. PLoS One. 8 (3), e59944(2013).
- Cadby, J. A., Buehler, E., Godbout, C., Van Weeren, P. R., Snedeker, J. G. Differences between the cell populations from the peritenon and the tendon core with regard to their potential implication in tendon repair. PLoS One. 9 (3), e92474(2014).
- Huh, D., Hamilton, G. A., Ingber, D. E. From three-dimensional cell culture to organs-on-chips. Trends in Cell Biology. 21 (12), 745-754 (2011).
- Duval, K., et al. Modeling physiological events in 2D vs. 3D cell culture. Physiology. 32 (4), 266(2017).
- Wang, J. H. C. Mechanobiology of tendon. Journal of Biomechanics. 39 (9), 1563-1582 (2006).
- Derwin, K. A., Soslowsky, L. J. A quantitative investigation of structure-function relationships in a tendon fascicle model. Journal of Biomechanical Engineering. 121 (6), 598-604 (1999).
- Herod, T. W., Veres, S. P. Development of overuse tendinopathy: A new descriptive model for the initiation of tendon damage during cyclic loading. Journal of Orthopaedic Research. 36 (1), 467-476 (2017).
- Andersen, M. B., Pingel, J., Kjær, M., Langberg, H. Interleukin-6: A growth factor stimulating collagen synthesis in human tendon. Journal of Applied Physiology. 110 (6), 1549-1554 (2011).
- Langberg, H., Rosendal, L., Kjær, M. Training-induced changes in peritendinous type I collagen turnover determined by microdialysis in humans. Journal of Physiology. 534 (1), 297-302 (2001).
- Zitnay, J. L., et al. Molecular level detection and localization of mechanical damage in collagen enabled by collagen hybridizing peptides. Nature Communications. 8, 14913(2017).
- Hwang, J., et al. Molecular assessment of collagen denaturation in decellularized tissues using a collagen hybridizing peptide. Acta Biomaterialia. 53, 268-278 (2016).
- Lin, A. H., Zitnay, J. L., Li, Y., Yu, S. M., Weiss, J. A. Microplate assay for denatured collagen using collagen hybridizing peptides. Journal of Orthopaedic Research. 37 (2), 431-438 (2019).
- Blomgran, P., Blomgran, R., Ernerudh, J., Aspenberg, P. A possible link between loading, inflammation and healing: Immune cell populations during tendon healing in the rat. Scientific Reports. 6, 29824(2016).
- Harvey, T., Flamenco, S., Fan, C. -M. A Tppp3+Pdgfra+ tendon stem cell population contributes to regeneration and reveals a shared role for PDGF signalling in regeneration and fibrosis. Nature Cell Biology. 21 (12), 1490-1503 (2019).
- Pryce, B. A., Brent, A. E., Murchison, N. D., Tabin, C. J., Schweitzer, R. Generation of transgenic tendon reporters, ScxGFP and ScxAP, using regulatory elements of the scleraxis gene. Developmental Dynamics. 236 (6), 1677-1682 (2007).
- Godinho, M. S. C., Thorpe, C. T., Greenwald, S. E., Screen, H. R. C. Elastin is localised to the interfascicular matrix of energy storing tendons and becomes increasingly disorganised with ageing. Scientific Reports. 7 (1), 9713(2017).
- Smith, M. M., et al. Modulation of aggrecan and ADAMTS expression in ovine tendinopathy induced by altered strain. Arthritis and Rheumatism. 58 (4), 1055-1066 (2008).
- Asundi, K. R., Rempel, D. M. MMP-1, IL-1β, and COX-2 mRNA expression is modulated by static load in rabbit flexor tendons. Annals of Biomedical Engineering. 36 (2), 237-243 (2008).
- Millar, N. L., et al. Inflammation is present in early human tendinopathy. American Journal of Sports Medicine. 38 (10), 2085-2091 (2010).
- Dakin, S. G., et al. Inflammation activation and resolution in human tendon disease. Science Translational Medicine. 7 (311), 311ra173(2015).
- Jelinsky, S. A., Rodeo, S. A., Li, J., Gulotta, L. V., Archambault, J. M., Seeherman, H. J. Regulation of gene expression in human tendinopathy. BMC Musculoskeletal Disorders. 12, 86(2011).
- Kannus, P., Józsa, L. Histopathological changes preceding spontaneous rupture of a tendon. A controlled study of 891 patients. The Journal of Bone and Joint Surgery. American. 73 (10), 1507-1525 (1991).
- Comin, J., et al. The prevalence and clinical significance of sonographic tendon abnormalities in asymptomatic ballet dancers: A 24-month longitudinal study. British Journal of Sports Medicine. 47 (2), 89-92 (2013).
- Schubert, T. E. O., Weidler, C., Lerch, K., Hofstädter, F., Straub, R. H. Achilles tendinosis is associated with sprouting of substance P positive nerve fibres. Annals of the Rheumatic Diseases. 64 (7), 1083-1086 (2005).
- Quigley, A. S., Bancelin, S., Deska-Gauthier, D., Légaré, F., Kreplak, L., Veres, S. P. In tendons, differing physiological requirements lead to functionally distinct nanostructures. Scientific Reports. 8 (1), 4409(2018).
- Herod, T. W., Chambers, N. C., Veres, S. P. Collagen fibrils in functionally distinct tendons have differing structural responses to tendon rupture and fatigue loading. Acta Biomaterialia. 42, 296-307 (2016).
- Shepherd, J. H., Riley, G. P., Screen, H. R. C. Early stage fatigue damage occurs in bovine tendon fascicles in the absence of changes in mechanics at either the gross or micro-structural level. Journal of the Mechanical Behavior of Biomedical Materials. 38, 163-172 (2014).
- Birch, H. L. Tendon matrix composition and turnover in relation to functional requirements. International Journal of Experimental Pathology. 88 (4), 241-248 (2007).
- Kapałczyńska, M., et al. 2D and 3D cell cultures - a comparison of different types of cancer cell cultures. Archives of Medical Science. 14 (4), 910-919 (2018).
- Hussien, A. A., Niederoest, B., Bollhalder, M., Goedecke, N., Snedeker, J. G. The stiffness-sensitive transcriptome of human tendon stromal cells. Advanced Healthcare Materials. 12 (7), 2101216(2023).
- Heo, S. J., et al. Aberrant chromatin reorganization in cells from diseased fibrous connective tissue in response to altered chemomechanical cues. Nature Biomedical Engineering. 7 (2), 177-191 (2023).
- Liu, C. -F., Aschbacher-Smith, L., Barthelery, N. J., Dyment, N., Butler, D., Wylie, C. What we should know before using tissue engineering techniques to repair injured tendons: A developmental biology perspective. Tissue Engineering Part B: Reviews. 17 (3), 165-176 (2011).
- Ruiz-Alonso, S., Lafuente-Merchan, M., Ciriza, J., Saenz-del-Burgo, L., Pedraz, J. L. Tendon tissue engineering: Cells, growth factors, scaffolds and production techniques. Journal of Controlled Release. 333, 448-486 (2021).
- Rinoldi, C., et al. Tendon tissue engineering: Effects of mechanical and biochemical stimulation on stem cell alignment on cell-laden hydrogel yarns. Advanced Healthcare Materials. 8 (7), e1801218(2019).
- Walia, B., Huang, A. H. Tendon stem progenitor cells: Understanding the biology to inform therapeutic strategies for tendon repair. Journal of Orthopaedic Research. 37 (6), 1270-1280 (2018).
- Thorpe, C. T., Riley, G. P., Birch, H. L., Clegg, P. D., Screen, H. R. C. Fascicles from energy-storing tendons show an age-specific response to cyclic fatigue loading. Journal of The Royal Society Interface. 11 (92), 20131058-20131058 (2014).
- Thorpe, C. T., Riley, G. P., Birch, H. L., Clegg, P. D., Screen, H. R. C. Fascicles and the interfascicular matrix show decreased fatigue life with ageing in energy storing tendons. Acta Biomaterialia. 56, 58-64 (2017).
- Youngstrom, D. W., Rajpar, I., Kaplan, D. L., Barrett, J. G. A bioreactor system for in vitro tendon differentiation and tendon tissue engineering. Journal of Orthopaedic Research. 33 (6), 911-918 (2015).
- Stauber, T., et al. Extrinsic macrophages protect while tendon progenitors degrade: Insights from a tissue engineered model of tendon compartmental crosstalk. Advanced Healthcare Materials. 10 (20), e2100741(2021).
- Stauber, T., Moschini, G., Hussien, A. A., Jaeger, P. K., De Bock, K., Snedeker, J. G. IL-6 signaling exacerbates hallmarks of chronic tendon disease by stimulating progenitor proliferation & migration to damage. eLife. 12, RP87092(2023).
- Doillon, C. J., Mantovani, D., Rajan, N., Habermehl, J., Cote, M. Preparation of ready-to-use storable and reconstituted type I collagen from rat tail tendon for tissue engineering applications. Nature Protocols. 1 (6), 2753-2758 (2007).
- Blache, U., et al. Inhibition of ERK 1/2 kinases prevents tendon matrix breakdown. Scientific Reports. 11 (1), 6838(2021).
- Liu, X., et al. The role of vascular endothelial growth factor in tendon healing. Frontiers in Physiology. 12, 766080(2021).
- Claxton, S., Kostourou, V., Jadeja, S., Chambon, P., Hodivala-dilke, K., Fruttiger, M. Efficient, inducible Cre-recombinase activation in vascular endothelium. Genesis. 46 (2), 74-80 (2008).
- Passini, F. S., et al. Shear-stress sensing by PIEZO1 regulates tendon stiffness in rodents and influences jumping performance in humans. Nature Biomedical Engineering. 5 (12), 1457-1471 (2021).
- Lee, A. H., Szczesny, S. E., Santare, M. H., Elliott, D. M. Investigating mechanisms of tendon damage by measuring multi-scale recovery following tensile loading. Acta Biomaterialia. 57, 363-372 (2017).
- Lee, A. H., Elliott, D. M. Multi-scale loading and damage mechanisms of plantaris and rat tail tendons. Journal of Orthopaedic Research. 37 (8), 1827-1837 (2019).
- Williams, I. F., Heaton, A., McCullagh, K. G. Cell morphology and collagen types in equine tendon scar. Research in Veterinary Science. 28 (3), 302-310 (1980).
- Maffulli, N., Ewen, S. W. B., Waterston, S. W., Reaper, J., Barrass, V. Tenocytes from ruptured and tendinopathic achilles tendons produce greater quantities of type III collagen than tenocytes from normal achilles tendons: An in vitro model of human tendon healing. American Journal of Sports Medicine. 28 (4), 499-505 (2000).
- Pajala, A., Melkko, J., Leppilahti, J., Ohtonen, P., Soini, Y., Risteli, J. Tenascin-C and type I and III collagen expression in total Achilles tendon rupture. An immunohistochemical study. Histology and Histopathology. 24 (10), 1207-1211 (2009).
- Best, K. T., et al. Scleraxis-lineage cell depletion improves tendon healing and disrupts adult tendon homeostasis. eLife. 10, e62203(2021).
- Lehner, C., et al. Tenophages: A novel macrophage-like tendon cell population expressing CX3CL1 and CX3CR1. DMM Disease Models and Mechanisms. 12 (12), dmm041384(2019).
- Ajalik, R. E., et al. Human organ-on-a-chip microphysiological systems to model musculoskeletal pathologies and accelerate therapeutic discovery. Frontiers in Bioengineering and Biotechnology. 10, 846230(2022).
- Ingber, D. E. Human organs-on-chips for disease modelling, drug development and personalized medicine. Nature Reviews Genetics. 23 (8), 467-491 (2022).
- Brehm, M. A., Shultz, L. D., Luban, J., Greiner, D. L. Overcoming current limitations in humanized mouse research. The Journal of Infectious Diseases. 208 Suppl (Suppl 2), 125-130 (2013).
- Nunan, R., Harding, K. G., Martin, P. Clinical challenges of chronic wounds: searching for an optimal animal model to recapitulate their complexity. Disease Models & Mechanisms. 7 (11), 1205-1213 (2014).
- Costa-Almeida, R., Calejo, I., Reis, R. L., Gomes, M. E. Crosstalk between adipose stem cells and tendon cells reveals a temporal regulation of tenogenesis by matrix deposition and remodeling. Journal of Cellular Physiology. 233 (7), 5383-5395 (2018).
Reprints and Permissions
